| Version | Summary | Created by | Modification | Content Size | Created at | Operation |
|---|---|---|---|---|---|---|
| 1 | Joseph Akpan | -- | 4233 | 2023-09-19 10:47:28 | | | |
| 2 | Sirius Huang | Meta information modification | 4233 | 2023-09-20 03:02:07 | | |
Video Upload Options
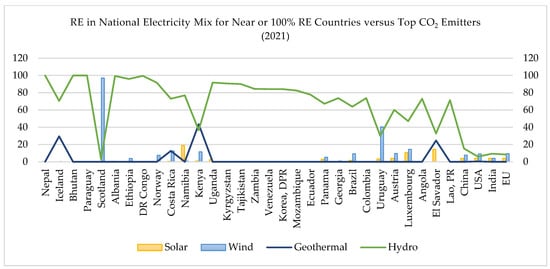
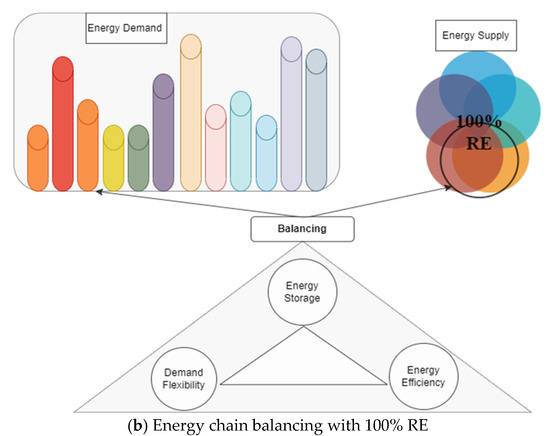
Some advanced countries’ rapid population, economic growth, and energy consumption expansion contribute significantly to global CO2 emissions. And while developed countries have achieved 100% universal access to electricity, mainly from non-renewable sources, many developing countries still lack it. This presents challenges and opportunities for achieving the United Nations’ Sustainable Development Goals (SDGs) 7 and 13 of generating all energy from cleaner or low-carbon sources to reduce CO2 emissions in all countries and combating climate change consequences. Renewable energies have been widely acknowledged to greatly advance this endeavour, resulting in many studies and about 30 countries already with over 70% of their national electricity mix from RE. It has birthed a new paradigm and an emerging field of 100% RE for all purposes, receiving much attention from academia and in public discourse.
1. Concept Background

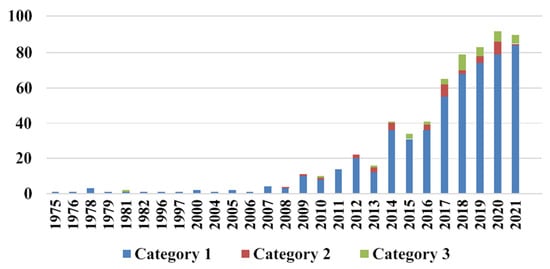
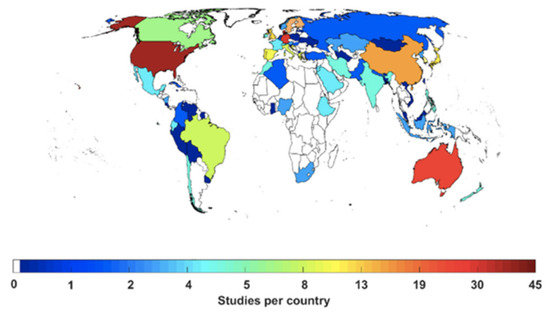
2. History of 100% RE Studies
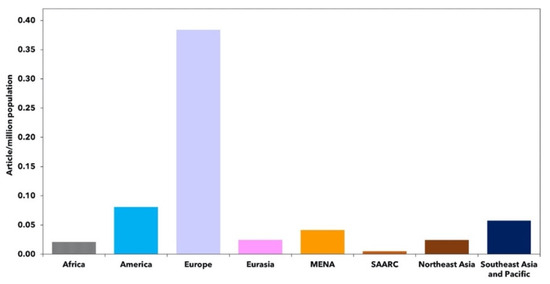
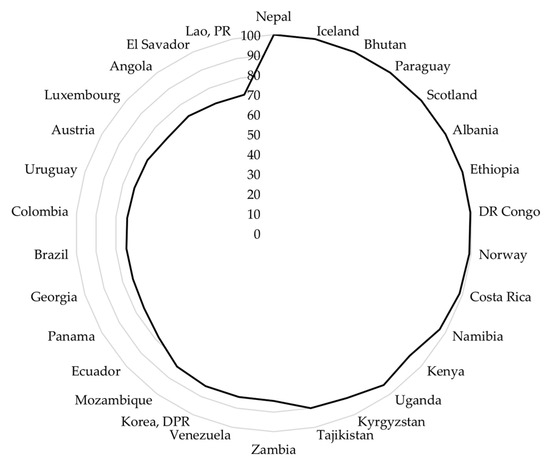
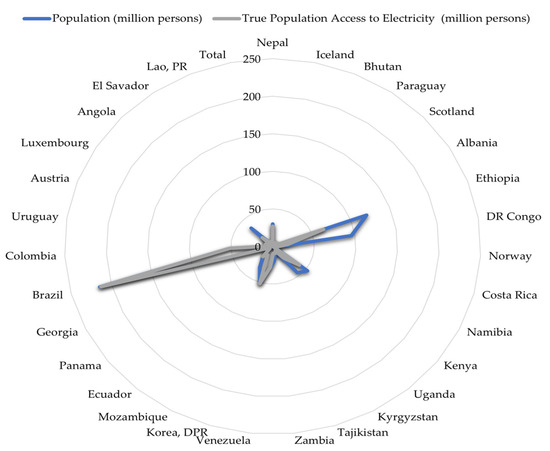
| Country | Highlights |
|---|---|
| Iceland, Kenya | Geothermal utilisation With abundant geothermal resources from volcanic activities, Iceland has harnessed geothermal energy for heating and electricity. It has enabled the country to achieve high levels of renewable energy utilisation. New energy technologies integration With ample renewable energy sources such as geothermal and hydroelectric, Iceland focuses on energy storage technologies such as pumped-hydro storage to store extra energy during high-generation and release during low-generation times with high demands. |
| Norway | Hydropower dominance An abundance of hydropower resources generates a significant portion of its electricity. Excess electricity for hydrogen production They also utilise their excess renewable energy to produce hydrogen for other sectors such as transportation. Taking the global frontier in electric vehicle (EV) utilisation It is a global leader in EV adoption, reducing its dependency on fossil fuels for transportation. |
| Iceland/Norway | Regional collaboration and grid interconnections Nordic countries such as Norway and Iceland, including Sweden, Denmark, and Finland, have collaborated on energy interconnections, enabling them to share excess renewable energy and balance out variations in generation. |
| Costa Rica | Local community initiatives They have made significant strides toward renewable energy by involving local communities and focusing on decentralised energy production through solar, wind, and hydropower energy. Hydropower and geothermal utilisation They capitalised on their unique geography to harness hydropower and geothermal energy. |
| Uruguay | Supporting policy regulatory environment Uruguay’s success in renewable energy can be attributed to its stable regulatory environment, enabling the growth of wind and solar energy projects. |
| Ethiopia, Zambia, DR. Congo, Uganda, Kyrgyzstan, Tajikistan, Venezuela, Korea DPR, Angola, Mozambique, Ecuador, Kenya, Columbia, Lao PR | Hydropower dominance Hydropower resources are abundant, helping to generate a significant portion of its electricity from this source. |
| Scotland | Wind power dominance and supporting policy regulatory environment Scotland has made progress in using wind power in its grid. Offshore wind farms are a major cause for its renewable energy success. It has invested much in wind power and passed advantageous legislation to promote renewable energy. |
3. Notable Approaches Facilitating near or 100% RE Successes in Countries
| Country | RE Technology Covered in the 100% RE Studies | Target Year | Actual RE % in National Mix (2021) | Ref. | ||||||
|---|---|---|---|---|---|---|---|---|---|---|
| Solar | Wind | Hydropower | Bioenergy | Geothermal | Others | Storage | ||||
| China (1) | - | - | - | - | - | G | - | N/D | 28.91 | [61] |
| China (2) | ✔ | ✔ | - | ✔ | - | - | - | N/D | 28.91 | [62] |
| China (3) | - | - | - | - | - | G | - | 2030 | 28.91 | [63] |
| USA (1) | - | - | - | - | - | S | - | 2050 | 20.74 | [40] |
| USA (2) | ✔ | ✔ | - | - | - | - | - | 2040–2045 | 20.74 | [36] |
| India (1) | - | - | ✔ | - | - | P2X | ✔ | 2050 | 19.38 | [38] |
| India (2) | - | - | - | - | - | - | - | N/D | 19.38 | [34] |
| Europe, Eurasia, and MENA regions | ✔ | ✔ | ✔ | ✔ | ✔ | G | - | 2030 | - | [64] |
| Country | Summary of Studies | Support Mechanisms and Evaluation Approaches Used | Target Year for 100% RE | Ref. |
|---|---|---|---|---|
| China (1) | One of the earliest experimental projects into 100% RE. This study found China’s large domestic RE sources promising, suggesting a 100% RE system analysis for China. |
|
N/D | [61] |
| China (2) | Design optimisation is suggested for improving 100% renewable energy systems in low-density areas. Integration and performance of 100% RES were investigated in 30 Chinese cities with payback times under six years, showing that future breakthroughs could shorten the payback period. |
|
N/D | [62] |
| China (3) | This Beijing study used two-phase energy system models to study Beijing’s 2030 energy market reaching 100% RE. The reference scenario uses 72% more primary fuel than the RES scenario 2030. |
|
2030 | [63] |
| USA (1) | 100% renewable energy (RE) in US electric power networks were simulated. The least-cost buildout reaches 57% RE penetration in 2050 under base conditions. According to this base scenario, CO2 abatement costs of 80%, 90%, 95%, and 100% RE are USD 25, USD 33, USD 40, and USD 61/ton, with system costs rising from USD 30 to USD 36/MWh at 95% (achieved in 2040) and USD 39/MWh at 100%. |
|
2050 | [40] |
| USA (2) | New Mexico, a US state with great solar and wind potential, is used in this study. An optimisation problem is proposed to determine the amount of renewable generation and energy storage needed to balance 100% of a utility’s hourly electricity demand over several years at a desired cost. |
|
2040–2045 | [36] |
| India (1) | The model optimises the least cost combination of RE power plants and storage technologies to create a completely RE-based power system by 2050 based on 2015 installed power plant capacities, lives, and total energy demand. The levelised cost of electricity falls from EUR 58/MWhe to EUR 52/MWhe in 2050, enabling a 100% renewable energy system. |
|
2050 | [38] |
| India (2) | Delhi’s 100% renewable energy system’s technological and economic potential is examined in this study. Delhi may promote a regional energy transition by reducing primary energy by 40%, energy costs by 25%, greenhouse gas emissions, air pollution, and health costs. |
|
N/D | [34] |
| Europe, Eurasia, and MENA regions | This study explored the feasibility of a regional integrated renewable energy-based carbon-neutral power system using existing energy generation, storage, and transmission technologies throughout Europe, Eurasia, the Middle East, and North Africa. With a total LCOE of about EUR 42/MWh, the result showed that the integration could produce an economically viable and sustainable energy system less expensive than coal-CCS or brand-new nuclear options, helping improve stability flexibility and lessen the need for energy storage. |
|
2030 | [64] |
| Japan (1) | The research designed and evaluated a renewable energy system for Akita, Japan. Wind power potential is estimated at 35.2 TWh/year, greatly above the 11.3 TWh/year electricity need. Batteries must have 48.4 GWh to meet yearly demand for over 1000 h. Batteries produce hydrogen, cutting electricity costs by 57% and overall costs by 32%. |
|
N/D | [37] |
| Japan (2) | Akita prefecture’s 100% renewable energy system’s biomass power cost and availability are examined in a second study [37]. Batteries met demand when other energy sources failed. The “no biomass”, “supply shortage”, and “baseload” situations were explored. Compared to “no biomass” electricity prices, “baseload” lowered them all. |
|
[39] | |
| Japan (3) | Japan’s renewable energy future using a 40-year hourly energy balance model was examined. Under restrictions, differential evolution finds the lowest-cost solution. Japan has 14 times more solar and offshore wind resources than needed for 100% renewable electricity, and solar costs USD 86/megawatt-hour and wind USD 110. Japan can be power self-sufficient at competitive prices despite solar photovoltaic and offshore wind deployment constraints. |
|
2050 | [27] |
| Germany (1) | The study tried to clarify the possibility of Germany’s 100% renewable energy transition in 2050. Consumption changes to Germany’s heating, industrial, transport, and power sectors’ energy systems were made using renewable resource potential, energy system costs, and primary energy supply. This change is feasible technically and economically, but it requires action to implement it efficiently and affordably. |
|
2050 | [35] |
| Germany (2) | This research examines Germany’s 100% renewable and sector-coupled energy system’s viability. OSeEM-DE, an hourly optimisation tool, uses open energy modelling to study the German energy system. Volatile generators cost EUR 17.6–26.6 billion annually, and heat generators cost EUR 23.7–28.8 billion annually. Parametric scenarios affect investment capacities and component costs. The model recommends EUR 2.7–3.9 bn/yr for power and heat storage. According to sensitivity analysis, storage and grid expansion maximise system flexibility and lower investment costs. |
|
N/D | [54] |
| Iran | The report forecasts the possibility of 100% renewable in Iran by 2050. Iranian electricity capacity demands from 2015 to 2050 were simulated hourly. It estimates that renewable energy (RE) will supply 100% of the world’s power at EUR 41–47/MWhe by 2050, while EUR 32–40/MWhe is unfeasible unless the target time is extended. |
|
2050 | [42] |
| Canada | This article evaluates the infrastructure costs for transitioning to carbon neutrality for Canada’s 10 provinces until 2060. It finds that most of Canada’s provinces stand to benefit from a pan-Canadian energy transition by capturing fossil fuel savings. |
|
2060 | [55] |
| South Korea | The research develops a renewable energy forecasting model using Korean energy policy as a case study. It analyses four renewable energy scenarios using deep-learning-based models to anticipate power demand and generation. The lowest economic–environmental costs, steady electricity for demand, and 100% renewable energy come from an integrated gasification combined cycle, onshore and offshore wind farms, solar power plants, and fuel cell facilities. |
|
Annual | [57] |
| Indonesia | This study investigates Indonesia’s 2050 100% renewable energy power system transition. TIMES’ least-cost optimisation analysed 27 power plants and 3 energy storage systems utilising 24 h time slices and hourly demand and supply operational data. It found that nuclear and solar PV utility scale will supply 16% and 70% of electricity output and requires USD 95 billion and 215 million tons of CO2-eq. Nuclear-free power increases solar PV utility scale and battery capacity, land requirement, supply variability, and energy production cost by 9.7%. |
|
2050 | [33] |
| Saudi Arabia (1) | This research indicates that by combining the electricity and growing desalination sectors, Saudi Arabia can achieve a 100% renewable energy power grid by 2050. By 2040, solar photovoltaics will account for 79% of power output, bringing the system’s LCOE down to EUR 41/MWh. Since the integrated scenario uses less battery storage and power-to-gas plants, it lowers annual levelized costs by 1% to 3%. |
|
2050 | [45] |
| Saudi Arabia (2) | As a follow-up to the first Saudi Arabia 100% RE study in [45], the new study presents that a full transition to renewable energy can be possible if single-axis tracking PV and battery storage are the system’s primary LCOE drivers. By 2050, if about 79% of all electricity will be produced by PV systems using only single-axis tracking, 441 of power could come from battery storage. Decreasing capital expenditures allows desalination facilities to adapt to changing conditions more quickly. |
|
2040–2050 | [44] |
| South Africa (1) | South Africa’s energy transition is simulated hourly until 2050. The findings imply solar PV and wind energy can replace coal in electricity. The Best Policy Scenario raises electricity-levelized costs somewhat, while the Current Policy Scenario raises them dramatically. The Best Policy Scenario has 25% lower electricity bills than the Current Policy Scenario without GHG emissions. The cheapest renewable energy system eliminates new coal and nuclear power plants and steadily reduces fossil fuel capacity. |
|
2050 | [31] |
| Egypt (1) | Egypt’s wind energy potential is understudied, so the author examined two 300 MW wind farms for roughness factor and wind power density. Kharga and Dakhla South wind farms can generate 1130 GWh annually with good capacity factors and low electricity costs, lower than the country’s needs. Further investment in these wind farms can help Egypt and Southern Europe completely reduce fossil fuel dependence by exporting. |
|
Annual | [65] |
References
- Güven, A.F.; Samy, M.M. Performance analysis of autonomous green energy system based on multi and hybrid metaheuristic optimization approaches. Energy Convers. Manag. 2022, 269, 116058.
- Hansen, K.; Breyer, C.; Lund, H. Status and perspectives on 100% renewable energy systems. Energy 2019, 175, 471–480.
- Khalili, S.; Breyer, C. Review on 100% Renewable Energy System Analyses—A Bibliometric Perspective. IEEE Access 2022, 10, 125792–125834.
- Breyer, C.; Khalili, S.; Bogdanov, D.; Ram, M.; Oyewo, A.S.; Aghahosseini, A.; Gulagi, A.; Solomon, A.A.; Keiner, D.; Lopez, G.; et al. On the History and Future of 100% Renewable Energy Systems Research. IEEE Access 2022, 10, 78176–78218.
- Jacobson, M.Z.; Delucchi, M.A.; Bauer, Z.A.F.; Goodman, S.C.; Chapman, W.E.; Cameron, M.A.; Bozonnat, C.; Chobadi, L.; Clonts, H.A.; Enevoldsen, P.; et al. 100% Clean and Renewable Wind, Water, and Sunlight All-Sector Energy Roadmaps for 139 Countries of the World. Joule 2017, 1, 108–121.
- Jacobson, M.Z.; Delucchi, M.A.; Cameron, M.A.; Mathiesen, B.V. Matching demand with supply at low cost in 139 countries among 20 world regions with 100% intermittent wind, water, and sunlight (WWS) for all purposes. Renew. Energy 2018, 123, 236–248.
- Olabi, A.; Abdelkareem, M.A. Renewable energy and climate change. Renew. Sustain. Energy Rev. 2022, 158, 112111.
- Kung, C.-C.; McCarl, B. Sustainable Energy Development under Climate Change. Sustainability 2018, 10, 3269.
- IPCC. The Intergovernmental Panel on Climate Change (IPCC). Available online: https://www.ipcc.ch/ (accessed on 11 July 2023).
- Fu, B.; Li, J.; Gasser, T.; Ciais, P.; Piao, S.; Tao, S.; Shen, G.; Lai, Y.; Han, L.; Li, B. Climate Warming Mitigation from Nationally Determined Contributions. Adv. Atmos. Sci. 2022, 39, 1217–1228.
- Mahlia, T.; Saktisahdan, T.; Jannifar, A.; Hasan, M.; Matseelar, H. A review of available methods and development on energy storage; technology update. Renew. Sustain. Energy Rev. 2014, 33, 532–545.
- Lund, H.; Andersen, A.N.; Østergaard, P.A.; Mathiesen, B.V.; Connolly, D. From electricity smart grids to smart energy systems—A market operation based approach and understanding. Energy 2012, 42, 96–102.
- Schirone, L.; Pellitteri, F. Energy Policies and Sustainable Management of Energy Sources. Sustainability 2017, 9, 2321.
- Ahmad, S.; Shafiullah; Ahmed, C.B.; Alowaifeer, M. A Review of Microgrid Energy Management and Control Strategies. IEEE Access 2023, 11, 21729–21757.
- Olatomiwa, L.; Mekhilef, S.; Ismail, M.; Moghavvemi, M. Energy management strategies in hybrid renewable energy systems: A review. Renew. Sustain. Energy Rev. 2016, 62, 821–835.
- Liu, Y.; Yu, S.; Zhu, Y.; Wang, D.; Liu, J. Modeling, planning, application and management of energy systems for isolated areas: A review. Renew. Sustain. Energy Rev. 2018, 82, 460–470.
- Schulze, M.; Nehler, H.; Ottosson, M.; Thollander, P. Energy management in industry—A systematic review of previous findings and an integrative conceptual framework. J. Clean. Prod. 2016, 112, 3692–3708.
- Oyewo, A.S.; Sterl, S.; Khalili, S.; Breyer, C. Highly renewable energy systems in Africa: Rationale, research, and recommendations. Joule 2023, 7, 1437–1470.
- Ritchie, H. Who Has Contributed Most to Global CO2 Emissions? Available online: https://www.ourworldindata.org/contributed-mostt-co2 (accessed on 12 July 2023).
- World Bank. Population. Available online: https://data.worldbank.org/indicator/SP.POP.TOTL?end=2022&locations=DZ&start=2002 (accessed on 16 July 2023).
- United Nations-Department of Economic and Social Affairs Population Division. World Population Prospects. Available online: https://population.un.org/wpp (accessed on 25 July 2023).
- Hagedorn, G.; Loew, T.; Seneviratne, S.I.; Lucht, W.; Beck, M.-L.; Hesse, J.; Knutti, R.; Quaschning, V.; Schleimer, J.-H.; Mattauch, L.; et al. The concerns of the young protesters are justified: A statement by Scientists for Future concerning the protests for more climate protection. GAIA—Ecol. Perspect. Sci. Soc. 2019, 28, 79–87.
- Palzer, A.; Henning, H.-M. A comprehensive model for the German electricity and heat sector in a future energy system with a dominant contribution from renewable energy technologies—Part II: Results. Renew. Sustain. Energy Rev. 2014, 30, 1019–1034.
- Henning, H.-M.; Palzer, A. A comprehensive model for the German electricity and heat sector in a future energy system with a dominant contribution from renewable energy technologies—Part I: Methodology. Renew. Sustain. Energy Rev. 2014, 30, 1003–1018.
- Bamisile, O.; Huang, Q.; Xu, X.; Hu, W.; Liu, W.; Liu, Z.; Chen, Z. An approach for sustainable energy planning towards 100 % electrification of Nigeria by 2030. Energy 2020, 197, 117172.
- Jacobson, M.Z. The cost of grid stability with 100 % clean, renewable energy for all purposes when countries are isolated versus interconnected. Renew. Energy 2021, 179, 1065–1075.
- Cheng, C.; Blakers, A.; Stocks, M.; Lu, B. 100% renewable energy in Japan. Energy Convers. Manag. 2022, 255, 115299.
- Akuru, U.B.; Onukwube, I.E.; Okoro, O.I.; Obe, E.S. Towards 100% renewable energy in Nigeria. Renew. Sustain. Energy Rev. 2017, 71, 943–953.
- Johannsen, R.M.; Mathiesen, B.V.; Kermeli, K.; Crijns-Graus, W.; Østergaard, P.A. Exploring pathways to 100% renewable energy in European industry. Energy 2023, 268, 126687.
- DGB Group. China’s Journey to 100% Renewable Energy: Opportunities and Challenges; DGB Group: Hoofddorp, The Netherlands, 2022.
- Oyewo, A.S.; Aghahosseini, A.; Ram, M.; Lohrmann, A.; Breyer, C. Pathway towards achieving 100% renewable electricity by 2050 for South Africa. Sol. Energy 2019, 191, 549–565.
- Marocco, P.; Novo, R.; Lanzini, A.; Mattiazzo, G.; Santarelli, M. Towards 100% renewable energy systems: The role of hydrogen and batteries. J. Energy Storage 2023, 57, 106306.
- Reyseliani, N.; Purwanto, W.W. Pathway towards 100% renewable energy in Indonesia power system by 2050. Renew. Energy 2021, 176, 305–321.
- Ram, M.; Gulagi, A.; Aghahosseini, A.; Bogdanov, D.; Breyer, C. Energy transition in megacities towards 100% renewable energy: A case for Delhi. Renew. Energy 2022, 195, 578–589.
- Hansen, K.; Mathiesen, B.V.; Skov, I.R. Full energy system transition towards 100% renewable energy in Germany in 2050. Renew. Sustain. Energy Rev. 2019, 102, 1–13.
- Copp, D.A.; Nguyen, T.A.; Byrne, R.H.; Chalamala, B.R. Optimal sizing of distributed energy resources for planning 100% renewable electric power systems. Energy 2021, 239, 122436.
- Furubayashi, T. Design and analysis of a 100% renewable energy system for Akita prefecture, Japan. Smart Energy 2021, 2, 100012.
- Gulagi, A.; Bogdanov, D.; Breyer, C. The Demand for Storage Technologies in Energy Transition Pathways towards 100% Renewable Energy for India. Energy Procedia 2017, 135, 37–50.
- Furubayashi, T. The role of biomass energy in a 100% renewable energy system for Akita prefecture, Japan. Energy Storage Sav. 2022, 1, 148–152.
- Cole, W.J.; Greer, D.; Denholm, P.; Frazier, A.W.; Machen, S.; Mai, T.; Vincent, N.; Baldwin, S.F. Quantifying the challenge of reaching a 100% renewable energy power system for the United States. Joule 2021, 5, 1732–1748.
- Hohmeyer, O.H.; Bohm, S. Trends toward 100% renewable electricity supply in Germany and Europe: A paradigm shift in energy policies. WIREs Energy Environ. 2014, 4, 74–97.
- Ghorbani, N.; Aghahosseini, A.; Breyer, C. Transition towards a 100% Renewable Energy System and the Role of Storage Technologies: A Case Study of Iran. Energy Procedia 2017, 135, 23–36.
- Bamisile, O.; Dongsheng, C.; Li, J.; Adun, H.; Olukoya, R.; Bamisile, O.; Huang, Q. Renewable energy and electricity incapacitation in sub-Sahara Africa: Analysis of a 100% renewable electrification in Chad. Energy Rep. 2023, 9, 1–12.
- Caldera, U.; Breyer, C. Impact of Battery and Water Storage on the Transition to an Integrated 100% Renewable Energy Power System for Saudi Arabia. Energy Procedia 2017, 135, 126–142.
- Caldera, U.; Bogdanov, D.; Afanasyeva, S.; Breyer, C. Role of Seawater Desalination in the Management of an Integrated Water and 100% Renewable Energy Based Power Sector in Saudi Arabia. Water 2017, 10, 3.
- Procter, R.J. 100% renewables study has limited relevance for carbon policy. Electr. J. 2018, 31, 67–77.
- Ritchie, R.; Mispy, O.-O. SDG Tracker-Measuring Progress towards the Sustainable Development Goals. 2021. Available online: https://sdg-tracker.org/energy (accessed on 15 June 2023).
- Ritchie, H.; Roser, M. Energy. 2022. Available online: https://www.ourworldindata.org/energy-access (accessed on 14 August 2023).
- International Renewable Energy Agency; European Commission. Renewable Energy Prospects for the European Union; International Renewable Energy Agency (IRENA): Masdar City, Abu Dhabi, 2018.
- Fritz, L.; Hansmann, R.; Dalimier, B.; Binder, C.R. Perceived impacts of the Fridays for Future climate movement on environmental concern and behaviour in Switzerland. Sustain. Sci. 2023, 18, 2219–2244.
- Aghahosseini, A.; Bogdanov, D.; Breyer, C. Towards sustainable development in the MENA region: Analysing the feasibility of a 100% renewable electricity system in 2030. Energy Strategy Rev. 2020, 28, 100466.
- Mischke, P.; Karlsson, K.B. Modelling tools to evaluate China’s future energy system—A review of the Chinese perspective. Energy 2014, 69, 132–143.
- Ameyaw, B.; Li, Y.; Ma, Y.; Agyeman, J.K.; Appiah-Kubi, J.; Annan, A. Renewable electricity generation proposed pathways for the US and China. Renew. Energy 2021, 170, 212–223.
- Maruf, N.I. Open model-based analysis of a 100% renewable and sector-coupled energy system–The case of Germany in 2050. Appl. Energy 2021, 288, 116618.
- Stringer, T.; Joanis, M. Assessing energy transition costs: Sub-national challenges in Canada. Energy Policy 2022, 164, 112879.
- Vaillancourt, K.; Bahn, O.; Frenette, E.; Sigvaldason, O. Exploring deep decarbonization pathways to 2050 for Canada using an optimization energy model framework. Appl. Energy 2017, 195, 774–785.
- Nam, K.; Hwangbo, S.; Yoo, C. A deep learning-based forecasting model for renewable energy scenarios to guide sustainable energy policy: A case study of Korea. Renew. Sustain. Energy Rev. 2020, 122, 109725.
- Kharrich, M.; Selim, A.; Kamel, S.; Kim, J. An effective design of hybrid renewable energy system using an improved Archimedes Optimization Algorithm: A case study of Farafra, Egypt. Energy Convers. Manag. 2023, 283.
- Saiah, S.B.D.; Stambouli, A.B. Prospective analysis for a long-term optimal energy mix planning in Algeria: Towards high electricity generation security in 2062. Renew. Sustain. Energy Rev. 2017, 73, 26–43.
- Oyewo, A.S.; Aghahosseini, A.; Bogdanov, D.; Breyer, C. Pathways to a fully sustainable electricity supply for Nigeria in the mid-term future. Energy Convers. Manag. 2018, 178, 44–64.
- Liu, W.; Lund, H.; Mathiesen, B.V.; Zhang, X. Potential of renewable energy systems in China. Appl. Energy 2011, 88, 518–525.
- Chen, X.; Xiao, J.; Yuan, J.; Xiao, Z.; Gang, W. Application and performance analysis of 100% renewable energy systems serving low-density communities. Renew. Energy 2021, 176, 433–446.
- Zhao, G.; Guerrero, J.M.; Jiang, K.; Chen, S. Energy modelling towards low carbon development of Beijing in 2030. Energy 2017, 121, 107–113.
- Bogdanov, D.; Koskinen, O.; Aghahosseini, A.; Breyer, C. Integrated renewable energy based power system for Europe, Eurasia and MENA regions. In Proceedings of the 2016 International Energy and Sustainability Conference (IESC), Cologne, Germany, 30 June–1 July 2016.
- Ahmed, A.S. Analysis the economics of sustainable electricity by wind and its future perspective. J. Clean. Prod. 2019, 224, 729–738.


