Submitted Successfully!
To reward your contribution, here is a gift for you: A free trial for our video production service.
Thank you for your contribution! You can also upload a video entry or images related to this topic.
Version Summary Created by Modification Content Size Created at Operation
1 -- 2947 2023-09-12 13:33:59 |
2 format change Meta information modification 2947 2023-09-13 04:36:01 |

Video Upload Options

Do you have a full video?

Confirm

Are you sure to Delete?
Cite
If you have any further questions, please contact Encyclopedia Editorial Office.
Jordão, A.M.; Vilela, A.; Cosme, F. Sensorial Impact of Alcohol in Wine. Encyclopedia. Available online: https://encyclopedia.pub/entry/49074 (accessed on 07 September 2024).
Jordão AM, Vilela A, Cosme F. Sensorial Impact of Alcohol in Wine. Encyclopedia. Available at: https://encyclopedia.pub/entry/49074. Accessed September 07, 2024.
Jordão, António M., Alice Vilela, Fernanda Cosme. "Sensorial Impact of Alcohol in Wine" Encyclopedia, https://encyclopedia.pub/entry/49074 (accessed September 07, 2024).
Jordão, A.M., Vilela, A., & Cosme, F. (2023, September 12). Sensorial Impact of Alcohol in Wine. In Encyclopedia. https://encyclopedia.pub/entry/49074
Jordão, António M., et al. "Sensorial Impact of Alcohol in Wine." Encyclopedia. Web. 12 September, 2023.
Sensorial Impact of Alcohol in Wine
Edit

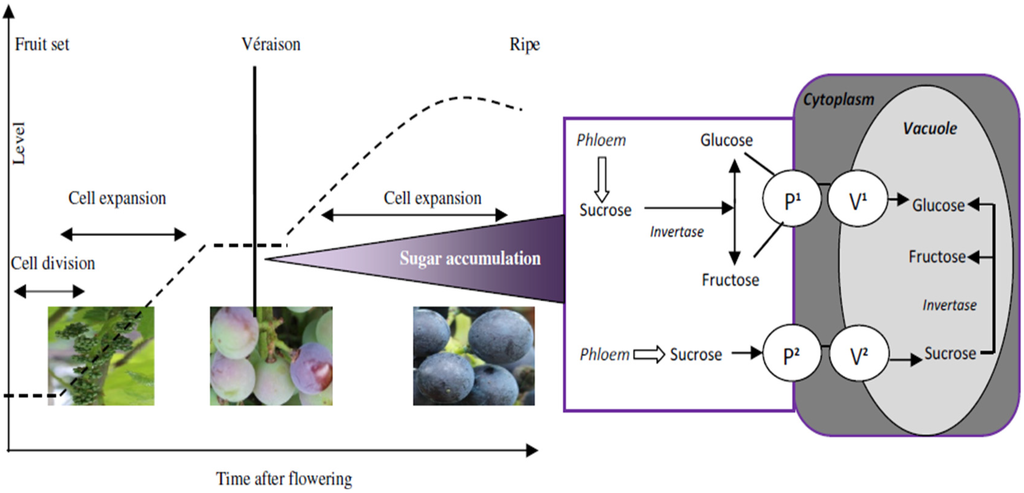
The quality of grapes and wine quality, flavor, stability, and sensory characteristics depend on the content and composition of several different groups of compounds from grapes. One of these groups of compounds is sugars and, consequently, the alcohol content quantified in wines after alcoholic fermentation. During grape berry ripening, sucrose transported from the leaves is accumulated in the berry vacuoles as glucose and fructose. The wine alcohol content continues to be a challenge in enology, as it is also the study of the role of chemosensory factors in alcohol intake and consumer preferences. Several technical and scientific advances have occurred, such as identifying receptors and other essential molecules involved in the transduction mechanisms of flavor. In addition, consumers know that wines with high alcohol content can cause a gustatory disequilibrium affecting wine sensory perceptions, leading to unbalanced wines.

alcohol content alcohol reduction technologies grapes sensory perception sugar accumulation wine

1. General Introduction

The sugar composition of berries has a crucial role in wine quality since they determine the alcohol content of the wines. Grape berry sugar composition and concentration change during grape ripening and can be influenced by many factors, such as environment and viticulture management.
Alcohol is the most abundant volatile compound in wine, and it can modify the sensory perception of aromatic attributes and detect volatile compounds [1]. Therefore, alcohol is essential for wine sensory sensations but also by their interaction with other wine components, such as aromas [1] and tannins [2][3], also influencing wine viscosity and body [4] and our perceptions of astringency, sourness, sweetness, smell, and flavor [5].
In the last years, the alcohol content in wines has increased due to different factors. One is the potential sugar increase in musts, attributed to the probable climate change [6][7]. However, at the same time, a significant number of consumers from several countries, especially from Europe, demand more reduced alcohol beverages (9%–13% v/v) as a result of health and social concerns (i.e., traffic penalties) [8][9][10]. The increasing alcohol levels in wine could be resolved using techniques to remove or lower the wine alcohol content. However, it is essential to know the limitations of these techniques on the wine's sensory characteristics and provide information related to wine quality and consumer acceptance of these wines.
Mouthfeel and texture are the significant determinants of consumer’s preference for foods, including beverages [11][12][13]. Viscosity, density, and surface tension are the essential rheological properties that affect the mouthfeel of liquid food products, such as wine. They also modify sensory properties like saltiness, sweetness, bitterness, flavor, and astringency [14][15][16]. It is essential to understand how and where the interactions are generated as they impact food products' flavor perception and critical sensory profile. There are physical interactions between the components in the food or beverage matrix influencing the volatile release [17] and viscosity [18] and multi-modal interactions resulting from the cognitive or psychological integration of the anatomically independent sensory systems [19].
Physical viscosity, density, and yield stress have also been used to give a more comprehensive profile of the rheological properties of fluids [20]. While white wine alcohol concentration was highly correlated with the perceived intensity and physical measurements of viscosity and density, the perceived consistency and perceived density maxima were best described by quadratic and cubic models, respectively [4]. Intensity maxima for thickness and density occurred at 10% (v/v) and 12% (v/v) white wine alcohol concentration, respectively. However, white wines of 7% (v/v) to 14% (v/v) alcohol concentration were not statistically differentiated for either attribute (perceived viscosity and density) [4]. For example, alcohol is commonly utilized in composing various beverages and flavored vodkas. For instance, in 2008, Finland Vodka Company noted a 30% increase in the sale of flavored vodkas, which contain herb extracts and essences, plant distillates, fruits and their juices, and volatile aromas [21]. According to Pankiewicz and Jamroz [21], a link was found between the concentrations of alcohol in pure vodka and its blends with pear nectar and the perceived sensory viscosity and density of the drink.

2. Grape Berry Composition—Sugars

Sugar accumulation in grape berries is an important phenomenon that significantly impacts the amount of alcohol in wine. In addition, in berries, total sugar is a vital fruit quality factor in table grapes. The predominant sugars present in grapes are glucose and fructose, with only trace sucrose content in most cultivars' grape berries. Only a few high-sucrose content cultivars are detected in Vitis rotundifolia and hybrids between Vitis labrusca and Vitis vinifera [22][23][24]. Shiraishi et al. [25] identified two types of grapes based on sugar composition: hexose accumulators, for which the glucose/(fructose + sucrose) ratio was >0.8, and sucrose accumulators, for which this ratio was <0.8. According to Dai et al. [24], most Vitis vinifera cultivars have a glucose/fructose ratio of 1 at maturity, while this ratio varies from 0.47 to 1.12 in wild species. In addition, only a few species (Vitis champinii and Vitis doaniana) accumulate more glucose than fructose. Liu et al. [26] analyzed the sugar concentration of 98 different grape cultivars. They concluded that glucose and fructose were the predominant sugars in grape berries, ranging from 45.86 to 122.89 mg/mL and 47.64 to 131.04 mg/mL, respectively. Additionally, sucrose was present in trace amounts in most of the cultivars studied (except for two cultivars of hybrids between Vitis labrusca and Vitis vinifera, which contained large quantities of sucrose).
The accumulation of sugar in the form of glucose and fructose within the cellular medium, specifically in the vacuoles, is one of the main features of the ripening process in grape berries and is a primary commercial consideration for the grape grower, winemaker and dried grape producer. Thus, sugar content is an indicator often used to assess ripeness and to mark the harvest. Moreover, as most of the sugar is fermented to alcohol during the winemaking process, the measurement of sugar content, the so-called “must weight,” allows the control of alcohol content in the wine.

3. Sugar Accumulation during Grape Ripening

A schematic representation of grape berry development, sugar uptake, and metabolism during grape maturation is shown in Figure 1. Thus, during grape berry sugar accumulation, sucrose is produced in leaves by photosynthetic carbon assimilation and transported to the phloem berry [27]. Sucrose is loaded into the phloem by a symplastic or apoplastic mechanism [28]. The presence of an apoplastic step requires the involvement of membrane-located sugar transporter proteins (“hexose transporters” in Figure 1) mediating the exit of sucrose from the phloem and the uptake and compartmentation of sugars across the plasma membrane and the tonoplast of flesh cells [29].
Figure 1. Schematic representation of grape berry development, sugar uptake, and metabolism during grape maturation. The curve indicates changes in berry size, and two possible pathways are indicated for sugar uptake and metabolism. Legend: (-----) berry changes size. P1 and V1Hexose transporters; P2 and V2Sucrose transporters.
In the first phase of berry growth, most of the sugar imported into the fruit is metabolized, and grapes contain relatively low sugar levels. However, at véraison, sugar accumulation begins, and the imported sucrose is converted into hexoses, which are stored in the vacuole. The grape berries accumulate glucose and fructose in equal amounts at a relatively constant rate during ripening [30]. According to several authors [31][32], massive accumulation of glucose and fructose in the vacuoles of mesocarp cells occurs after véraison and, twenty days after this period, the hexose content of the grape berry is close to 1 M, with a glucose/fructose ratio of 1. Since sucrose is the primary translocated sugar in grapevine, the rapid accumulation of hexoses characterizing berry ripening must involve the activity of invertases. Their expression is high at the early stages of berry development but declines considerably when hexose accumulation starts [28]. In addition, Hawker [33] found that invertase enzyme activity in Sultana berries increased immediately after flowering and that the activity peaked 6–7 weeks later, at véraison, when the rapid accumulation of hexoses commenced. According to the same author, another enzyme that might be involved in the breakdown of sucrose is sucrose synthase, which also increases during véraison. Still, their maximal activity is low compared to the level of invertase activity (200–300 times less). Invertases catalyze the hydrolysis of sucrose provided by the phloem conducting complex into glucose and fructose. Different invertase isoforms are localized in the cell wall, cytoplasm, and vacuole. Hydrolysis of sucrose by cell wall invertase may promote unloading by preventing its retrieval by the phloem and maintaining the sucrose concentration gradient.

4. Factors that Affect the Sugar Accumulation and Level in Grape Berries

Complex mechanisms regulate berry sugar accumulation. For example, the expression of disaccharide transporter genes (DSTs) and monosaccharide transporter genes (MSTs), sugar transporter proteins that mediate the exit of sucrose from the phloem and the uptake of sugars across the plasma membrane and the tonoplast of flesh cells, may be affected by various parameters, including light, water, and ion status, wounding, fungal and bacterial attacks, and hormones [34][35][36]. According to several authors [24][37], sugar composition is mainly determined by genotype, and sugar concentration is strongly affected by factors such as environment and cultural management. For example, irrigation has a variable effect on sugar accumulation in the grape berries. Thus, according to several studies [38][39][40][41][42], there is a variation in sugar concentration (increase, decrease, or no changes) due to irrigation practice. Esteban et al. [39] analyzed the impact of water availability on the yield and must composition of Vitis vinifera L. cv. During the three-year period, Tempranillo grapes concluded that total soluble solids and the concentration of glucose and fructose were significantly higher in the irrigated vines than in the non-irrigated vines, mainly towards the end of ripening. On the other hand, Intrigliolo et al. [41] consider that the effects of irrigation on must and wine composition largely depend on the climatic characteristics of each year, namely by the different rainfall amounts and crop levels.
For several researchers [43][44], temperature is an important environmental factor affecting grape sugar accumulation. For temperatures above 25 °C, net photosynthesis decreases even at constant sun exposure [45]. In addition, for temperatures above 30 °C, several authors [46][47] have reported a reduction of berry size and weight, and metabolic processes and sugar accumulation may completely stop. However, although high temperatures accelerate grape maturation, according to Coombe [47], temperature effects on final sugar accumulation are reported to be relatively small. Higher temperatures (30 °C) may lead to higher suspended solid concentrations, but Brix levels higher than 24–25 Brix (238.2 g/L of sugar to 249.7 g/L of sugar; 14.15% (v/v) estimated alcohol to 14.84% (v/v) estimated alcohol) are likely not due to photosynthesis and sugar transport from leaves and wood, but to concentration by evaporation [48][49]. In recent years, the alcohol content of wines has increased due to different factors. One of them is the sugar increase in grapes, which must be attributed to climate change [50]. However, according to [44], the exceptionally high sugar concentrations reached at harvest today, especially in warm climates, may be associated with the desire to optimize technical or polyphenolic and aromatic maturity. Finally, moderate water deficit, UV-B radiation, and low temperatures (below 30 °C) have a positive effect during grape ripening by increasing sugar content in grape berries [51][52]. Duchêne and Schneider [53] showed that, over the last 30 years, the estimated alcohol level of Riesling grapes in Alsace increased by 2.5% (v/v) due to warmer ripening periods and earlier phenology. Additionally, Godden and Gishen [54] observed in Australian wines an increase in the alcohol content from 12.3% (v/v) to 13.9% (v/v) for red wines and from 12.2% (v/v) to 13.2% (v/v) for white wines, between 1984 and 2004.

5. Psychophysiology of Alcohol Perception

Taste strongly influences food intake [55], including alcohol consumption [56][57]. Alcohol activates olfactory, taste, and chem-esthetic receptors, and each modality is carried centrally by different nerves; these inputs affect the perception evoked by alcohol. Chemesthesis is defined as the chemical sensibility of the skin and mucous membranes. Chemesthetic sensations arise when chemical compounds activate receptors associated with other senses that mediate pain, touch, and thermal perception. Examples of chemesthetic feelings include the burn-like irritation from chili pepper, the coolness of menthol in mouthwashes and topical analgesic creams, the stinging or tingling of carbonation in the nose and mouth, and the tear-induction of onions. The oral consumption of alcohol by humans is accompanied by the chemosensory perception of flavor, which plays a vital role in its acceptance or rejection. Three independent sensory systems, taste, olfaction, and chemosensory irritation, are involved in the perception of flavor in food and wine in particular [58].
As Allen et al. [60] reported, humans perceive alcohol as a combination of sweet and bitter tastes, odors, and oral irritation (burning sensation). However, several researchers like Lanier et al. [58] found that some people describe experiences of more bitterness and less sweetness when drinking alcohol, and this directly relates to the genes they have inherited and individual differences in bitterness and sweetness as predictors of alcohol liking and intake in young adults. In addition, the perception of bitterness and sweetness also varies as a function of alcohol concentration [59][60].
Multiple studies [61][62] have linked variation in TAS2R (taste receptor, type 2) bitter receptor genes to alcohol intake. An important gene contributing to PTC (the ability to taste the bitterness of phenylthiocarbamide) perception has been identified [63]. The gene (TAS2R38—taste receptor, type 2, member 38), located on chromosome 7q36, is a member of the bitter taste receptor family. There are two common molecular forms (proline-alanine-valine (PAV) and alanine-valine-isoleucine (AVI)) of this receptor defined by three nucleotide polymorphisms that result in three amino acid substitutions: Pro49Ala, Ala262Val, and Val296Ile. Duffy et al. [64] reported that TAS2R38 haplotypes are associated with alcoholic intake, with AVI homozygotes, who perceive less bitterness from the bitter compound propylthiouracil (6-n-propylthiouracil (PROP) is a thiouracil-derived drug used to treat hyperthyroidism, including Graves’ disease, by decreasing the amount of thyroid hormone produced by the thyroid gland) consuming, significantly, more alcoholic drinks than heterozygotes or PAV homozygotes. More recently, Dotson et al. [65] reported associations between TAS2R38 and TAS2R13 polymorphisms and alcohol intake derived from the Alcohol Use Disorders Identification Test (AUDIT) in head and neck cancer patients.
In addition to bitter and sweet sensations, as was mentioned before, alcohol also irritates, commonly described as burning or stinging [58]. Burning sensations in the mouth are due, in part, to the activation of the transient receptor potential vanilloid receptor 1 (TRPV1) that is activated by noxious heat, capsaicin [66][67], and alcohol even at relatively low concentrations (0.1% to 3% v/v) [68]. When the TRPV1 gene is knocked out in mice, knockouts have a higher preference for alcohol and consume more than wild-type mice [69]. Collectively, these data suggest the TRPV1 receptor likely plays a role in the perception and acceptability of alcohol.
Many factors underlie the role that alcohol flavor plays in the development of alcohol preference and consumption patterns. Such factors include the activation of peripheral chemoreceptors by alcohol [67]; central mechanisms that mediate the hedonic responses to alcohol flavor [70]; learned associations of alcohol’s sensory attributes and its post-digestive effects and early postnatal exposure to alcohol flavor [71][72]; and genetically determined individual variation in chemosensation [21][59]. The study of the role of chemosensory factors in alcohol intake and preferences is of particular interest because the past decade has witnessed significant technical and scientific advances, which include the identification of receptors and other critical molecules involved in the transduction mechanisms of olfaction [73][74], chemosensory irritation [75], and taste [76][77][78][79].

6. The Effects of Ethanol on the Body and Other Sensory Characteristics of Wines

The terms “body” and “fullness” are wine attributes frequently used to describe the in-mouth impression of both red and white table wines [80]. Wines are regularly classified as being light, medium, or full-bodied. Presumably, wines of different styles appeal to different market segments and are consumed in various social and culinary contexts. However, despite its widespread use and application, there appears to be a lack of common understanding within the wine trade of what sensory aspects contribute to the wine body. Most importantly, there seems to be no agreed position on the conditions for “fullness” in wine or other alcoholic beverages. Despite the apparent lack of agreement on what constitutes body in wine, Gawel [81] showed that experienced wine tasters, with extensive practical training, had an equivalent understanding of “body” in white wines and considered the feature important in distinguishing between the wines. It has long been speculated that alcohol strongly contributes to palate fullness in white wine [82]. Pickering et al. [4] were the first to test this premise formally. They found that the perceived density of a de-alcoholized wine generally increased with increasing alcohol over a 14% (v/v) range, while its perceived viscosity was highest at 10% (v/v) ethanol. Later work [83] using model wine solutions showed a positive monotonic effect of alcohol content on perceived viscosity and density over the same alcohol range, further supporting a positive relationship between alcohol content and fullness in white wine.
The contribution of ethanol to wine sensory properties extends beyond that of possibly enhancing fullness. Ethanol affects the headspace concentrations of many wine volatiles [84] and contributes to sweetness [85]. Furthermore, ethanol-induced palate warmth and perceived viscosity may indirectly affect aroma and flavor perception. Moreover, according to the work of Joshi and Sandhu [86], the sensory evaluation results of different vermouths prepared with varying concentrations of ethanol, sugar levels, and spices extract showed significant differences for various sensory quality parameters. The data obtained revealed that for color and appearance, 12% (v/v) and 15% (v/v) of alcohol with 2.5% (w/v) spices extract scored better, but for aroma, virtually all the treatments were comparable. However, in total acidity, vermouth with 18% (v/v) ethanol scored lower than those with 12% (v/v) and 15% (v/v). In bitterness and astringency, vermouths of all the treatments were comparable. In overall quality, apple vermouth with 15% (v/v) ethanol, 2.5% (w/v) spices extract, and 4% (v/v) sugar content scored the highest. So, bitterness, astringency, and total acidity are influenced by the alcohol vermouth concentration. However, for Noble [87], the higher concentrations of alcohol in wines enhance bitterness intensity but do not affect the perception of astringency.

References

  1. Goldner, M.C.; Zamora, M.C.; di Leo Lira, P.; Gianninoto, H.; Bandoni, A. Effect of ethanol level in the perception of aroma attributes and the detection of volatile compounds in red wine. J. Sens. Stud. 2009, 24, 243–257.
  2. Fontoin, H.; Saucier, C.; Teissedre, P.L.; Glories, Y. Effect of pH, ethanol and acidity on astringency and bitterness of grape seed tannin oligomers in model wine solution. Food Qual. Preference 2008, 19, 286–291.
  3. Meillon, S.; Urbano, C.; Schlich, P. Contribution of the temporal dominance of sensations (TDS) method to the sensory description of subtle differences in partially dealcoholized red wines. Food Qual. Preference 2009, 20, 490–499.
  4. Pickering, G.J.; Heatherbell, D.A.; Vanhanen, L.P.; Barnes, M.F. The effect of ethanol concentration on the temporal perception of viscosity and density in white wine. Am. J. Enol. Vitic. 1998, 49, 306–318.
  5. Fischer, U.; Noble, A.C. The effect of ethanol, catechin concentration, and pH on sourness and bitterness of wine. Am. J. Enol. Vitic. 1994, 45, 6–10.
  6. Jones, G.V.; White, M.A.; Cooper, O.R.; Storchmann, K. Climate change and global wine quality. Clim. Chang. 2005, 73, 319–343.
  7. Koufos, G.; Mavromatis, T.; Koundouras, S.; Fyllasd, N.M.; Jones, G.V. Viticulture-climate relationships in Greece: The impacts of recent climate trends on harvest date variation. Int. J. Climatol. 2013, 34, 1445–1459.
  8. Labanda, J.; Vichi, S.; Llorens, J.; López-Tamames, E. Membrane separation technology for the reduction of alcoholic degree of a white model wine. LWT Food Sci. Technol. 2009, 42, 1390–1395.
  9. Masson, J.; Aurier, P.; D’hauteville, F. Effects of non-sensory cues on perceived quality: The case of low-alcohol wine. Int. J. Wine Bus. Res. 2008, 20, 215–229.
  10. Saliba, A.J.; Ovington, L.A.; Moran, C.C. Consumer demand for low-alcohol wine in an Australian sample. Int. J. Wine Res. 2013, 5, 1–8.
  11. Szczesniak, A.S. Classification of mouthfeel characteristics of beverages. In Food Rheology and Texture; Sherman, P., Ed.; Academic Press: London, UK, 1979; pp. 1–20.
  12. Szczesniak, A.S. Psychorheology and texture as factors controlling the consumer acceptance of food. Cereal Foods World 1990, 35, 1201–1205.
  13. Noble, A.C.; Arnold, R.A.; Buechsenstein, J.; Leach, E.J.; Schmidt, J.O.; Stern, P.M. Modification of a standardized system of wine aroma terminology. Am. J. Enol. Vitic. 1987, 38, 143–146.
  14. Smith, A.K.; June, H.; Noble, A.C. Effects of viscosity on the bitterness and astringency of grape seed tannin. Food Qual. Preference 1996, 7, 161–166.
  15. Hollowood, T.A.; Linforth, R.S.T.; Taylor, A.J. The effect of viscosity on the perception of flavour. Chem. Senses 2002, 27, 583–589.
  16. Yanniotis, S.; Kotseridis, G.; Orfanidou, A.; Petraki, A. Effect of ethanol, dry extract and glycerol on the viscosity of wine. J. Food Eng. 2007, 81, 399–403.
  17. Da Porto, C.; Cordaro, F.; Marcassa, N. Effects of carbohydrate and noncarbohydrate sweeteners on the orange spirit volatile compounds. Food Sci. Technol. 2006, 39, 159–165.
  18. Walker, S.; Prescott, J. The influence of solution viscosity and different viscosifying agents of apple juice flavour. J. Sens. Stud. 2000, 15, 285–307.
  19. Dalton, P.; Doolittle, N.; Nagata, H.; Breslin, P.A.S. The merging of the senses: Integration of subthreshold taste and smell. Nat. Neurosci. 2000, 3, 431–432.
  20. Cichero, J.A.Y.; Jackson, O.J.; Halley, P.J.; Murdoch, B.E. How thick is thick? Multicenter study of the rheological and material property characteristics of meal time fluids and videofluoroscopy fluids. Dysphagia 2000, 15, 188–200.
  21. Pankiewicz, U.; Jamroz, J. Evaluation of Physicochemical and Sensory Properties of Ethanol Blended with Pear Nectar. Czech J. Food Sci. 2013, 31, 66–71.
  22. Carroll, D.E.; Hoover, M.W.; Nesbitt, W.B. Sugar and organic acid concentrations in cultivars of muscadine grapes. J. Am. Soc. Hortic. Sci. 1971, 96, 737–740.
  23. Shiraishi, M. Three descriptors for sugars to evaluate grape germplasm. Euphytica 1993, 71, 99–106.
  24. Dai, Z.W.; Ollat, N.; Gomès, E.; Decroocq, S.; Tandonnet, J.-P.; Bordenave, L.; Pieri, P.; Hilbert, G.; Kappel, C.; van Leeuwen, C.; et al. Ecophysiological, genetic, and molecular causes of variation in grape berry weight and composition: A review. Am. J. Enol. Vitic. 2011, 62, 413–425.
  25. Shiraishi, M.; Fujishima, H.; Chijiwa, H. Evaluation of table grape genetic resources for sugar, organic acid, and amino acid composition of berries. Euphytica 2010, 174, 1–13.
  26. Liu, H.F.; Wu, B.H.; Fan, P.G.; Li, S.H.; Li, L.S. Sugar and acid concentrations in 98 grape cultivars analyzed by principal component analysis. J. Sci. Food Agric. 2006, 86, 1526–1536.
  27. Conde, B.C.; Silva, P.; Fontes, N.; Dias, A.C.P.; Tavares, R.M.; Sousa, M.J.; Agasse, A.; Delrot, S.; Geros, H. Biochemical changes throughout grape berry development and fruit and wine quality. Food 2007, 1, 1–22.
  28. Boss, P.K.; Davies, C. Molecular biology of sugar and anthocyanin accumulation in grape berries. In Molecular Biology and Biotechnology of the Grapevine; Roubelakis-Angelakis, K.A, Ed.; Kluwer Academic Publishers: Dordrecht, The Netherlands, 2001; pp. 1–33.
  29. Williams, L.E.; Lemoine, R.; Sauer, N. Sugar transporters in higher plants—A diversity of roles and complex regulation. Trends Plant Sci. 2000, 5, 283–290.
  30. Robinson, S.P.; Davies, C. Molecular biology of grape berry ripening. Aust. J. Grape Wine Res. 2000, 6, 175–188.
  31. Coombe, B.G. Research on Development and Ripening of the Grape Berry. Am. J. Enol. Vitic. 1992, 43, 101–110.
  32. Fillion, L.; Ageorges, A.; Picaud, S.; Coutos-Thevenot, P.; Lemoine, R.; Romieu, C.; Delrot, S. Cloning and expression of a hexose transporter gene expressed during the ripening of grape berry. Plant Physiol. 1999, 120, 1083–1093.
  33. Hawker, J.S. Changes in the activities of enzymes concerned with sugar metabolism during the development of grape berries. Phytochemistry 1969, 8, 9–17.
  34. Kühn, C.; Franceschi, V.R.; Schulz, A.; Lemoine, R.; Frommer, W.B. Macromolecular trafficking indicated by localization and turnover of sucrose transporters in enucleate sieve elements. Science 1997, 275, 1298–1300.
  35. Delrot, S.; Atanassova, R.; Maurousset, L. Regulation of sugar, amino acid and peptide plant membrane transporters. Biochim. Biophys. Acta 2000, 1465, 281–306.
  36. Octave, S.; Emborabé, B.E.; Fleurat-Lessard, P.; Bergès, T.; Roblin, G. Modifications of plant cell activities by polypeptides secreted by Eutypa lata, a vineyard fungal pathogen. Physiol. Plant. 2006, 128, 103–115.
  37. Esteban, M.A.; Villanueva, M.J.; Lissarrague, J.R. Relalationships between different berry components in Tempranillo (Vitis vinifera L.) grapes from irrigated and non-irrigated vines during ripening. J. Sci. Food Agric. 2002, 82, 1136–1146.
  38. Jordão, A.M.; Ricardo-da-Silva, J.M.; Laureano, O. Influência da rega na composição fenólica das uvas tintas da casta Touriga Francesa (Vitis vinifera L.). Cienc. Tecnol. Aliment. 1998, 2, 60–73.
  39. Esteban, M.A.; Villanueva, M.J.; Lissarrague, J.R. Effect of Irrigation on Changes in Berry Composition of Tempranillo during Maturation. Sugars, Organic Acids, and Mineral Elements. Am. J. Enol. Vitic. 1999, 50, 418–434.
  40. Orts, M.L.; Martínez-Cutillas, A.; López-Roca, J.M.; Gómez-Plaza, E. Effect of moderate irrigation on grape composition during ripening. J. Agric. Res. 2005, 3, 352–361.
  41. Intrigliolo, D.S.; Castel, J.R. Effects of Irrigation on the Performance of Grapevine cv. Tempranillo in Requena. Am. J. Enol. Vitic. 2008, 59, 30–38.
  42. Van Leeuwen, C.; Tregoat, O.; Choné, X.; Bois, B.; Pernet, D.; Gaudillère, J.-P. Vine water status is a key factor in grape ripening and vintage quality for red bordeaux wine. How can it be assessed for vineyard management purposes? J. Int. Sci. Vigne Vin. 2009, 43, 121–134.
  43. Hawker, J.S. Effect of temperature on lipid, starch and enzymes of starch metabolism in grape, tomato and broad bean-leaves. Phytochemistry 1982, 21, 33–36.
  44. De Orduña, R. Climate change associated effects on grape and wine quality and production. Food Res. Int. 2010, 43, 1844–1855.
  45. Huglin, P.; Schneider, C. Biologie et Ecologie de la Vigne; Tec & Doc Lavoisier: Commune, France, 1998.
  46. Kriedemann, P.; Smart, R. Effect of irradiance, temperature and leaf water potential on photosynthesis of vine leaves. Photosynthetica 1971, 5, 6–15.
  47. Coombe, B. Influence of temperature on composition and quality of grapes. In ISHS Acta Horticulturae, Proceedings of the International Symposium on Grapevine Canopy and Vigor Management, Davis, CA, USA, 14 August 1986; Volume XXII IHC, pp. 23–35.
  48. Keller, M. Managing grapevines to optimise fruit development in a challenging environment: A climate change primer for viticulturists. Aust. J. Grape Wine Res. 2009, 16, 56–69.
  49. Keller, M. The Science of Grapevines: Anatomy and Physiology; Academic Press: New York, NY, USA, 2010.
  50. García-Martín, N.; Perez-Magariño, S.; Ortega-Heras, M.; González-Huerta, C.; Mihnea, M.; González-Sanjosé, M.L.; Palacio, L.; Prádanos, P.; Hernández, A. Sugar reduction in musts with nanofiltration membranes to obtain low alcohol-content wines. Sep. Purif. Technol. 2010, 76, 158–170.
  51. Castellarin, S.; Matthews, M.; Gaspero, G.; Gambetta, G. Water deficits accelerate ripening and induce changes in gene expression regulating flavonoid biosynthesis in grape berries. Planta 2007, 227, 101–112.
  52. Berli, F.J.; Moreno, D.; Piccoli, P.; Hespanhol-Viana, L.; Silva, M.F.; Bressan-Smith, R.; Cavagnaro, J.B.; Bottini, R. Abscisic acid is involved in the response of grape (Vitis vinifera L.) cv. Malbec leaf tissues to ultraviolet-B radiation by enhancing ultraviolet-absorbing compounds, antioxidant enzymes and membrane sterols. Plant Cell Environ. 2010, 33, 1–10.
  53. Duchêne, E.; Schneider, C. Grapevine and climatic changes: A glance at the situation in Alsace. Agron. Sustain. Dev. 2005, 24, 93–99.
  54. Godden, P.; Gishen, M. Trends in the composition of Australian wine. Aust. N. Z. Wine Ind. J. 2005, 20, 21–46.
  55. Glanz, K.; Basil, M.; Maibach, E.; Goldberg, J.; Snyder, D. Why Americans eat what they do: Taste, nutrition, cost, convenience, and weight control concerns as influences on food consumption. J. Am. Diet. Assoc. 1998, 98, 1118–1126.
  56. Moore, M.; Weiss, S. Reasons for non-drinking among Israeli adolescents of four religions. Drug Alcohol Depend. 1995, 38, 45–50.
  57. Higgs, S.; Stafford, L.D.; Attwood, A.S.; Walker, S.C.; Terry, P. Cues that signal the alcohol content of a beverage and their effectiveness at altering drinking rates in young social drinkers. Alcohol Alcohol. 2008, 43, 630–635.
  58. Lanier, S.A.; Hayes, J.E.; Duffy, V.B. Sweet and bitter tastes of alcoholic beverages mediate alcohol intake in of-age undergraduates. Physiol. Behav. 2005, 83, 821–831.
  59. Bartoshuk, L.M.; Conner, E.; Grubin, D.; Karrer, T.; Kochenbach, K.; Palsco, M.; Snow, D.; Pelchat, M.; Danovski, S. PROP supertasters and the perception of ethyl alcohol. Chem. Senses 1993, 18, 526–527.
  60. Mattes, R.D.; DiMeglio, D. Ethanol perception and ingestion. Physiol. Behav. 2001, 72, 217–229.
  61. Wooding, S.; Kim, U.K.; Bamshad, M.J.; Larsen, J.; Jorde, L.B.; Drayna, D. Natural Selection and Molecular Evolution in PTC, a Bitter-Taste Receptor Gene. Am. J. Hum. Genet. 2004, 74, 637–646.
  62. Drayna, D.; Coon, H.; Kim, U.K.; Elsner, T.; Cromer, K.; Otterud, B.; Baird, L.; Peiffer, A.P.; Leppert, M. Genetic analysis of a complex trait in the Utah Genetic Reference Project: A major locus for PTC taste ability on chromosome 7q and a secondary locus on chromosome 16p. Hum. Genet. 2003, 112, 567–572.
  63. Kim, U.K.; Jorgenson, E.; Coon, H.; Leppert, M.; Risch, N.; Drayna, D. Positional cloning of the human quantitative trait locus underlying taste sensitivity to phenylthiocarbamide. Science 2003, 299, 1221–1225.
  64. Duffy, V.B.; Davidson, A.C.; Kidd, J.R.; Kidd, K.K.; Speed, W.C.; Pakstis, A.J.; Reed, D.R.; Snyder, D.J.; Bartoshuk, L.M. Bitter receptor gene (TAS2R38), 6-n-propylthiouracil (PROP) bitterness and alcohol intake. Alcohol. Clin. Exp. Res. 2004, 28, 1629–1637.
  65. Dotson, C.D.; Wallace, M.R.; Bartoshuk, L.M.; Logan, H.L. Variation in the gene TAS2R13 is associated with differences in alcohol consumption in patients with head and neck cancer. Chem. Senses 2012, 37, 737–744.
  66. Tominaga, M.; Caterina, M.J.; Malmberg, A.B.; Rosen, T.A.; Gilbert, H.; Skinner, K.; Raumann, B.E.; Basbaum, A.I.; Julius, D. The cloned capsaicin receptor integrates multiple pain-producing stimuli. Neuron 1998, 21, 531–543.
  67. Caterina, M.J.; Rosen, T.A.; Tominaga, M.; Brake, A.J.; Julius, D. A capsaicin-receptor homologue with a high threshold for noxious heat. Nature 1999, 398, 436–441.
  68. Trevisani, M.; Smart, D.; Gunthorpe, M.J.; Tognetto, M.; Barbieri, M.; Campi, B.; Amadesi, S.; Gray, J.; Jerman, J.C.; Brough, S.J.; et al. Ethanol elicits and potentiates nociceptor responses via the vanilloid receptor-1. Nat. Neurosci. 2002, 5, 546–551.
  69. Blednov, Y.; Harris, R. Deletion of vanilloid receptor (TRPV1) in mice alters behavioral effects of ethanol. Neuropharmacology 2009, 56, 814–820.
  70. Ferraro, F.M.; Hill, K.G.; Kaczmarek, H.J.; Coonfield, D.L.; Kiefer, S.W. Naltrexone modifies the palatability of basic tastes and alcohol in outbred male rats. Alcohol 2002, 27, 107–114.
  71. Mennella, J.A. The transfer of alcohol to human milk: Sensory implications and effects on mother-infant interaction. In Alcohol and Alcoholism: Brain and Development; Spear, N.E., Spear, L.P., Hanningan, J.H., Goodlett, C.R., Eds.; Erlbaum: Hillsdale, NJ, USA, 1999; pp. 177–198.
  72. Molina, J.C.; Domínguez, H.D.; López, M.F.; Pepino, M.Y.; Faas, A.E. The role of fetal and infantile experience with alcohol in later recognition and acceptance patterns of the drug. In Alcohol and Alcoholism: Brain and Development; Spear, N.E., Spear, L.P., Hanningan, J.H., Goodlett, C.R., Eds.; Erlbaum: Hillsdale, NJ, USA, 1999; pp. 199–228.
  73. Buck, L.; Axel, R. A novel multigene family may encode odourant receptors: A molecular basis for odour recognition. Cell 1991, 65, 175–187.
  74. Menco, B.P.; Morrison, E.E. Morphology of the mammalian olfactory epithelium: Form, fine structure, function, and pathology. In Handbook of Olfaction and Gustation; Doty, R., Ed.; Marcel Dekker: New York, NY, USA, 2003; pp. 17–49.
  75. Caterina, M.J.; Schumacher, M.A.; Tominaga, M.; Rosen, T.A.; Levine, J.D.; Julius, D. The capsaicin receptor: A heat-activated ion channel in the pain pathway. Nature 1997, 389, 816–824.
  76. Li, X.; Staszewski, L.; Xu, H.; Durick, K.; Zoller, M.; Adler, E. Human receptors for sweet and umami taste. Proc. Natl. Acad. Sci. USA 2002, 99, 4692–4696.
  77. Nelson, G.; Hoon, M.A.; Chandrashekar, J.; Zhang, Y.; Ryba, N.J.; Zuker, C.S. Mammalian sweet taste receptors. Cell 2001, 106, 381–390.
  78. Nelson, G.; Chandrashekar, J.; Hoon, M.A.; Feng, L.; Zhao, G.; Ryba, N.J.; Zuker, C.S. An amino-acid taste receptor. Nature 2002, 416, 199–202.
  79. Margolskee, R.F. Molecular mechanisms of taste transduction. Pure Appl. Chem. 2002, 74, 1125–1133.
  80. Gawel, R.; van sluyter, S.; Waters, E.J. The effects of ethanol and glycerol on the body and other sensory characteristics of Riesling wines. Aust. J. Grape Wine Res. 2007, 13, 38–45.
  81. Gawel, R. The use of language by trained and untrained experienced wine tasters. J. Sens. Stud. 1997, 12, 267–284.
  82. Amerine, M.A.; Roessler, E.B. Wines: Their Sensory Evaluation; Freeman, W.H., Ed.; W. H. Freeman & Co.: San Francisco, CA, USA, 1983.
  83. Nurgel, C.; Pickering, G. Contribution of glycerol, ethanol and sugar to the perception of viscosity and density elicited by model white wines. J. Texture Stud. 2005, 36, 303–325.
  84. Guth, H.; Sies, A. Flavour of wines: Towards an understanding by reconstitution experiments and an analysis of ethanol’s effect on odour activity of key components. In Proceedings of the Eleventh Australian Wine Industry Technical Conference, Adelaide, Australia, 7–11 October 2001; Australian Wine Industry Technical Conference Inc.: Adelaide, Australia, 2002; pp. 128–139.
  85. Scinska, A.; Koros, E.; Habrat, B.; Kukwa, A.; Kostowski, W.; Bienkowski, P. Bitter and sweet components of ethanol taste in humans. Drug Alcohol Depend. 2000, 60, 199–206.
  86. Joshi, V.K.; Sandhu, D.K. Influence of Ethanol Concentration, Addition of Spices Extract, and Level of Sweetness on Physico-chemical Characteristics and Sensory Quality of Apple Vermouth. Braz. Arch. Biol. Technol. 2000, 43, 537–545.
  87. Noble, A.C. Why Do Wines Taste Bitter and Feel Astringent? In Chemistry of Wine Flavour; Waterhouse, A.L., Ebeler, S.E., Eds.; American Chemical Society: Washington, DC, USA, 1998; pp. 156–165.
More
Information
Contributors MDPI registered users' name will be linked to their SciProfiles pages. To register with us, please refer to https://encyclopedia.pub/register : , ,
View Times: 369
Revisions: 2 times (View History)
Update Date: 13 Sep 2023
1000/1000
ScholarVision Creations