Your browser does not fully support modern features. Please upgrade for a smoother experience.
Submitted Successfully!
 +1 credit
Thank you for your contribution! You can also upload a video entry or images related to this topic.
For video creation, please contact our Academic Video Service.
| Version | Summary | Created by | Modification | Content Size | Created at | Operation |
|---|---|---|---|---|---|---|
| 1 | Muhammad Mohsin Yousufi | -- | 3681 | 2023-09-11 12:18:19 | | | |
| 2 | Catherine Yang | + 1 word(s) | 3682 | 2023-09-12 03:09:29 | | |
Video Upload Options
We provide professional Academic Video Service to translate complex research into visually appealing presentations. Would you like to try it?
Cite
If you have any further questions, please contact Encyclopedia Editorial Office.
Yousufi, M.M.; Dzulkarnain, I.B.; Elhaj, M.E.M.; Ahmed, S. Pickering Emulsion Characteristics and Measuring Techniques. Encyclopedia. Available online: https://encyclopedia.pub/entry/49022 (accessed on 21 July 2026).
Yousufi MM, Dzulkarnain IB, Elhaj MEM, Ahmed S. Pickering Emulsion Characteristics and Measuring Techniques. Encyclopedia. Available at: https://encyclopedia.pub/entry/49022. Accessed July 21, 2026.
Yousufi, Muhammad Mohsin, Iskandar Bin Dzulkarnain, Mysara Eissa Mohyaldinn Elhaj, Shehzad Ahmed. "Pickering Emulsion Characteristics and Measuring Techniques" Encyclopedia, https://encyclopedia.pub/entry/49022 (accessed July 21, 2026).
Yousufi, M.M., Dzulkarnain, I.B., Elhaj, M.E.M., & Ahmed, S. (2023, September 11). Pickering Emulsion Characteristics and Measuring Techniques. In Encyclopedia. https://encyclopedia.pub/entry/49022
Yousufi, Muhammad Mohsin, et al. "Pickering Emulsion Characteristics and Measuring Techniques." Encyclopedia. Web. 11 September, 2023.
Copy Citation
Surfactant-based emulsions require high emulsifier concentrations for stability and often rely on multiple additives to address various factors, which makes the surfactant synthesis and utilization of emulsions quite challenging. Pickering emulsions, which utilize solid particles for emulsion stabilization, have emerged as a promising solution for reservoir conformance control.
Pickering emulsion
conformance control
emulsion
1. Stability
A vital characteristic is that if an emulsion is not able to resist the physiochemical changes in its surroundings for a given period, the conformance operation cannot be successfully conducted up to the targeted zone. To ensure the formation of a stable emulsion, the following parameters are to be evaluated. Some of these parameters are direct measurements of stability for a given temperature and time, along with variations in salinity and pH.
- i.
-
Bottle Test:
It is a very conventional and simple visual observation testing method based on gravity segregation/separation [1]. It helps in determining stability by scrutinizing the separation of emulsion for creaming or sedimentation with respect to time at different temperature and salinity conditions [2][3]. The extent of separation can be measured by noting down the thickness of the separating layer [4].
- ii.
-
Emulsion Stability Index (ESI):
It is the measure of the emulsion’s resistance against instability (coalescence and flocculation) over a specific period [5]. It is calculated to predict long-term stability. This is carried out by applying the volumetric method using the data related to volume separation obtained from the bottle test [3][6].
 where Vo = volume of oil separated from the emulsion and Ve = volume of the emulsion.
- iii.
-
Imaging/Microscopy:
Microscopy helps in observing the dispersed droplets having a size smaller than 100 micrometers [7]. Droplet distribution and morphology (dimension and shape) play a pivotal role in identifying emulsion instability. Instability mechanisms such as flocculation, coalescence, and Ostwald ripening are all based upon the distribution and size of the droplets, and microscopic imaging techniques such as scanning electron microscopy (SEM) can help in detecting these processes and improving stability by preventing their occurrence further during emulsion design/synthesis phase [4]. Combining microscopic imaging with a more precise technique, namely droplet size distribution (DSD), further strengthens surety regarding the stability of the emulsion. Electron microscopes such as field emission electron microscopes and transmission electron microscopes are the best choice for this purpose. The reason is due to its high resolution and ability to capture large surface area images quickly. Comparatively, the high resolution is most suitable for analyzing individual droplet shape, size, and morphology, as well as the distribution of droplets throughout the emulsion and at the interface [8][9].
- iv.
-
Droplet Size Distribution (DSD):
An emulsion is targeted to possess homogeneous distribution of small-sized droplets with low variation so that the emulsion acts as a one-phase fluid system for a desired time. The heterogeneity in droplet size and level of dispersion indicates to which degree emulsion instability factors, such as creaming, flocculation, coalescence, etc., are likely to occur. For this purpose, droplet size and its distribution at different regions of the emulsion need to be evaluated. This allows for spotting the instability mechanisms which may be hindering the stability performance of the system. Emulsion stability is susceptible to salinity and temperature; therefore, during the design stage, emulsion needs to be tested for resistance against specific temperature and salinity ranges, which would be present in the subsurface. Generally, droplet size and distribution can be measured by the following techniques. As presented in Figure 1, most droplet size attained in published studies resides within the range of 1–4 microns; however, droplet size varies from reservoir to reservoir and depends upon the pore throat size, which also has heterogeneity in the formation, so variation in droplet size of emulsion helps in plugging pore throat of different size in a formation [10]. The droplet size is governed by the Pickering particle size, the viscosity and charge of the phases, the mode of dispersion, mixing speed, and temperature during synthesis as well as the reservoir conditions such as salinity, pH, and temperature.
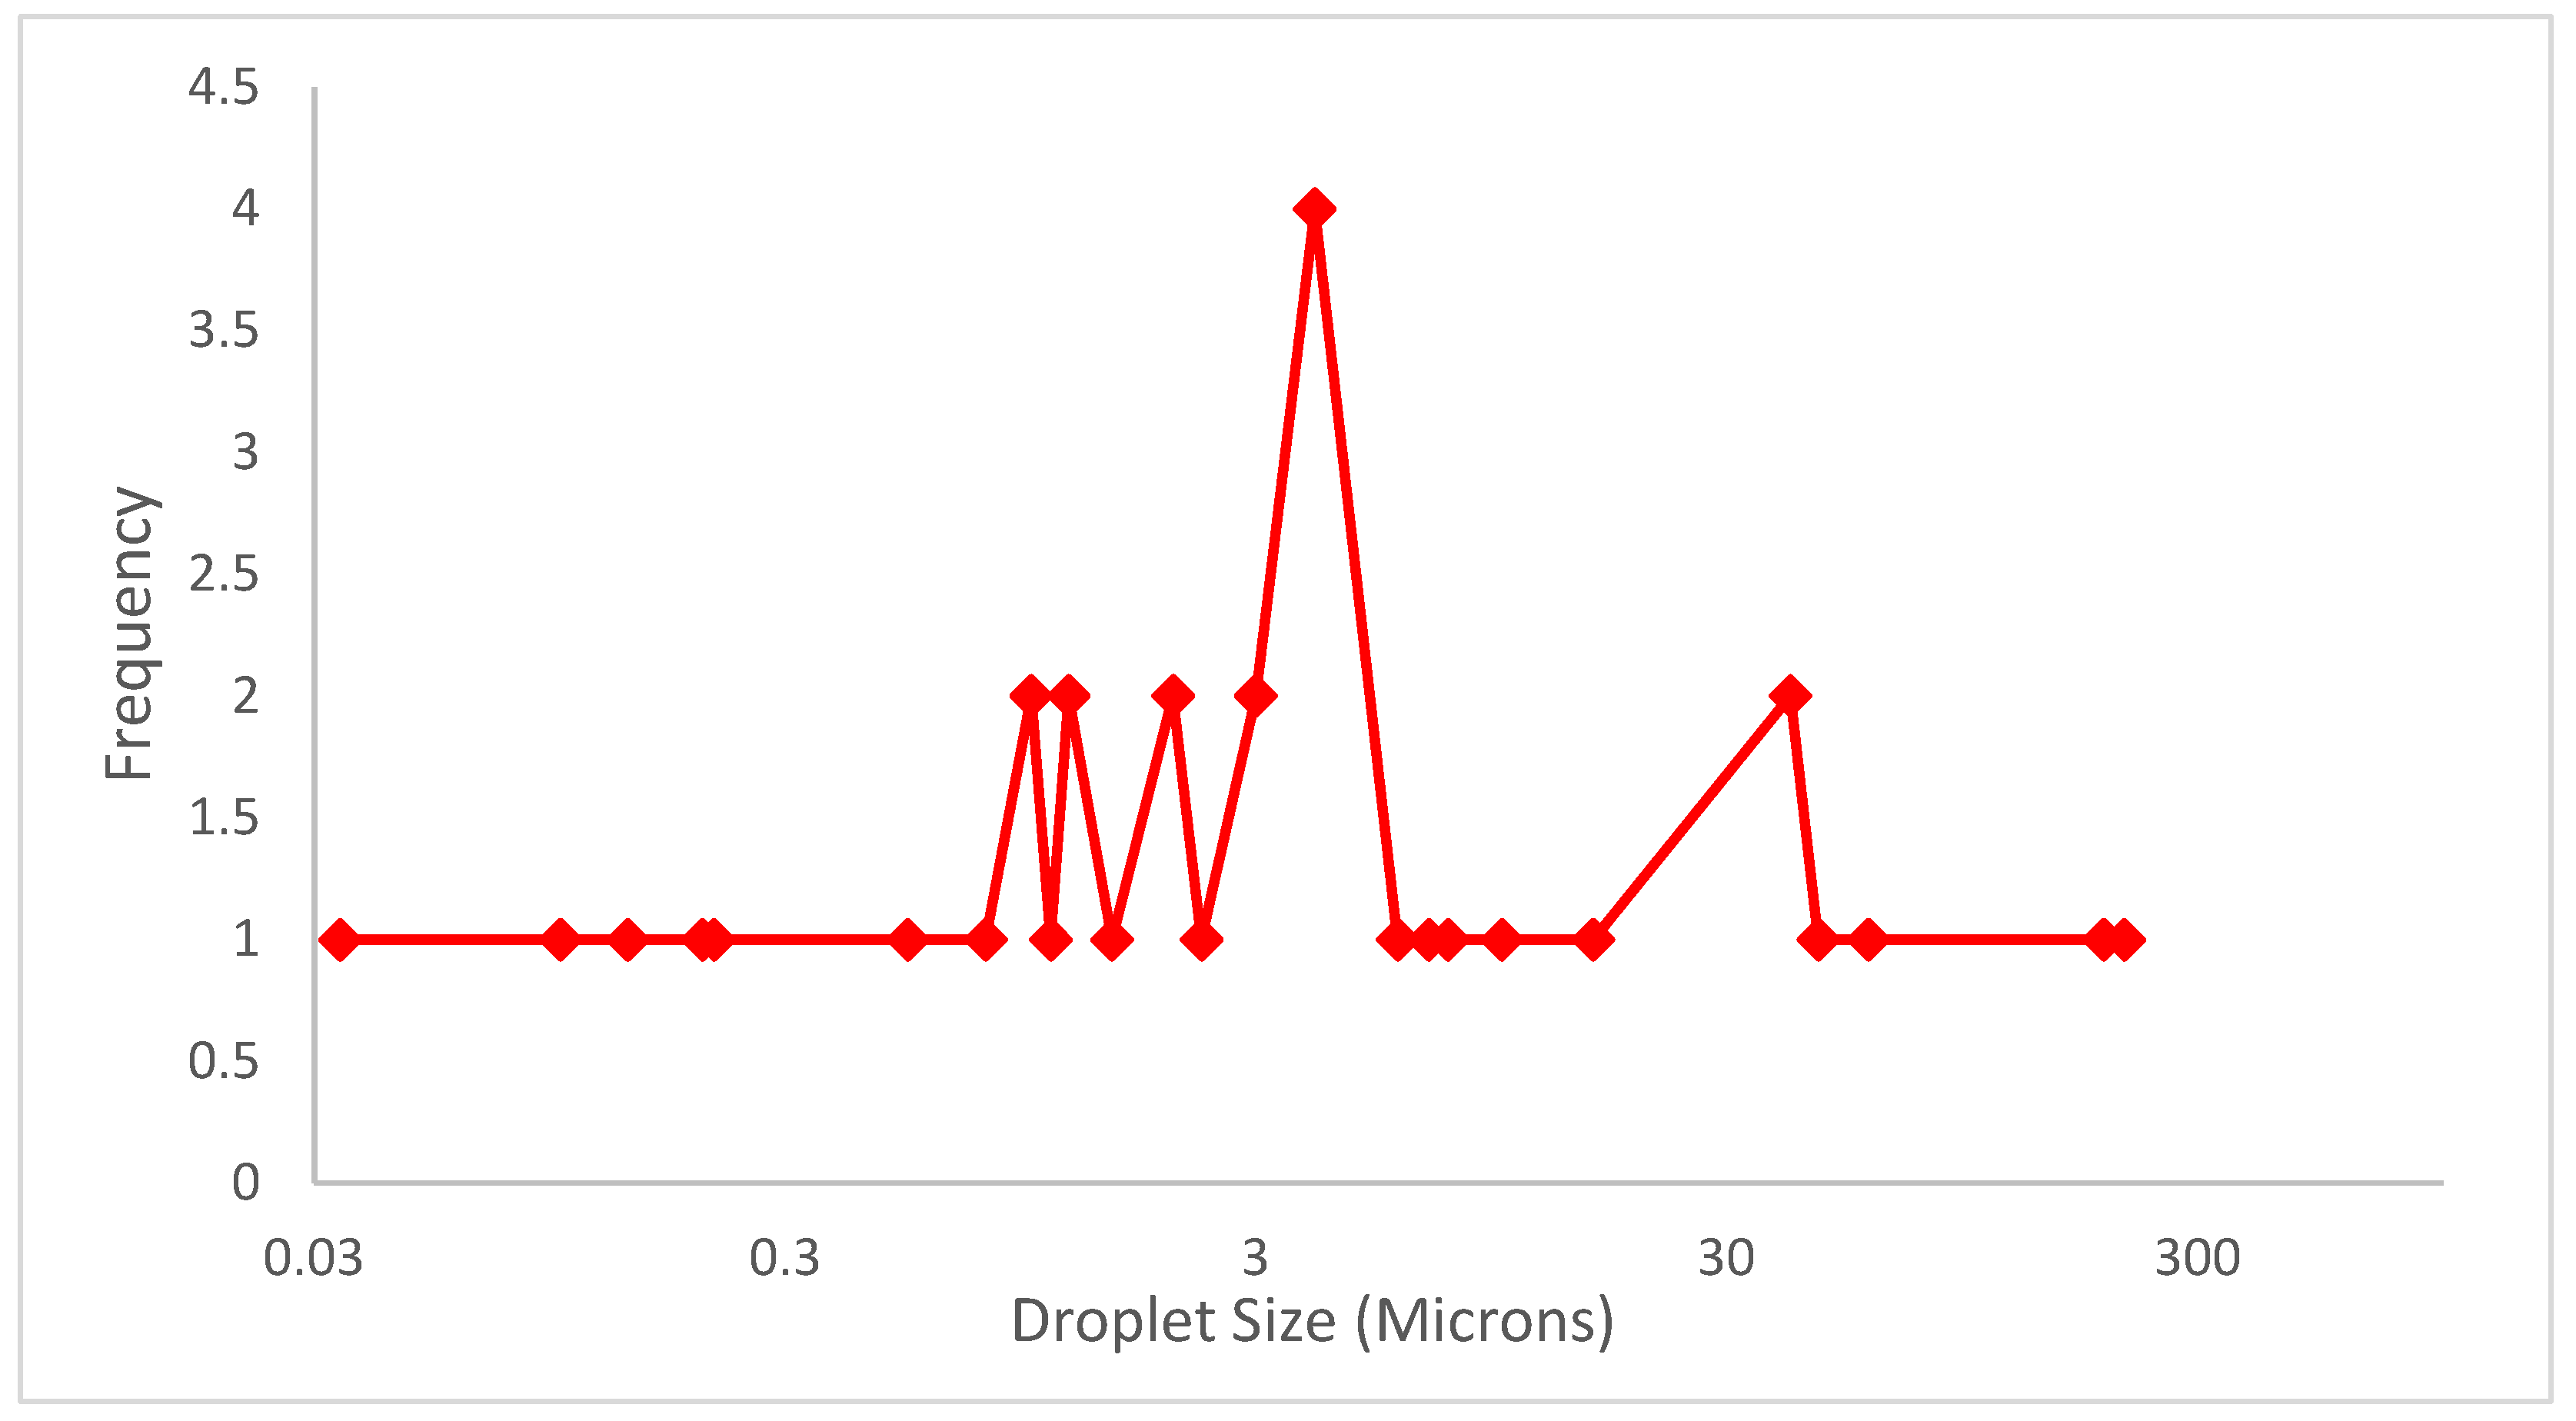
Figure 1. From 33 previous studies, the droplet size range resides between 1 micron and 4 microns, varying for each reservoir; the droplet size depends upon the Pickering particle size, viscosity and polarity of the phases, method of synthesis, and reservoir conditions (salinity and temperature).
Light Scattering Method: It utilizes a monochromatic beam of near-infrared light that travels through the emulsion sample. It provides the concentration and size of the droplets via the detection of the percentage and angle of backscattered light [11]. Higher concentration is indicated by the large percentage of backscattered light, while lower concentration by a low percentage. Meanwhile, the size of the particle is determined via its angular scattering and the intensity with which it scatters. Large particles scatter intensely at narrow angles, whereas small particles scatter intensely at wider angles. It is important to know that microscopic image analyses give number-based distribution, whereas particle size analysis techniques provide volume-based distribution. Although number-based distribution can be converted to volume-based, the accuracy of the particle size analyses provided is far more acceptable due to being measured directly [12]. In cases where it is necessary to provide a single point specification to represent droplet size distribution, then the median value should be presented as it is the most stable value generated by laser diffraction. The width of the distribution represents particles/droplets of a specific size range residing within a certain percentile in the emulsion system; this can be calculated by using following Equation . Especially in conformance control, it is important to know droplet size heterogeneity as it helps in plugging multiple pore throats of diverse sizes [10].
 where Span represents the width of distribution, D10, D50, and D90 represent the distribution percentile of different particle sizes in the emulsion. If the span is not applicable, then two-point distribution should be represented, describing the coarsest and finest parts of the distribution (i.e., D90 and D10) [12]. The light scattering technique (static/dynamic) can mostly measure sizes in the range of 0.3 nm to 5000 µm [13].
Ultrasonic Spectrometry: It is a noninvasive technique that measures attenuation level in the frequency of ultrasonic velocity through which it calculates particle size distribution and concentration. This is because of variance experienced in the ultrasonic spectrum as waves travel through an emulsion, the velocity reduces, and the attenuation increases upon contact with the dispersed phase of the emulsion. Unlike the light scattering technique, which requires dilution of samples, causing a certain amount of compromise in accuracy, the acoustic-based allows for high particle concentration measurements due to the measuring mechanism relying on acoustics; it can measure even opaque samples. Generally, ultrasonic spectrometers can measure droplet size ranging from 5 nm to 1000 µm.
- v.
-
Zeta potential:
It is a property present in every droplet/particle dispersed in a colloid system. It helps in determining and optimizing the long-term stability of an emulsion without multiple trial formulations. The droplet inside a continuous phase experiences attractive and repulsive forces that are responsible for stabilizing an emulsion system or leading it toward flocculation and other instability mechanisms. The droplet is mainly influenced because of the emulsifier adhered to the droplet at the interface. This is explained in much more detail by the DVLO theory [14].
The droplets usually repel one another due to the dominance of the repulsive forces courtesy of the steric barrier created by the emulsifier; in the case of a Pickering emulsion, this keeps the emulsion stable. As discussed above, in the mechanical barrier mechanism, the particles are settled in between the oil–water interface with such high interfacial energy that to undo it would require a very high amount of thermal energy (like by increasing the temperature). If such an amount of thermal energy is provided, only then the attractive forces will be able to adhere to the particles and cause destabilization of the colloid (in this case, emulsion) via flocculation and coagulation. Apart from thermal energy increment to significant levels, other factors can lead towards adherence of particles. For instance, an increase in salinity in the surrounding can cause attractive forces to increase; in certain cases, the salt ion hydration phenomenon can occur, causing droplets to adhere towards the salts, thus reducing the electrostatic repulsion effect provided by the emulsifier to reduce (lose its dominance). Hence, if the attractive forces are moderate droplets, these overcome the slight repulsion in between them and start forming larger droplets leading towards coalescence. An ideal zeta potential value for a macroemulsion is around ±30 mV indicating a stable system. But the zeta potential value can be lower, and an emulsion can still show resilient stability due to other factors such as the viscosity of the continuous phase, the interfacial tension between the phases, the presence of additional emulsifying agents, which can increase steric barrier and prevent coagulation [15][16][17].
Electrophoretic mobility and electroacoustic spectroscopy are the techniques that can be used for this purpose. Electrophoretic mobility is the movement of charged particles in an electric field. An electric field is applied to the dispersion and measures the velocity at which the particles move. The zeta potential can then be calculated from the measured velocity and the size of the particles. In comparison, electroacoustic spectroscopy measures zeta potential by introducing an ultrasound pulse to the dispersion, which causes movement in the droplets, thus creating an electric alternating current. This current is measured as a potential between two electrodes. The zeta potential is calculated from this measured potential. Electroacoustic spectroscopy does not require the emulsion sample to be diluted and can measure the zeta potential of (50%) concentrated samples [4].
2. Rheology
Emulsion flow properties are primarily associated with viscosity. It is a prominent characteristic when colloid stability is monitored as it reduces instability from occurring due to moderate fluidity and near homogeneous droplet dispersion in the system. Rheology is also important when considering the mobility/viscosity ratio of the emulsion system, which affects the mixing efficiency and differs in power requirement and pumping rate for pumping emulsion as per depth conditions of the well and specific applications (flooding, acidizing, fracturing, diverting/spacing, etc.). The shear resistance and flow behavior (shear thinning and thickening) are determined by using a rotational rheometer for an emulsion to be used for conformance control [4][18]. The plate geometry to be utilized depends upon the viscosity and stability of the emulsion. This is to account for the slipping behavior and evaporation tendency of an emulsion at high temperature and pressure conditions, which prevent accurate rheological characterization of an emulsion. For instance, a highly viscous sample can be measured with a parallel plate; however, for a low viscous fluid, a concentric cylinder is preferred. This is because, in a parallel plate, the wide surface area allows for higher chances of evaporation and slipping, whereas the concentric cylinder mitigates evaporation and slipping behavior by keeping the fluid at a raised level and within the confines of the cylinder. Moreover, it is recommended to have a large number of data points with a minimum spacing in between to capture the mechanical behavior of the emulsion accurately.
3. Wettability
It has significance on account of two factors: (i) phase behavior and (ii) stability of a Pickering emulsion. Contrary to surfactant-based emulsions where the emulsion phase behavior depends upon the hydrophilic-lipophilic balance of surfactant, in Pickering emulsions, wettability governs the phase behavior, whichever phase (oil or aqueous) wets the surface of the Pickering particle is the continuous phase; this is determined by measuring the contact angle. A contact angle close to 90° is preferred for a stable emulsion as it indicates partial wetting towards both phases and requires minimum energy for maintaining stability. To measure contact angle and interfacial tension, generally optical and force tensiometers are used.
Optical tensiometers comprise a syringe-like dispenser, a sample stage, and a light source for highlighting the emulsion droplet on the sample stage. Using the sessile drop method, which measures the contact angle as the droplet is dispensed/placed on the solid surface [19][20]. If the droplet spreads, the angle will be small, meaning it is hydrophilic in nature, whereas if the droplet forms a bead-like structure upon the solid surface, the angle will be large, highlighting lipophilic affinity [21]. Thus, depicting the emulsions phase behavior, whether which phase is continuous if as the mentioned angle is less than 90° hydrophilic nature is prominent meaning water is the continuous medium, whereas if greater than 90° then vice versa. If an angle close to 90° is achieved, then a stable emulsion is obtained having an affinity towards both phases with a strong interfacial bonding due to the minimum energy required to do so. The interfacial energy at this position, as mentioned in the mechanical steric barrier mechanism, is very high. This does not only tell the emulsion’s phase behavior but can also help in determining the hydrophilic/phobic nature of the solid rock surface as well as its surface free energy, which is measured by using the contact angle value. Therefore, it is best to also evaluate the interaction between the emulsion and rock surface using a solid etched layer of the core sample.
Moreover, this leads to the attainment of moderate interfacial tension, which provides an effective Jamin effect. Low interfacial tension cannot provide sufficient capillary pressure, while high interfacial tension will lead to emulsion instability and droplet breakup at the pore throat. Therefore, moderate interfacial tension must be attained so that the water phase gives enough capillary pressure to plug the oil droplet in the pore throat.
In certain cases, the interfacial tension measurements between the three phases need to be made on a very minute level. A spinning drop tensiometer can be utilized, which utilizes a modified form of pendant/rising drop method. The droplet is dispensed in a mixture of the Pickering agent, and the continuous phase is held in a capillary tube which is then rotated at specific speeds. Inside the tube, the centrifugal forces will push the continuous (denser) phase outwards while the droplet (less dense) is pushed inwards (towards the rotational axis). As a result, the droplet starts deforming while its interfacial area increases. The interfacial tension counteracts the area increase. This phenomenon helps in determining interfacial tension by analyzing the drop shape. This is measured when equilibrium is reached, and there is no change in the shape of the drop shape for a set time [15][22].
The force tensiometer comprises a probe (du Noüy ring or Wilhelmy plate) attached to a highly sensitive balance; the probe is displaced and pulled back from the sample at a controlled rate. It measures interfacial tension by measurement of the force exerted upon the probe at the liquid-liquid interface. The size, shape of the probe, the contact angle between the probe and liquid interface, and the interfacial tension at the liquid–liquid interface govern the force measurements. Generally, the Wilhelmy plate is preferred for highly viscous liquids, while du Noüy ring is considered for low viscous fluids [23].
4. Flow through Porous Medium
-
Microfluidic Study:
Micromodels are ideal for studying rock morphology and flow behavior at the pore scale, providing much more clarity on essential information than attained on a macroscale. Micromodels are also known as a lab-on-chip setup. It is comparatively less costly than core flooding experiments utilizing droplets of emulsion for experimentation while providing a significant amount of information. Usually, these models are made from materials such as glass, silicon, and polydimethylsiloxane (PDMS). However, geochemical processes such as adsorption behavior during flow cannot be observed with such materials, which is much needed to understand the blocking phenomenon in conformance control. Recently rock wafers, as well as rock coating onto PDMS, have been used for micromodels in order to evaluate reactive transport in porous media [24][25]. This method is most suitable for analyzing sweep efficiency and pore throat blocking capability of an emulsion at a minute scale. High-speed microscopic cameras are utilized with micromodels to capture static and dynamic parameters. This has allowed us to study properties such as emulsion stability in dynamic conditions (at steady state), which is considered much more feasible than static stability tests [26]. The type of plugging mechanism in place, along with the adsorption tendency of the droplet and emulsifier on to rock surface, are examined on a small scale at a low cost.
- ii.
-
Core Flooding:
The core flooding is the true performance evaluator of an emulsion at the laboratory scale to act as an effective conformance agent at reservoir conditions [27][28][29] before field deployment. The treatment helps in understanding fluid transport and blocking mechanism and rate of change in permeability before and after conformance agent injection. Optimized treatment design can be developed for varying reservoir conditions by testing the emulsion composition, phase concentration, and injection rates. This, in combination with a microfluidic study, can provide a better understanding of adsorption and flow behavior, droplet entrapment/plugging mechanism, and the effect on recovery efficiency. For conformance control, usually parallel core setup is carried out [10], or double-layered heterogeneous sandpack cores are used [28].
5. Basic Characterization
For conformance control, emulsion rheology should have a robust shear resistance (high elastic modulus/storage capacity/stability), moderate mobility, a viscosity that can provide good sweep efficiency (divergence), and effective plugging capability as per the specific formation’s physical properties (degree of heterogeneity in porosity and permeability, wettability) and implementation depth (if near the wellbore, deeper propagation is needed). To achieve a successful design of an emulsion with the above-mentioned conditions in mind, several factors which influence colloids phase and flow behavior need consideration, such as the viscosity and density, chemical composition, pH, total acid number, the electrical conductivity of both the phases with respect to which mainly the oil/water volume ratio is designated. The size, shape, and distribution dispersed phase (discussed above), as well as the shape, charge, and size of the Pickering particle, should be known prior for a better selection of chemicals and their respective concentrations during synthesis [30].
- i.
-
Density:
The density of the emulsion, as well as of the immiscible phases, must be known. The density of the aqueous and oleic phases is primarily important for determining the creaming velocity of an emulsion, as shown in Equation (3).
 where g is the acceleration due to gravity, r is the radius of the droplet, ρ1 and ρ2 are densities of the two immiscible phases, and η is the shear emulsion viscosity. This equation is based on Stoke’s Law, which mentions how the stability of an emulsion can be measured by observing the creaming velocity of the emulsion droplet, either rising or falling (i.e., creaming or sedimentation). The emulsions with high resistance to this phenomenon tend to possess good stability as this indicates a colloid system having a relatively homogeneous distribution of droplets dispersed evenly. Therefore, knowing the densities of each of the phases in the system allows us to design the colloid better, as the influence of characteristics of one phase can greatly impact colloid stability and performance. The concentration of the respective phases in the colloid can be changed accordingly to reduce these adverse effects as much as possible.
- ii.
-
Viscosity:
The viscosity of individual phases is a knowledge that helps in accessing the quantity of each phase as per the need of the application. For instance, the frictional resistance and overall viscosity of the emulsion increase as oil viscosity increases; however, if the dispersed oil volume fraction is in small amounts, then the viscosity of the emulsion is predominantly that of the aqueous [10][15]. Moreover, the highly viscous oil tends to provide better plugging performance which is also dependent upon the wettability and roughness of the rock surface as well as on the adsorption characteristic of the emulsion. Therefore, to attain effective sweep, plugging efficiency, and stability, the desirable mobility ratio will be based upon the respective phase viscosities as that governs the volume fraction of each of the fluids in the emulsion.
- iii.
-
Total acid number:
The total acid number (TAN) tends to increase the viscosity of a fluid, as the acidic content can cause them to become strongly bonded/associated, causing an enhancement in viscosity (resistance to flow). This tends to mostly be a favorable property, especially when highly viscous oil is preferred, as is in the case of conformance control (explained above in the viscosity section). This can also have adverse effects in terms of an increase in the corrosiveness of the fluid. Hydrocarbon-derived oil (such as petrol-based diesel) tends to, while possessing a high viscosity, have a low acid number due to the presence of rarely any olefinic content (<0.5 mg of KOH/g); this puts it at a technically feasible position due to being less corrosive [31]. Whereas triglyceride oils comparatively have a higher risk of inducing corrosion due to high levels of acid value (e.g., jatropha oil acid value = 32.8 mg of KOH/g), especially at high temperatures [32][33][34]. Therefore, the TAN of each fluid phase must be determined to foresee any harmful effects the fluid might produce later.
- iv.
-
pH:
Wettability (adsorption) and rheological behavior are highly influenced by the pH value of the emulsion and its respective individual phases. The interaction of emulsion with the mineralogy of the rock can affect the plugging performance of the emulsion as the slipping behavior and frictional resistance are influenced by the charge–charge interaction between the liquid–¬liquid and liquid¬–solid interfaces; this is governed by the pH value [15].
- v.
-
Electrical Conductivity:
It is carried out to evaluate the influence of oil fraction on the emulsion. As the oil percentage increases, the electrical conductivity of the emulsion decreases; this also corresponds to the severity factor of the emulsion, i.e., the more severe the emulsification (viscous), the lower will be the electrical conductivity [35]. This is mostly because of slowness in the fluidity of the droplets if oil is a continuous phase as per the 3D viscoelastic theory, and the possibility can arise vice versa in the dull movement of oil droplets in a continuous aqueous phase. In O/W emulsions, it is carried out to check the severity of emulsification and the influence of oil volume fraction on the emulsion, whereas generally, in W/O, it is carried out to validate the formation of oil as the external phase [3]. This helps in validating resistance to instability as a moderately viscous emulsion lowers the chances of flocculation or any other defects.
References
- Güzey, D.; McClements, D.J. Influence of Environmental Stresses on O/W Emulsions Stabilized by β-Lactoglobulin–Pectin and β-Lactoglobulin–Pectin–Chitosan Membranes Produced by the Electrostatic Layer-by-Layer Deposition Technique. Food Biophys. 2006, 1, 30–40.
- Yousufi, M.M.; Elhaj, M.E.M.; Moniruzzaman, M.; Ayoub, M.A.; Nazri, A.B.M.; Husin, H.B.; Saaid, I.B.M. Synthesis and evaluation of Jatropha oil-based emulsified acids for matrix acidizing of carbonate rocks. J. Pet. Explor. Prod. Technol. 2019, 9, 1119–1133.
- Saikia, T.; Sultan, A.; Barri, A.A.; Khamidy, N.I.; Shamsan, A.A.; Almohsin, A.; Bataweel, M. Development of pickering emulsified polymeric gel system for conformance control in high temperature reservoirs. J. Pet. Sci. Eng. 2020, 184, 106596.
- Hu, Y.T.; Ting, Y.; Hu, J.Y.; Hsieh, S.C. Techniques and methods to study functional characteristics of emulsion systems. J. Food Drug Anal. 2017, 25, 16–267.
- Aryee, A.N.A.; Agyei, D.; Udenigwe, C.C. 2-Impact of processing on the chemistry and functionality of food proteins. In Woodhead Publishing Series in Food Science, Technology and Nutrition, 2nd ed.; Yada, R.Y., Ed.; Woodhead Publishing: Sawston, UK, 2018; pp. 27–45.
- Chang, P.S. Determination of emulsion stability index in W/O emulsion. Anal. Sci. Technol. 1994, 7, 233–236.
- Russ, J.C. Image Analysis of Food Microstructure; CRC Press: Boca Raton, FL, USA, 2004.
- Bunker, K.L.; McAllister, D.; Allison, K.; Wagner, K.; Rickabaugh, K.; Levine, A.; Strohmeier, B.; Lee, R. TEM and FESEM: The right combination for enhanced particle characterization. Microsc. Microanal. 2008, 14 (Suppl. S2), 580–581.
- Mitbumrung, W.; Jain, S.; Winuprasith, T. Properties and stability of pickering emulsions stabilized by nanofibrillated mangosteen cellulose: Impact of oil type and emulsifier concentration. Songklanakarin J. Sci. Technol. 2020, 42, 468–476.
- McAuliffe, C.D. Oil-in-water emulsions and their flow properties in porous media. J. Pet. Technol. 1973, 25, 727–733.
- Chu, B. Laser light Scattering: Basic Principles and Practice; Courier Corporation: North Chelmsford, Chelmsford, MA, USA, 2007.
- HORIBA Scientific. A Guidebook to Particle Size Analysis. Distribution. 2016. Available online: https://www.horiba.com/fileadmin/uploads/Scientific/Documents/PSA/PSA_Guidebook.pdf (accessed on 20 August 2017).
- Wriedt, T. Mie Theory: A Review BT—The Mie Theory: Basics and Applications; Hergert, W., Wriedt, T., Eds.; Springer: Berlin/Heidelberg, Germany, 2012; pp. 53–71.
- Malvern Ltd. Zeta Potential: An Introduction in 30 Minutes. Zetasizer Nano Serles Tech. Note. MRK654-01 2011. Available online: https://www.research.colostate.edu/wp-content/uploads/2018/11/ZetaPotential-Introduction-in-30min-Malvern.pdf (accessed on 12 May 2023).
- Chen, Z.; Dong, M.; Husein, M.; Bryant, S. Effects of Oil Viscosity on the Plugging Performance of Oil-in-Water Emulsion in Porous Media. Ind. Eng. Chem. Res. 2018, 57, 7301–7309.
- Yu, L.; Sang, Q.; Dong, M.; Yuan, Y. Effects of Interfacial Tension and Droplet Size on the Plugging Performance of Oil-in-Water Emulsions in Porous Media. Ind. Eng. Chem. Res. Ind. Eng. Chem. Res. 2017, 56, 9237–9246.
- Pal, N.; Mandal, A. Oil recovery mechanisms of Pickering nanoemulsions stabilized by surfactant-polymer-nanoparticle assemblies: A versatile surface energies’ approach. Fuel 2020, 276, 118138.
- Tadros, T. Application of rheology for assessment and prediction of the long-term physical stability of emulsions. Adv. Colloid Interface Sci. 2004, 108–109, 227–258.
- Laurén, S. What Is a Sessile Drop Method? Biolin Scientific. Available online: https://www.biolinscientific.com/blog/what-is-a-sessile-drop-method (accessed on 12 May 2023).
- Laurén, S. 7 Ways to Measure Contact Angle. Biolin Scientific. 2021. Available online: https://www.biolinscientific.com/blog/7-ways-to-measure-contact-angle (accessed on 12 May 2023).
- What is Contact Angle? Brighton Science. Available online: https://www.brighton-science.com/what-is-contact-angle (accessed on 12 May 2023).
- Hu, H.H.; Joseph, D.D. Evolution of a liquid drop in a spinning drop tensiometer. J. Colloid Interface Sci. 1994, 162, 331–339.
- Interfacial Tension Measurement. Biolin Scientific. Available online: https://www.biolinscientific.com/measurements/interfacial-tension#interfacial-tension-measurement-with-optical-tensiometer (accessed on 12 May 2023).
- Singh, R.; Sivaguru, M.; Fried, G.A.; Fouke, B.W.; Sanford, R.A.; Carrera, M.; Werth, C.J. Real rock-microfluidic flow cell: A test bed for real-time in situ analysis of flow, transport, and reaction in a subsurface reactive transport environment. J. Contam. Hydrol. 2017, 204, 28–39.
- Alzahid, Y.A.; Mostaghimi, P.; Gerami, A.; Singh, A.; Privat, K.; Amirian, T.; Armstrong, R.T. Functionalisation of Polydimethylsiloxane (PDMS)- Microfluidic Devices coated with Rock Minerals. Sci. Rep. 2018, 8, 15518.
- Xu, K.; Zhu, P.; Colon, T.; Huh, C.; Balhoff, M. A microfluidic investigation of the synergistic effect of nanoparticles and surfactants in macro-emulsion-based enhanced oil recovery. SPE J. 2017, 22, 459–469.
- Li, S.; Yu, L.; Lau, H.C.; Stubbs, L.P. Experimental Study of Mobility Control by Clay-Stabilized Pickering Emulsions in High-Salinity Reservoirs. In Proceedings of the SPE Annual Technical Conference and Exhibition, Virtual, 26–29 October 2020; pp. 1–15.
- Wang, W.; Dong, X.; Liu, H.; Peng, Y.; Chen, Z.; Li, Y.; Guo, Y. Fly Ash Nanoparticle-Stabilized Emulsions for Improve Mobility Control Application. In Proceedings of the SPE EuropEC-Europe Energy Conference featured at the 83rd EAGE Annual Conference & Exhibition, Madrid, Spain, 6–9 June 2022.
- Sun, Z.; Pu, W.; Zhao, R.; Pang, S. Study on the mechanism of W/O emulsion flooding to enhance oil recovery for heavy oil reservoir. J. Pet. Sci. Eng. 2022, 209, 109899.
- Tadros, T.F. Fundamental principles of emulsion rheology and their applications. Colloids Surf. A Physicochem. Eng. Asp. 1994, 91, 39–55.
- Shambhu, V.B.; Bhattacharya, T.K.; Nayak, L.K.; Das, S. Studies on Characterization of Raw Jatropha Oil and its Biodiesels with Relevance of Diesel. Int. J. Emerg. Technol. Adv. Eng. 2013, 9001, 48–54.
- Yousufi, M.M.; Elhaj, M.E.M.; Moniruzzaman, M. Comparative Analysis of Corrosion Inhibition: Between Jatrophacurcas, Palm and Diesel Oil based Emulsified Acids for Acid Stimulation Operations. IOP Conf. Ser. Earth Environ. Sci. 2018, 164, 012006.
- Salhin, A.; Ali, M.; Abdurrhman, A.M. Determination of Free Fatty Acids in Palm Oil Samples by Non-Aqueous Flow Injection Using Colorimetric Reagent. Chem. Mater. Eng. 2013, 1, 96–103.
- Mitsubishi Chemical Analytech, Determination of Acid Number of Palm Oil. 2014. Available online: https://www.mccat.co.jp/archives/003/201703/044_GT200-OF030E.pdf (accessed on 12 May 2023).
- Wei, Z.; Li, M.; Lin, M.; Luo, T.; Yao, C. Electrical Conductivity and Stability of O/W Emulsions. Acta Pet. Sin. Pet. Process. Sect. 2008, 24, 592. Available online: http://www.syxbsyjg.com/EN/abstract/abstract477.shtml (accessed on 12 May 2023).
More
Information
Subjects:
Engineering, Petroleum
Contributors
MDPI registered users' name will be linked to their SciProfiles pages. To register with us, please refer to https://encyclopedia.pub/register
:
View Times:
4.2K
Revisions:
2 times
(View History)
Update Date:
12 Sep 2023
Table of Contents


Notice
You are not a member of the advisory board for this topic. If you want to update advisory board member profile, please contact office@encyclopedia.pub.
OK
Confirm
Only members of the Encyclopedia advisory board for this topic are allowed to note entries. Would you like to become an advisory board member of the Encyclopedia?
Yes
No
${ textCharacter }/${ maxCharacter }
Submit
Cancel
Back
Comments
${ item }
|
${ item.createdUser.fullName }
${ item.createdAt }
${ item.vote }
${ item.reply }
Delete
${ reply.createdUser.fullName }
${ reply.createdAt }
${ reply.vote }
Delete
There is no reply to this comment~
${ item.replyTextCharacter }/${ item.replyMaxCharacter }
Submit
Cancel
More
No more~
There is no comment~
${ textCharacter }/${ maxCharacter }
Submit
Cancel
${ selectedItem.replyTextCharacter }/${ selectedItem.replyMaxCharacter }
Submit
Cancel
Confirm
Are you sure to Delete?
Yes
No