| Version | Summary | Created by | Modification | Content Size | Created at | Operation |
|---|---|---|---|---|---|---|
| 1 | Chukwuma Anoruo | -- | 934 | 2023-07-20 20:15:47 | | | |
| 2 | Chukwuma Anoruo | + 323 word(s) | 1257 | 2023-07-22 17:12:03 | | | | |
| 3 | Chukwuma Anoruo | + 26 word(s) | 1283 | 2023-07-24 11:08:49 | | | | |
| 4 | Catherine Yang | -10 word(s) | 1273 | 2023-07-25 02:36:26 | | |
Video Upload Options
The validation of aerosol optical depth and its characterization describes how important the use of multiple instrument in the study of aerosols. The content of this work highlights recent results in the use of satellite, ground-based and modeling method to study aerosols.
1. Introduction
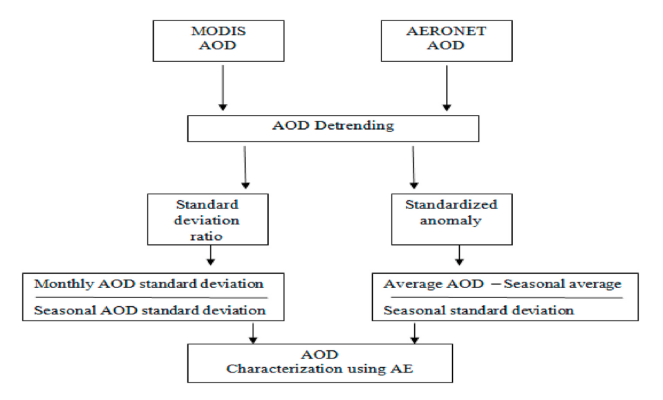
Aerosols as atmospheric suspension of particles in the atmosphere create a substantial amount of uncertainty in climate change. This suspended particle affect the global radiation budget indirectly by altering cloud and precipitation formation, and directly by absorbing or scattering solar radiation (Twomey, 1977). Atmospheric aerosols are more variable and inhomogeneous than gases, show distinct optical and chemical properties with space and time. Therefore, detailed characterizations of aerosols is of utmost importance. Knowledgeable identification of aerosol improves accuracy and thus very important for climate modeling (Anoruo,2020). However, the spectral dependence aerosol optical depth (AOD), expressed in Ångstrom Exponent (AE) has served as a good indicator of particle size (Che et al.,2018). The monitoring of aerosols through satellite remote sensing has remained a global trend (Kaufman et al., 2002). The aerosol optical properties measurements involve both in-situ and space-based remote sensing, and could be complemented with ground-based for calibration and validation precision. The space-based remote sensing techniques provides global coverage that depends on the Earth surface reflectance. Aerosol extraction has presented some limitations in accuracy and some discrepancies between different aerosol space-based products. Nonetheless, the spectral extinction of aerosols can be approximated with power law. For example, Mielonen et al. (2009) analyzed aerosol using AE values of fine and coarse particles corresponding to AE > 1.2 and AE < 0.6 respectively. For example in Fig. 1, the workflow for the characterization is presented. The characterization of aerosol types require further scientific technique for example the use of standardized and standard deviation ratio anomaly. This presented method has well been explained in Anoruo (2022). The results presented showed that atmospheric aerosols becomes maximum during June and minimum during July, August and September indicating that there are changes taking place in aerosol distribution. In addition, the June-September peak in aerosol is stronger and the efficiency index could be best determined if the extracted AOD is first detrend. The idea of this method has strictly characterized aerosol distribution. Therefore, it is highly essential to trace aerosols variation using different sites, which differs in both spatial and temporal scales. This idea will give an appropriate understanding of aerosol regional variation and its climatic effects. However, the idea to use seasonal space-based and ground-based datasets investigation still presents knowledge gap over all existing studies.The aerosol optical properties measurements involve both in-situ and space-based remote sensing, and could be complemented with ground-based for calibration and validation precision. The space-based remote sensing techniques provides global coverage that depends on the Earth surface reflectance. Aerosol extraction has presented some limitations in accuracy and some discrepancies between different aerosol space-based products. Nevertheless, ground-based observations does not provide complete global coverage, but the surface spectral measurements using direct Sun and sky radiation has provided continuously and very reliable techineque in deriving aerosol optical properties.
2. Application
The analysis presented by this study used Angstrom Exponent (AE) from Aerosol Robotic Network (AERONET) on visible to near infrared spectrum (440-675 nm), to characterize absorption of aerosol optical depth (AOD) from 2010-2019 at sites in Italy. To identify variations of aerosols during monsoon period, the standardized anomaly and the standard deviation ratio methods of analysis were adopted to address AE suitability. Standardized anomaly and standard deviation ratio shown in the workflow presented the method to characterize AOD using AE. The statistical significance is robust and new. To remove large influence of annual cycle, AOD data from both observations were first detrend. Detrending is to obtain the time series AOD month-wise average anomaly over the years for each grid cell. This is useful to explore meteorological trends, due to fact that seasonality in aerosol study makes it difficult to compare relative AOD changes. Aerosol characterization from literature has not been addressed fully using only monsoon periods. However, synoptic meteorological influences of monsoon to seasonal connections fraction were identified. The measurement by MODIS and AERONET can only be made for meteorological conditions. Nonetheless, bias towards atmospheric high pressure zone. MODIS and AEORNET provide space and time data with quality assured (QA) calculations. The scientific rationale to adjust AERONET wavelength to 550 nm for good precision using is Angstrom power law is advisable. Plausible correlation (r = 0.98) is obtained. However, AERONET discontinued surface-based observation at some sites and total of 7 sites is presented in this analysis with current decade AOD values. Butt et al. (2017) adopted the Deep Blue algorithm AOD products of the Terra and Aqua satellites from 2000 to 2013 to analyze changes of AOD over Arabia, and concluded that the Aqua satellite’s AOD data were closer to the AOD results measured by ground stations than the Terra satellite’s AOD data. However, since the Deep Blue algorithm performs better than the Dark Target algorithm over urban areas, and it can provide better land coverage over both dark and bright surfaces, which is more reasonable for AOD study, this study collocated both products for fine advancement. The presented period of data allowed adequate and current evaluations of monsoon aerosol variation. MODIS and AERONET are simply calculated as daily mean for each month. However AOD data is available in both daily and monthly terrain. The statistical step of Inverse Distance Weighting (IDW) to obtain convincing results.[1]
3. New Progress
The science-driven rationale of aerosol-cloud interactions over the study stations has not been documented. In addition, extensive representations of aerosol optical depth at many locations on Earth are essential, for example, in climate modeling.The unique aerosol optical depth (AOD) parameters not only constitute a suitable remote assessment of atmospheric aerosols from ground-based observations but also constitute a suitable remote assessment of atmospheric aerosols from ground-based observations (HolTo model the effects of aerosols, knowledge of AOD spectral dependence is important for the Earth’s radiative budget. Time series modeling has been useful for data generation and forecasting. Although, the challenge is that ground-based observation of AERONET has not been active in some regions and management strategies should be optimized. The implementation of such strategies will thoroughly evaluate the relationship between long-term climate changes with aerosols dynamics.
4. Results and Conclusion
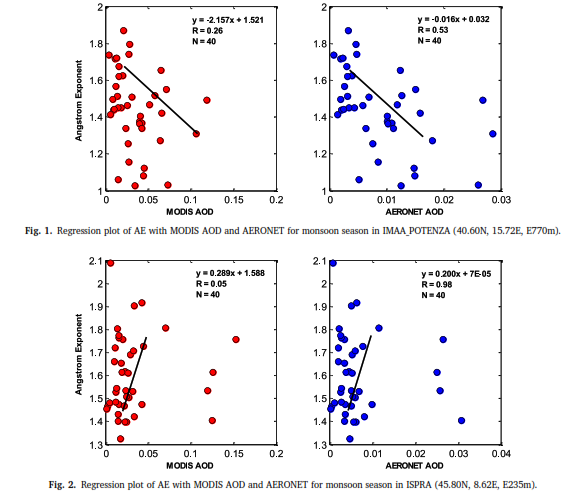
The fine aerosols due to high AE values interestingly present the characteristic of AOD predominance, but experience trans-seasonal change in September. However, the urban and biomass burning aerosols are identified by the wavelength and well characterized byusing frequency distribution to coarse and fine mode. However, it is apparent to notice that high dominance loading of aerosol has clear implication of local meteorology. Therefore, is relatively accurate to develop current characterizations of aerosol over the selected sites in Italy with sources. The chemical and optical interactions of aerosol with climate vary and notify to continuously monitor the coupling, as well authenticate space-based results with ground-based observation. The scientific rationale of failure of this could admit significant misinterpretation of aerosols microphysical interaction with local meteorology. The prosodies of relative mean bias (RMB) from MODIS and AERONET, which signify < 1 for underestimation and > 1 for overestimation indicates MODIS (RMB > 1) in all study sites. Aerosols study has major contribution to environmental conditions, which could result to changes in climate. It is therefore, customary to adopt high precision of AOD data handling. The synoptic advection of dust aerosol types has seasonal and local atmospheric composition influence. It is apparent to note that atmospheric circulation contributes to AOD dominance with low pressure region signifying high AOD loading. It could be seen that dust-driven aerosols dominates over the site which clearly indicate that AOD varies with site and heavily dependent on meteorological cycles [2][3][4][5][6][7].
References
- Butt MJ, Assiri ME, Ali MA Assessment of AOD variability over Saudi Arabia using MODIS deep blue products. Environ Pollut 2017, 231, 143-153.
- Twomey, S The influence of pollution on the shortwave albedo of clouds. Atmos. Sci 1977, 34, 1149--1152.
- Anoruo CM Modelling and Analysis of Aerosol and Cloud-Precipitable Water Inter- Hemispheric Interactions of Aerosol-Satellite Data Using Ground Observation. Aerosol Sci Eng 2020, 12, 120-134.
- Che, H., Qi, B., Zhao, H., Xia, X., Eck, T.F et al Aerosol optical properties and direct radiative forcing based on measurements from the China Aerosol Remote Sensing Network (CARSNET) in eastern China. . Atmos. Chem. Phys 2018, 18, 405–425.
- Kaufman, Y. J., Tanre´,D., Boucher,O A satellite view of aerosols in the climate system. Nature 2002, 419, 215– 223.
- Mielonen, T., Arola, A., Komppula, M., Kukkonen, J., Koskinen et al Comparison of CALIOP Level 2 Aerosol Subtypes to Aerosol Types Derived from AERONET Inversion Data. Geo Res Lett 2009, 36, 1-5.
- Anoruo CM Monsoon-seasonal validation of MODIS aerosol optical depth and characterization using AERONET observation retrieve over Italy . Environmental Research 2022, 204, 111985.


