Your browser does not fully support modern features. Please upgrade for a smoother experience.
Submitted Successfully!
 +1 credit
Thank you for your contribution! You can also upload a video entry or images related to this topic.
For video creation, please contact our Academic Video Service.
| Version | Summary | Created by | Modification | Content Size | Created at | Operation |
|---|---|---|---|---|---|---|
| 1 | Thanassis Mpimis | -- | 5196 | 2023-07-13 10:50:43 | | | |
| 2 | Camila Xu | Meta information modification | 5196 | 2023-07-14 02:33:50 | | |
Video Upload Options
We provide professional Academic Video Service to translate complex research into visually appealing presentations. Would you like to try it?
Cite
If you have any further questions, please contact Encyclopedia Editorial Office.
Mpimis, T.; Gikas, V.; Gourgoulis, V. Conceptualization and Implementation of Proposed On-Water Rowing System. Encyclopedia. Available online: https://encyclopedia.pub/entry/46744 (accessed on 24 June 2026).
Mpimis T, Gikas V, Gourgoulis V. Conceptualization and Implementation of Proposed On-Water Rowing System. Encyclopedia. Available at: https://encyclopedia.pub/entry/46744. Accessed June 24, 2026.
Mpimis, Thanassis, Vassilis Gikas, Vassilios Gourgoulis. "Conceptualization and Implementation of Proposed On-Water Rowing System" Encyclopedia, https://encyclopedia.pub/entry/46744 (accessed June 24, 2026).
Mpimis, T., Gikas, V., & Gourgoulis, V. (2023, July 13). Conceptualization and Implementation of Proposed On-Water Rowing System. In Encyclopedia. https://encyclopedia.pub/entry/46744
Mpimis, Thanassis, et al. "Conceptualization and Implementation of Proposed On-Water Rowing System." Encyclopedia. Web. 13 July, 2023.
Copy Citation
In competitive rowing, the finish time of a typical 2000 m race is governed by many factors during the course. These influencing factors are broadly known as rowing kinetics. They refer to biomechanical parameters concerned with the movement of the athlete’s body and the reaction of the boat equipment (oars, seat) to such input. The rapid advancements in multi-sensor technologies and data processing techniques opened widely the road for the development of specialized monitoring systems to fulfill the requirements for numerous applications.
biomechanics
kinetics
kinematics
stroke cycle
GNSS/INS
1. Introduction
The ultimate goal behind this approach is to improve performance indicators and thus to identify the causes that produce low-performing rowing cycles. The rowing stroke cycle is an iterative process for which critical parameters take repeated values within a range and around an equilibrium value, which changes per stroke cycle. To facilitate our goal, a performance improvement algorithm is proposed that uses summary indicators of the technique and performance in each rowing cycle (Figure 1).
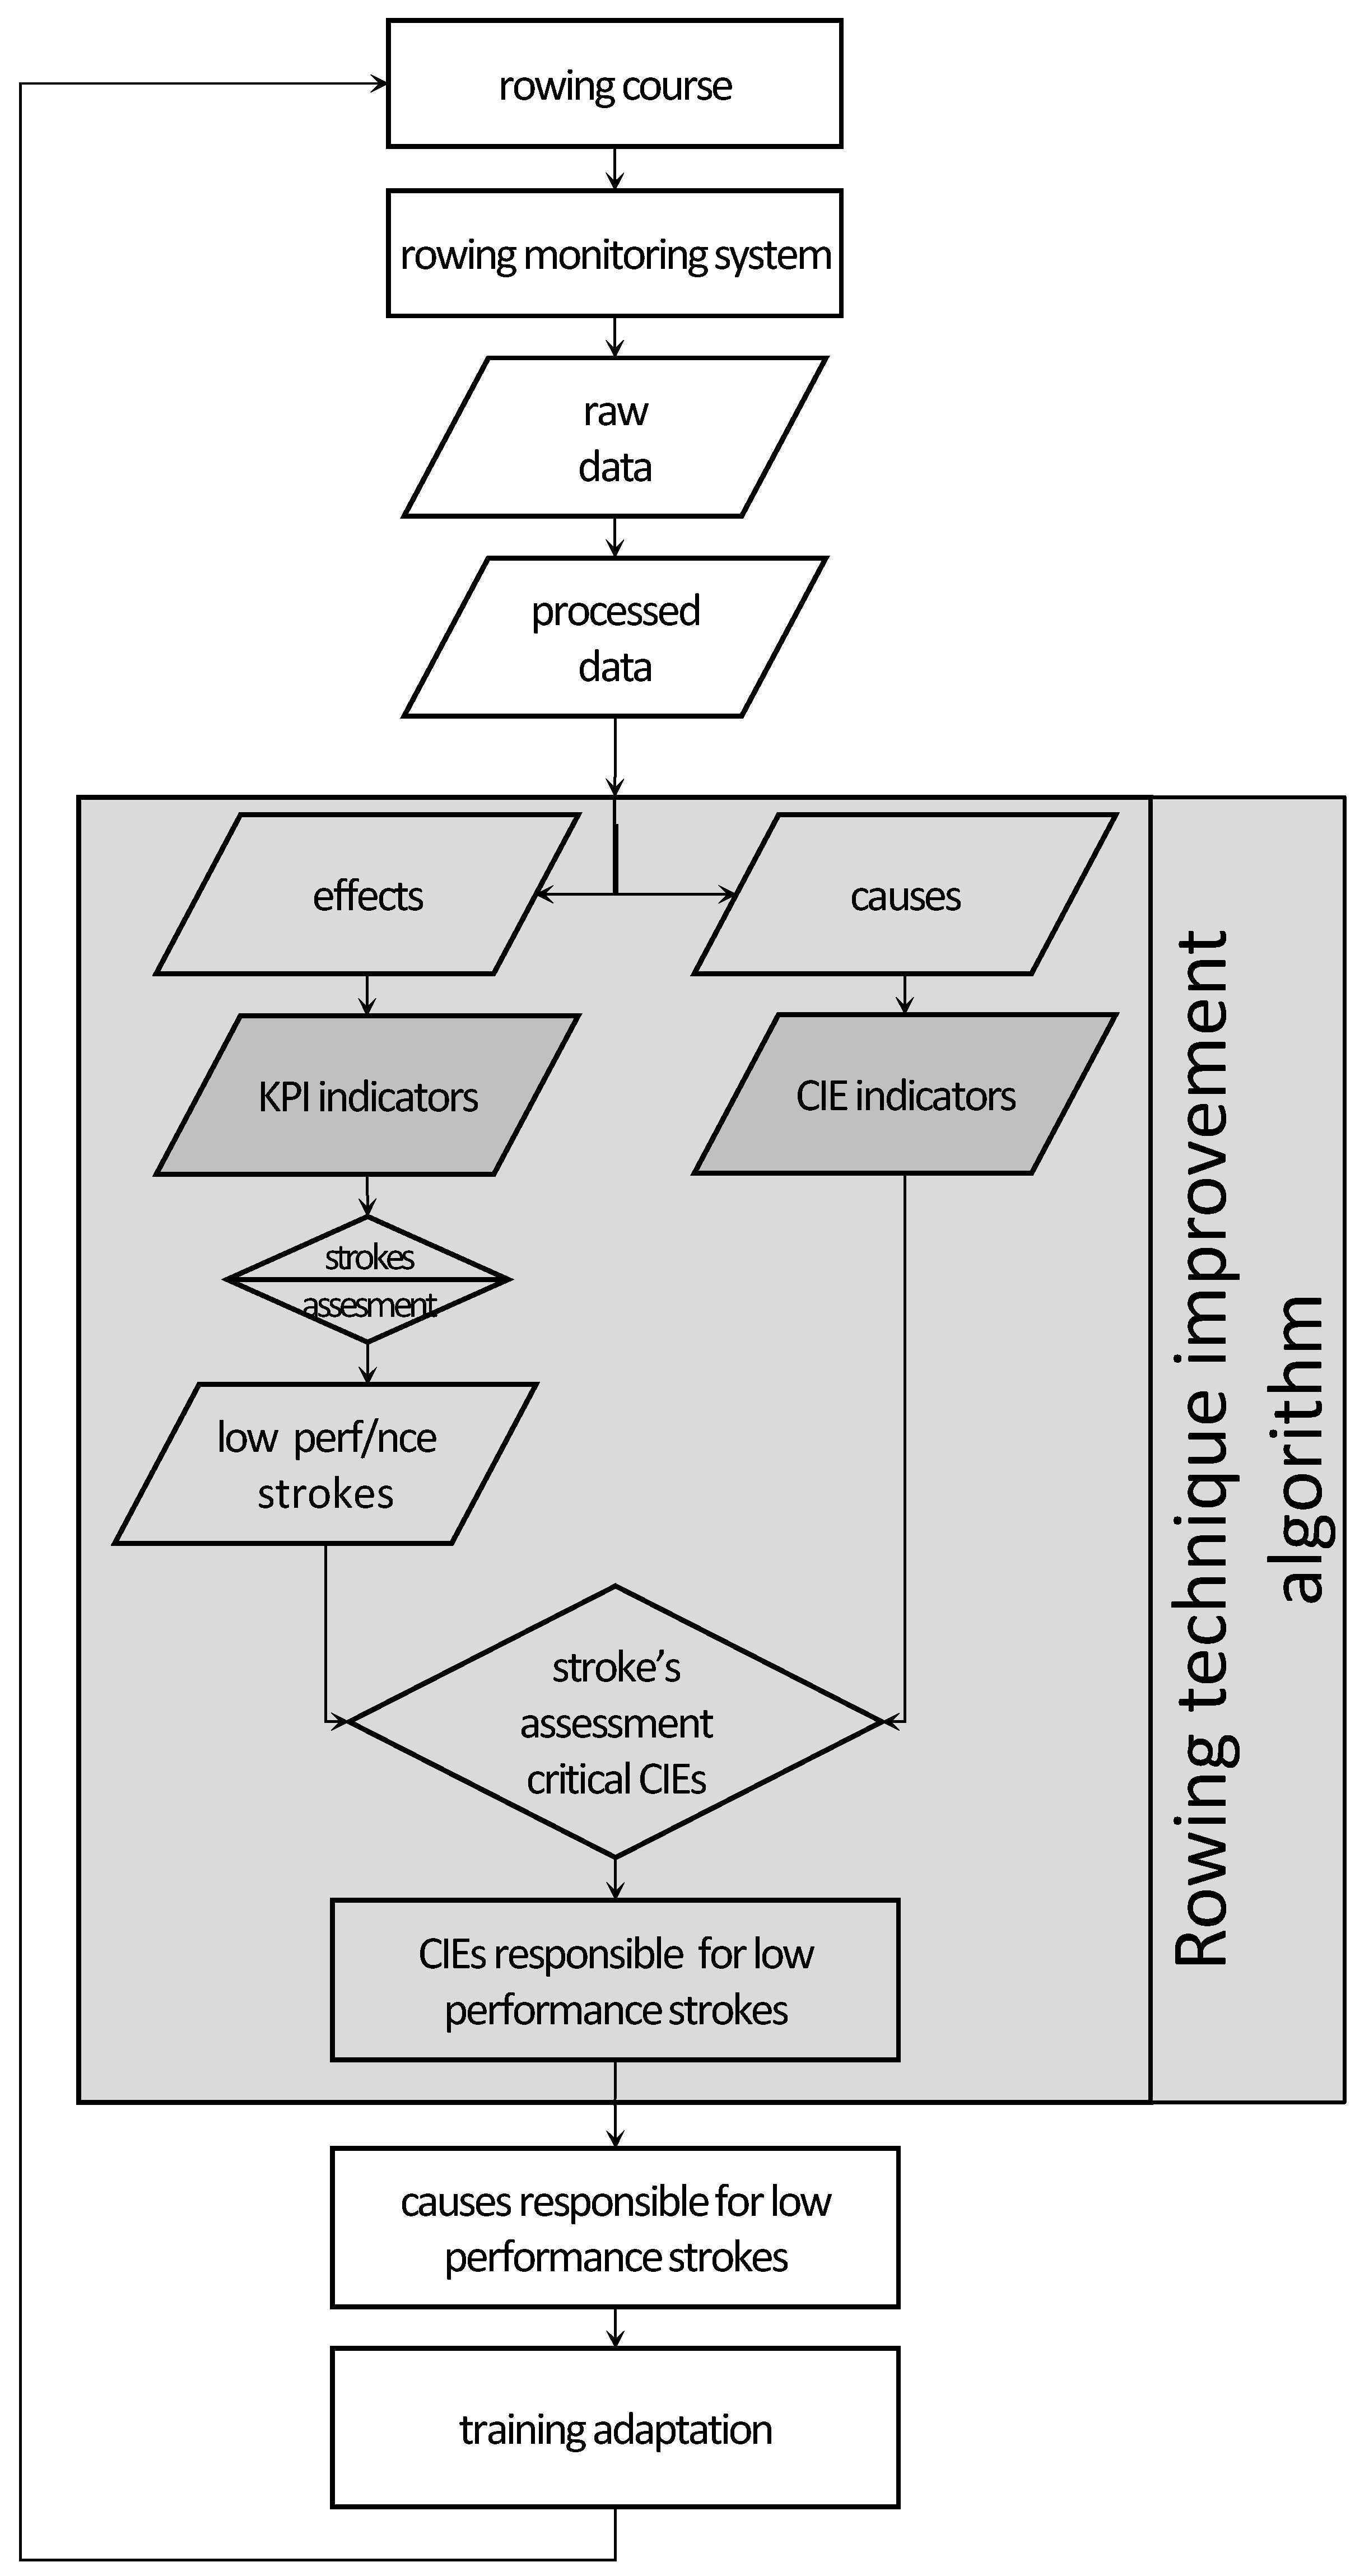
Figure 1. Algorithmic layout for technique monitoring and improvement in rowing.
These indicators are defined in such a way that they summarize the rowing stroke cycle using measured critical parameters. More specifically, the measured quantities are grouped in two categories: one concerned with the causes affecting the boat (applied technique), and a second one concerned with the response of the rowing boat to the causes (performance). The critical indicators used to describe the first category are called Critical Input Elements (CIEs), while the corresponding performance indicators are called Key Performance Indicators (KPIs).
As part of the performance improvement algorithm, the stroke cycles featuring low performance were selected by applying classification to KPI indicators. For the selected stroke cycles using CIEs, the measured parameters that were most responsible for the low performance can be estimated. Thus, the athlete’s training procedure is personalized according to its unique imprint as recorded by the proposed rowing monitoring system and errors in technique as detected by the performance improvement algorithm.
2. Parameters for Summarizing Performance and Technique
Rowing is a periodic movement since the rowing stroke cycle shapes up in four separate phases: catch, drive, finish, and recovery. The catch involves placing the oar blade in the water. Then, in order to move the boat, the rower drives the oars against the foot stretchers to pull the blade through the water. The finish is defined by the removal of the blade from the water. During recovery the rower moves slowly back up the slide toward the catch and feathers the oar blade so it is perpendicular to the surface of the water, ready for the next drive. Clearly, in order to achieve a good rowing performance, efficient but consistent stroke-to-stroke paddling is deemed necessary.
2.1. Key Performance Indicators (KPIs)
In this section, the results related to the evaluation criteria of the athlete’s performance based on the KPIs for the rowing data collected are defined, described, and presented. KPIs describe in a systematic and standardized way the degree of performance of the athlete reduced to the scale of a rowing stroke cycle or for the entire course.
In essence, the KPIs reflect the efficiency of the rower’s technique, which summarizes the characteristics of the rower’s course and performance. The computation of parameters in this category relies primarily on the boat’s localization features, which are appropriately transformed to reflect motion characteristics along and across the vessel motion. Then, through statistical processing, two evaluation levels are obtained: (a) for each individual stroke cycle of a course, and (b) for the mean stroke of a route as a representative–a characteristic stroke cycle for all.
The KPIs herein are divided into two main categories as follows:
Rowing boat kinematics parameters
Extra distance (cm): refers to the additional length that the boat travels during a course owing to the deviation of its trajectory from the ideal straight course. The ideal course is defined by the starting point and the end of the course.
Linear deflection (cm): refers to the average transverse deflection of the boat (mean value and standard deviation) from the ideal course.
Angular deflection (arcmin): refers to the average angular deflection of the boat’s course direction (mean value and standard deviation) from the ideal course direction.
Additional time (ms): refers to the additional time required to cover the extra distance. It is obtained by dividing by the average speed of the boat per oar cycle.
Rowing technique parameters
Stroke length (m): estimation of the travel length for each stroke cycle in terms of rowing stroke rate.
Velocity fluctuation (m/s): refers to the difference between the mean and the minimum stroke cycle speed.
Track deflection (m): refers to the surface enclosed between the actual and the ideal trajectory of the boat. To perceive and visualize it, it is divided by the ideal course length.
2.2. Critical Input Elements (CIEs)
The parameters that describe the rowing technique are called Critical Input Elements (CIEs). CIEs describe in a quantitative and explicit way the fundamental movements of the athlete and the boat equipment during a course. The information used to form the CIEs comes from the kinematic and kinetic data of the athlete’s body, the oars, and the hull of the boat.
Geometric quantities concerned with the equipment size and its location on the boat as well as somatometric figures are defined that summarize the athlete’s technique. A characteristic of these quantities in each stroke cycle is that they vary over a range of values (e.g., horizontal paddle angle of about [−60, 40] deg) and are not characterized by any fixed equilibrium value.
The CIEs adopted here are divided into two categories:
-
Parameters of regularity (symmetry and synchronization) during rowing technique:
-
Difference in the horizontal angles between the left and right oar in the transition phases during the “catch”, “drive”, and “finish” versus the time lag of their achievement (deg versus ms); indicates the degree of symmetry and synchronization of the horizontal movement of the oars during the stroke cycle. This results in three pairs of values.
-
Synchronization of the vertical angle between left and right oars during the application of maximum force into the stroke cycle (deg): indicates the degree of symmetry and synchronization of the sunk oars at the moment of the application of the maximum force in the stroke.
-
Symmetry of the horizontal and vertical angles for each oar at the moment of application of the maximum force during the stroke cycle (deg versus deg): indicates symmetry for the positions of the oars at the moment of application of the maximum force on the strokes.
-
Symmetry of the maximum application force to the stroke between the left and right oars during the “drive” phase (N): indicates the degree of symmetry and synchronization of the maximum force applied by the athlete through the oars to the gate.
-
-
Parameters of incorrect technique applied at the rowing cycle:
-
Incorrect sequence of movements during the “drive” phase of the stroke cycle (cm): the correct sequence of engagement of the three main muscle groups of the rower’s body in order to produce force during the drive phase is not maintained. The correct sequence dictates first the use of the quadriceps of the legs (legs), the back, and finally the biceps of the arms (arms). Thus, the correct sequence is legs–back–arms, and an error in this sequence will cause a regression of the athlete’s seat at the end of driving phase.
-
3. System Design
To achieve the goal of the proposed algorithm, it is necessary to calculate the KPI and CIE parameters as described in Figure 1. The data required for the calculation of these indices comes from an on-water rowing monitoring system that is adapted to the boat, its equipment, and also to the rower. Details on the design of this system are included in this chapter.
3.1. System Requirements
Here, a prototype model of an on-water system for monitoring rowing performance was developed. In order to ensure the completeness (in terms of observation types and their distribution) and operational efficiency (accuracy, availability, robustness, etc.) of the proposed system, a minimum set of design requirements need to be met.
On one hand, robustness is a prerequisite for the reliable operation of the system in real and tough outdoor conditions. On the other hand, high-quality measurement assurance, data completeness, and synchronization are necessary for the reliable assessment of the athlete’s technique based on field data.
-
System prototype functionality/durability: The proposed system has to be as light as possible while offering a high degree of autonomy to ensure smooth operation, even in abrupt operational conditions.
-
Requirements for high-quality field measurements: High precision, high reliability of synchronized measurements, and high data availability are critical in order to monitor and successfully extract the athlete’s technique.
The specifications examined in order to achieve the most accurate digitization are: (a) Analog to Digital resolution (bits), (b) maximum digitization rate, and (c) simultaneous digitization between different digitization channels.
3.2. Sensor Types and Technical Specifications
In order to successfully monitor a rowing event a number of different types of sensors are required to be placed across the entire platform (rower, boat, oars) in motion. There exist different categories of sensors depending on the installation environment, the desired accuracy, and the user interface. Clearly, the appropriate technical specifications should be defined, which will lead to the selection of the most suitable sensors for the current application. A key design specification of the proposed system assumes that boat kinematics are acquired independently from other parameters. In this regard, a separation between logging subsystems is also applied. The first logging system concerns the acquisition of the boat’s kinematics, while the second subsystem is dedicated to kinetics data associated with the athlete and boat equipment.
-
The boat’s kinematics acquisition subsystem
The reliable loggings of the boat’s kinematics require the combination of a satellite-positioning receiver, inertial sensors, and their processing via a real-time Kalman filter. The development of related systems is a solved problem in the era of kinematic localization and navigation and is not the aim of the current research. Thus, a commercial GPS/INS system was chosen to acquire the boat’s kinematic characteristics. The basic conditions imposed for the selection of such system are: (a) that it be lightweight, portable, and water-resistant; (b) that it has synchronization ability with the measurements of the other parts of the overall recording system; and (c) that it be low cost.
- The athlete’s and boat’s equipment kinetics acquisition subsystem
The specifications associated with the design and performance of this subsystem are particularly demanding compared to those concerned with the boat’s kinematics. More specifically, technical limitations must be considered in relation to the way the sensors can be adapted and installed on the boat equipment as well as on the rower’s body. Considering that the raw data originate from variant sensors, their sampling rates and time synchronization are vital. Obviously, simultaneous data collection by all sensors cannot be a prerequisite—such problems were dealt with in the pre-processing software.
For the second subsystem that logs kinetics data, all contributing sensors are analog. Their specifications relate to the individual parameter observed as follows:
-
Applied force on the oar rings: potentiometer bearing maximum dimensions of 7 × 5 × 10 mm (L × W × H), so that it can be integrated into the oar lock by the gate point of the boat. It features a measurement range up to 1 kN (about 100 kg), is waterproof, and accounts for an accuracy better than 10 N (approx. 1 kg).
-
Applied force at the soles of the rower’s feet: piezoelectric bearing area dimensions in the range of a typical foot (~25 × 15 cm) and thickness ≤1 mm, easily adjusted to fit on the shoes fixed on the boat, be flexible enough to adapt to the shape of the sole, be waterproof, have a measuring range of up to 50 kg per sole, and measure force with an accuracy better than 1 kg.
-
Linear position of the athlete’s seat: lightweight potentiometer, easily fitted under the rails of the seat, water-resistant, featuring a minimum measuring range of 0.70 m and a minimum accuracy of 1 mm.
-
Oar angle measurement sensor: potentiometer bearing the maximum physical dimensions of 25 × 25 × 25 mm (L × W × H) to allow integration in the oar lock by the boat gate, waterproof, featuring a minimum angle measurement range of 120 deg and an accuracy of at least 1.0 deg (equivalent to an oar blade displacement of about ±1 cm).
-
Joint angle measurement sensor on the rower’s limbs: strain gauge electrogoniometers bearing the maximum dimensions up to 25 × 50 × 20 mm (L × W × H) to allow fitting on the athlete’s limbs (elbow, hip), maximum weight of 30 g, waterproof, featuring a minimum range angle of 180 deg and an accuracy of better than 1.0 deg.
In order for the sensors to take up as little space and weight as possible, a common requirement suggests using standard (5 V) power bank voltage.
4. Rowing System Fabrication and Calibration
The selection of individual sensors and the construction phases (i.e., fabrication, assembling, and calibration) of the proposed system complied with the design requirements discussed.
4.1. Monitoring Sensors Characteristics and Accessories
In the proposed approach, the monitoring system is organized in two main parts; the first part aims at logging the boat kinematics, and the second one at recording the athlete’s kinetics and field parameters of the boat equipment (oars, seat).
-
Boat’s kinematic data acquisition subsystem
Reliable loggings of the boat’s kinematics require the combination of a satellite-positioning receiver and inertial sensors and their processing through real-time Kalman filtering to obtain a statistically optimal result. Today there exist numerous commercial options of blended GNSS/INS technologies of different grades. However, the key requirements for selecting such a system encompass physical limitations (i.e., low weight, portability, and water resistance), operational limitations (i.e., data source synchronization) as well as cost restrictions.
Here adopted a low-cost GNSS/MEMS INS unit (MTi-G-700 XSENS®). The system integrates a single frequency satellite-positioning receiver, three accelerometers, three gyroscopes, three magnetometers, and one barometer (Table 1). It is lightweight (60 g), water-resistant, and dust-resistant (IP67) and offers synchronization capabilities with other systems (sync in and sync out). It exports an integrated navigation solution at a sampling rate of 400 Hz.
Table 1. Sensors and accuracy specifications of the XSENS MTi-G-700 system (picture: [1]).
| Sensor Type | Quantity | Model | Data Rate | Accuracy Specs | |
|---|---|---|---|---|---|
| GNSS receiver | 1 | u-blox MAX-6 | 4 Hz | hz accuracy: 2.5 m CEP v. accuracy: 5.0 m CEP vel. accuracy: 0.1 m/s @30 m/s |
 |
| accelerometer | 3 | AD22293 | 2 kHz | bias repeatability: 0.03 m/s2 in-run bias stability: 40 μg noise density: 80 μg/√Hz non-orthogonal: 0.03 deg non-linearity: 0.03%FS |
|
| gyroscope | 1 | ADXRS646 (for azimuth estimation) |
2 kHz | noise density: 0.01°/s/√Hz non-linearity: 0.01%FS non-orthogonal: 0.05 deg |
|
| 2 | ADXRS620 | 2 kHz | noise density: 0.05°/s/√Hz non-linearity: 0.1%FS non-orthogonality: 0.05 deg |
||
| magnetometer | 3 | na | 50 Hz | noise density: 200 μG/√Hz non-linearity: 0.01%FS |
|
| barometer | 1 | na | 50 Hz | noise density: 0.01 hpa/√Hz |
The performance specifications of the XSENS MTi-G-700 are 1 m std in horizontal position accuracy and 0.05 m/s RMS in velocity. Furthermore, its performance characteristics for attitude determination for dynamic applications are 0.3 deg at roll/pitch and 1.0 deg at azimuth. These values refer to the benchmarking of the integrated positioning system against reference trajectories and not the internal accuracy of the system [1].
- Athlete’s and boat’s equipment kinetic data acquisition subsystem
The performance specifications of this subsystem are particularly demanding compared to those for the boat kinematics. Specifically, certain limitations apply for the sensor housing and installation on the boat, the oars, and the athlete’s body. Moreover, considering that a number of different sensors are contributing data recordings, time synchronization becomes a key requirement. Table 2 summarizes the type, model, and performance characteristics of the sensors used here. They are analog, water-resistant devices powered with 5 V DC that provide output voltages (measurements) ending up in a digitizer.
Table 2. Types and specifications of sensors included in the on-water rowing monitoring system.
| Category | Sub-Category | Installation Point | Type of Measurement |
Digitizer | Sensor Type | Model | Performance Specifications |
Photo |
|---|---|---|---|---|---|---|---|---|
| boat equipment | oarlock at boat gate | oarlock at boat gate | angles (Hz/V) | NI 6211 | potentiometer | Bourns 3501H | linearity: ±0.25% resolution: inf |
 |
| force at oarlock | NI 9237 | load cell | Omega LCPB-100 | linearity: ±0.02% FS hysteresis: ±0.01% FS |
 |
|||
| footstep | soles in the rowing shoes | force at footstep | NI 6211 | piezoelectric | Tekscan A401 | linearity: <±3% FS repeatability: <±2.5% hysteresis: <3.5%FS response: <5 µs |
 |
|
| seat | seat position | displacement | potentiometer | Celesco MT3A | accuracy: ±0.15% FS repeatability: ±0.02% FS resolution: inf |
 |
||
| athlete body | elbow | athlete elbow | joint angle | NI 9237 | strain gauge/ Wheatstone bridge |
Biometrics SG110 | accuracy: ±2 deg over 90 deg repeatability: <±1 deg resolution: inf |
 |
| hip | athlete hip | Biometrics SG150 |
The sensors included in Table 2 can be divided in two categories depending on the way their voltage output is digitized. The first category includes the sensors whose operation requires a digitizer with a port for voltage measurement from a Whinstone bridge (full/half/quarter). Contrarily, the second category includes sensors relying on a plain analog voltage output and a digitizer with an analog input port. In particular, the digitizer adopted here (NI 6211, National Instruments) incorporates 16 analog input channels (analog in), 2 analog output channels (analog out), 4 digital output channels (digital out), and 4 digital input channels (digital in). The NI 9237 National Instruments digitizer is a Wheatstone type bridge digitizer (full/half/quarter) with the ability to simultaneously acquire measurements on four channels. A single chassis (NI 9171) was chosen to power this digitizer via the USB interface.
4.2. Oarlock Retrofit and Installation
The oar ring is a plastic assembly connected through the oar gate on the rigger extension aiming to stabilize and assist the rotation of the oar during the rowing cycle. The oar rings were suitably retrofitted to integrate two variable voltage dividers (potentiometers) for measuring the oar rotation angles (horizontal and vertical) with respect to the oar gates of the boat (Figure 2a). Furthermore, a load cell was fixed on the inner side of the oar rings to measure the applied force on the oar gate transmitted via the oar (Figure 2a). The modified oar ring was larger compared to the standard one so that could facilitate sensor placement. Oar ring modification included:
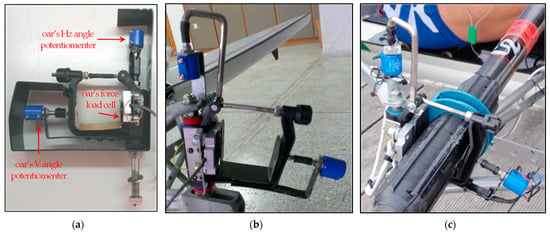
Figure 2. (a) Preliminary modified rowing oar ring, (b) final version of the modified rowing oar ring, and (c) modified rowing oar ring installed in a rowing boat.
-
Oar ring retrofit: A rigid metal blade was placed on the inner side of the oar ring, where the paddle rests, to monitor its vertical movement and transfer the rotation to the potentiometer, as shown in Figure 2b.
-
Ring body machining: For the needs of retrofitting and adapting the sensors, it was prerequisite to machine the material of the ring. Figure 2a shows the first stage following ring retrofitting and machining, while Figure 2c illustrates the modified oar ring after final improvements.
4.3. Central Unit Fabrication
The sensor controlling unit encompasses: (a) the connectors of the measuring sensors, (b) the digitizers used for converting the observed signal from analog to digital, (c) the conductors connecting the connectors to the digitizers, (d) the PC used in the role of central processing unit for the management and recording of the sensor data, and finally, (e) the battery supplying unit.
The data recording and digitization elements of the system were placed in a polycarbonate/plastic case with the dimensions 30 × 23 × 86.7 cm (L × W × H). The PC and MEMS GPS/INS subsystem operated using two lithium polymer batteries. Analog sensors were powered by a power bank so that its power supply voltage was also recorded in order to counterbalance any supply voltage drops during the stroke cycle, mainly because of the internal resistance of the voltage dividers. The connection among individual connectors and the sensors was accomplished through wiring. The wiring used to interconnect the sensors to the digitizers was carefully designed to run along the rowing boat without affecting the movement of athlete and the boat equipment (seat, oars) during the stroke cycle. At the construction stage of the monitoring system, especially during the assembling of the sensors in the control unit, particular attention was paid to ensuring continuity between (a) the sensors and the digitizers, (b) the digitizers with the micro-PC, and finally (c) the batteries with the sensors and the PC. In this way, the supply voltage of the sensors and the correct capture of records on the PC were verified (Figure 3).
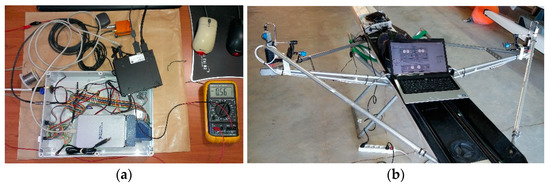
Figure 3. (a) Controller wiring check during system fabrication, (b) system installation test on a single scull boat, and off-water data acquisition test.
At a validation stage, the functionality of the recording system was examined under real operating conditions. In this manner, the ability of the control PC to record the necessary volume of information was assessed, including the size of the raw data files. In addition, it was equally critical to control the temperature of the recording system during operational conditions, considering that the case used for housing the digital recording system was sealed to protect the electronic parts from moisture and water.
4.4. Rowing System Setup and Calibration
Prior to on-water testing, the rowing system was tested in dry dock conditions. Off-water testing included individual controls undertaken to ensure communication and operational settings, autonomous duration capabilities, and the overall fidelity of the system according to the design specifications.
The last type of check concerned the evaluation of the fidelity of the measured quantities when transformed from the analog sensors. Specifically, a thorough checking was undertaken to verify whether the system’s recordings corresponded to the actual physical quantities (e.g., directions, displacement, and force) by converting the voltage measurements of the analog sensors. The conversion of voltage to physical quantities was achieved using the equations proposed by the manufacturer. Notably, during this check, substantial discrepancies were observed between the actual and calculated values of the measured voltage. Thus, it was considered necessary to calibrate the analog sensors.
The calibration equations recommended by the sensor manufacturers converted measured voltage (volts) to physical size (degrees, centimeters, kilograms) units derived from numerous measurements and calibration procedures using higher precision sensors. As a result, the realization of the calibration equations varied, leading to a discrepancy between the actual and calculated values of the physical quantities. For this reason, it was deemed necessary to recalibrate all analog sensors. Specifically, the following sensors were re-calibrated:
-
Angle sensors placed to record instantaneous oar direction using a high precision geodetic Total Station,
-
Linear displacement sensors of the seat, using a high precision geodetic Total Station,
-
Force measurement sensors using a tension compression machine (MTS Insight 10 kN).
This process resulted in a number of calibration parameters for each sensor used to convert the measured voltage into natural units. In effect, discrepancies from the equations recommended by the manufacturers were observed.
5. Data Acquisition Software
5.1. Data Logging Software
Data collection necessitates properly parameterized software, so that, depending on sensor type and principle of operation (digital or analog), it acquires and efficiently stores raw data.
The GPS/INS MEMS subsystem used for recording boat kinematics (MTi-G-700, XSENS) used MT Manager XSENS software, which allows sensor parameterization. It also allows the recording of raw data for post-processing or recording the real-time navigation solution as result of the integrated Kalman filter. The digitizers used for the Analog to Digital Conversation (ADC) were produced by the National Instruments (NI) Company. Dedicated software routines were developed in the LabVIEW environment to configure the digitizers and store recordings to the local storage unit (SSD disk).
The micro-PC integrated into the recording system offered Wi-Fi access point capabilities. Therefore, dedicated software on a portable device (tablet) was developed to assist the coach monitoring the rower’s real-time performance.
5.2. Data Handling Software
The raw data were stored locally in the micro-PC’s disk drive in two ASCII files. At the preprocessing stage, a prerequisite is the conversion of both files into binary MATLAB® files (binary .mat file). Because of the large data volume and the large number of recording sensors, this process took place in two stages. First, it included data extraction with a time stamp originating from the corresponding sensor, and second, storage of the measurements for each sensor in a separate binary .mat file.
Each one of the raw ASCII log files created at the subsystem level possessed its own structure. Thus, a script was created in Python 2.7 programming language to handle every data file. It converted logs from the GPS/INS subsystem time to UNIX time seconds and coordinates from the WGS’84 geographic coordinates to be projected in the HTRS’87 (Hellenic Transformation Reference System 1987). According to the logs that were generated from the LabVIEW data collection software that was developed, a script created two columns for each digitized channel: one with absolute UNIX time, and a second with the digitized voltage records.
The last step of data preparation involved converting the boat attitude measurements (accelerations and angles) to a suitable coordinate system and data type (from ASCII to binary .mat files). The realization of the reference system (body frame) assumed its origin coinciding at the center of mass of the boat. Its parameters were defined as follows: the +x-axis points along the longitudinal axis of the boat in the direction of motion, the +y-axis points perpendicular to the x-axis on the right hand as the rower faces the stern of the boat, while the +z-axis completes the clockwise reference system—see Figure 4. In addition, course made good direction (azimuth) was defined as the clockwise angle created by the x-axis of the body frame from geographical north.
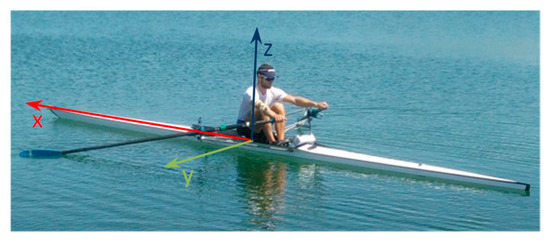
Figure 4. Body frame reference system projected on the rowing boat.
5.3. Coordinate System Transformation
Considering that the rowing system employed a GPS/INS receiver, the boat trajectory was originally obtained in the WGS’84 (World Geodetic System 1984) reference system, which transformed it to projected coordinates of the HTRS’87 (Hellenic Terrestrial Reference System 1987). Finally, in order to study the boat trajectory efficiently, projection coordinates were transformed to a local reference system (body frame). More specifically, this local coordinate system (Figure 5) was defined as follows: (a) its origin coincided with the initial position of the boat when placed on the rowing lane before the start, (b) the semi-axis Ox was aligned to the rowing lane, and (c) the −yy axis was perpendicular to the semiaxis Ox with the positive signs being on the right hand of the rower pointing the way forward of the boat.
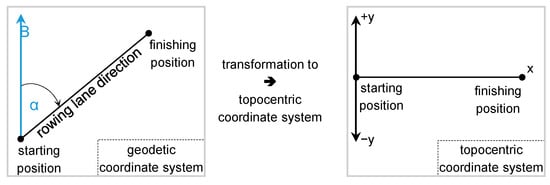
Figure 5. Geodetic to rowing lane topocentric coordinate system transformation.
6. Data Processing Software
6.1. Data Logs Synchronization and Filtering
In order to analyze the rowing technique, the time series of raw data needed to be sliced and grouped into individual stroke cycles for a rowing course. The first step was the synchronization of the records as formatted from the previous stage of data handling.
Data synchronization between digital and analog sensors was originally designed using the GPS/INS pulse (Τ = 2.5 ms, f = 400 Hz) as a recording command (trigger). However, the Wheatstone bridge digitizer (NI 9237) has connectivity only for reference pulses (master timebase—fM) of at least 3.1 MHz to digitize with a cycle of at least 2.56 ms (390.625 Hz) according to Equation (1) [2]—and not for a trigger signal.
fs = fM/256/n, n = 1, 2, …, 3 (1)
Because of this incompatibility, data synchronization between digital and analog sensors using a PC clock was mandatory. After data synchronization, data resampling took place so that the recordings of all sensors were acquired in the same time intervals between consecutive recordings for the same recording interval. Finally, for all sensors, a unique time reference was created with a fixed time interval of 2.5 ms (400 Hz) between data recordings.
Digital filtering was applied to all analog sensor recordings after synchronization. The maximum rowing rate an athlete can achieve was approximately 40 spm (strokes per min) or otherwise 40/60 strokes per second or otherwise 40/60 Hz = 0.667 Hz. Therefore, considering that periodic phenomena associated with the stroke cycle exhibited a period of less than 1 s, a cutoff frequency of 10 Hz was chosen [3]. The filter applied was a digital, low-pass Parks–McClellan filter that belongs to the FIR family [4].
6.2. Data Logs Unit Conversion and Initialization
Analog sensor recordings were synchronized and filtered for noise; however, the measurement units remained electrical voltage (volts). Using the calibration parameters process of the analog sensors, they were converted into physical units.
Although the monitoring system is portable, it can be easily installed on different boats. After installation of the system, sensors have to be initialized in order to make the results between different boats and athletes comparable. Initialization takes place while the boat is floating at rest, and the athlete applies the predetermined position and movements of boat’s equipment, setting zero values of the analog sensors.
6.3. Stroke Cycle Extraction and Normalization
A rowing course consists of stroke cycles, each stroke cycle being divided into phases. The execution of each phase of the stroke cycle and the transition from one phase to the next have a direct impact on the applied technique, and by extension, on the rowing performance. In order to take into account the periodicity that is inherent in the stroke cycles, it is necessary to split the entire time series of data into consecutive stroke cycles. The procedure adopted here assumes that the start point of every cycle coincides with the time instant the horizontal angle of the left oar is zero; that is, when the oar is perpendicular to the longitudinal axis of the boat, while still in the “recovery” phase. This assumption relies on the following observations:
-
During the “recovery” phase, the boat exhibits the highest speed during the stroke cycle and, therefore, maintains better balance.
-
The sign change of the horizontal angle (positive to negative transition) is in the midtime of the recovery phase.
-
The horizontal angle’s zero value is fixed and is independent of the athlete, the equipment settings, and the characteristics of the stroke cycle.
In order to estimate the time that the horizontal angle becomes zero, a linear interpolation between the two nearest points at sign change of the horizontal angle, is applied. After the segmentation of stroke cycles is evident, there is a need for normalizing (standardizing) the rowing cycles so that they are directly comparable. The need for standardization is critical considering the duration of the stoke cycles is not constant, either because the rower does not perform uniformly or because of the variation in the rowing rate within the stroke cycle.
Stroke cycle normalization is carried out in two stages (Figure 6) based on the reference rowing rate. In the first stage of the normalization process (I), the duration of the stroke cycle is set as equal to the duration of the reference stroke cycle. This assumption is made by imposing a deformation factor, which is calculated for each stroke cycle and applied to the duration of the stroke cycle. At the second stage of normalization (II), the timestamps are resampled in order to assign the same number of records of each observation type in each stroke cycle.
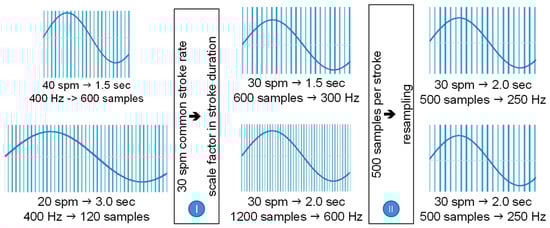
Figure 6. Example of normalizing two different stroke cycles (40 and 20 spm) at a reference stroke cycle of 30 spm.
Therefore, for the case of a part of a race that includes 50 stroke cycles at an average rowing rate of 30 spm and an analog sensor recording rate of 50 kHz/31, the matrix of recordings for each measured parameter exhibits a dimension [161,290 × 1] according to Equation (2), since:
60/30 s/min/strokes/min × 50 strokes × 50,000/31 samples/s = 161,290 samples (2)
At a post normalization stage, the recording matrix counts a dimension [500 × 50] in which every column represents a stroke cycle containing 500 records. Conclusively, the normalization process allows for monitoring, comparing, and correlating consecutive rowing cycles, even for different rowers and/or races at different rowing rates.
References
- XSENS. MTi User Manual, Document MT0605P, Revision I; User Manual Document MT0605P; XSENS: Enskord, The Netherlands, 2016.
- National Instruments. DAQ M Series-NI USB-621x User Manual; National Instruments: Austin, TX, USA, 2009.
- Llosa, J.; Vilajosana, I.; Navarro, N.; Suriñach, E.; Marquès, J.M. REMOTE, a Wireless Sensor Network Based System to Monitor Rowing Performance. Sensors 2009, 9, 7069–7082.
- Rabiner, L.R.; McClellan, J.H.; Parks, T.W. FIR digital filter design techniques using weighted Chebyshev approximation. Proc. IEEE 1975, 63, 595–610.
More
Information
Subjects:
Sport Sciences; Instruments & Instrumentation
Contributors
MDPI registered users' name will be linked to their SciProfiles pages. To register with us, please refer to https://encyclopedia.pub/register
:
View Times:
593
Revisions:
2 times
(View History)
Update Date:
14 Jul 2023
Table of Contents


Notice
You are not a member of the advisory board for this topic. If you want to update advisory board member profile, please contact office@encyclopedia.pub.
OK
Confirm
Only members of the Encyclopedia advisory board for this topic are allowed to note entries. Would you like to become an advisory board member of the Encyclopedia?
Yes
No
${ textCharacter }/${ maxCharacter }
Submit
Cancel
Back
Comments
${ item }
|
${ item.createdUser.fullName }
${ item.createdAt }
${ item.vote }
${ item.reply }
Delete
${ reply.createdUser.fullName }
${ reply.createdAt }
${ reply.vote }
Delete
There is no reply to this comment~
${ item.replyTextCharacter }/${ item.replyMaxCharacter }
Submit
Cancel
More
No more~
There is no comment~
${ textCharacter }/${ maxCharacter }
Submit
Cancel
${ selectedItem.replyTextCharacter }/${ selectedItem.replyMaxCharacter }
Submit
Cancel
Confirm
Are you sure to Delete?
Yes
No