 +1 credit
| Version | Summary | Created by | Modification | Content Size | Created at | Operation |
|---|---|---|---|---|---|---|
| 1 | Adelfo Escalante | -- | 3198 | 2023-06-26 19:31:58 | | | |
| 2 | Wendy Huang | Meta information modification | 3198 | 2023-06-27 07:59:51 | | |
Video Upload Options
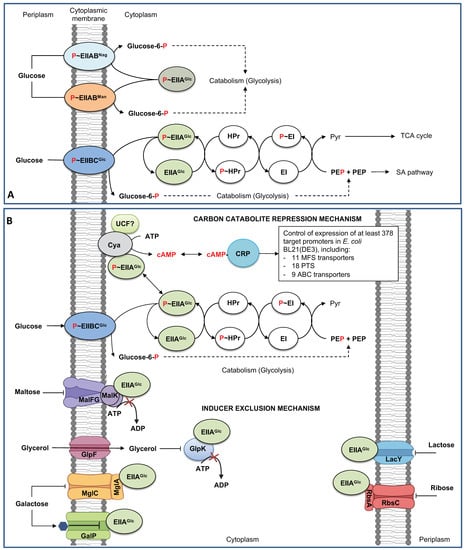
Escherichia coli is the best-known model for the biotechnological production of many biotechnological products, including housekeeping and heterologous primary and secondary metabolites and recombinant proteins, and is an efficient biofactory model to produce biofuels to nanomaterials. Glucose is the primary substrate used as the carbon source for laboratory and industrial cultivation of E. coli for production purposes. Efficient growth and associated production and yield of desired products depend on the efficient sugar transport capabilities, sugar catabolism through the central carbon catabolism, and the efficient carbon flux through specific biosynthetic pathways. The genome of E. coli MG1655 is 4,641,642 bp, corresponding to 4702 genes encoding 4328 proteins. The EcoCyc database describes 532 transport reactions, 480 transporters, and 97 proteins involved in sugar transport. Nevertheless, due to the high number of sugar transporters, E. coli uses preferentially few systems to grow in glucose as the sole carbon source. E. coli nonspecifically transports glucose from the extracellular medium into the periplasmic space through the outer membrane porins. Once in periplasmic space, glucose is transported into the cytoplasm by several systems, including the phosphoenolpyruvate-dependent phosphotransferase system (PTS), the ATP-dependent cassette (ABC) transporters, and the major facilitator (MFS) superfamily proton symporters.
1. Introduction
| Gene(s) | Transporter Family | Transported Sugar | PROTEINS | Cellular Location |
|---|---|---|---|---|
| alsBAC | ABC | D-allose | D-allose ABC transporter membrane | P, IM, C |
| araFGH | ABC | L-Arabinose | Arabinose ABC transporter | P, IM, C |
| malEFG-malK | ABC | Maltose/maltodextrine | Maltose ABC transporter | P, IM, C |
| malK | ABC | Maltose/maltotetraose/ maltotriose |
Maltose ABC transporter ATP binding subunit | IM |
| mglBAC | ABC | D-galactose/methyl-galactoside | D-galactose/methyl-galactoside ABC transporter | P, IM, C |
| rbsACB | ABC | Ribose/D-xylose | Ribose ABC transporter | P, IM |
| upgBAEC | ABC | sn-Glycerol 3-phosphate | sn-Glycerol 3-phosphate ABC transporter | P, IM, C |
| xylFHG | ABC | D-Xylose | Xylose ABC transporter | P, IM, C |
| yphFED | ABC | Sugar | Putative ABC transporter | P, IM |
| ytfQRT-yjfF | ABC | β-D-Galactofuranose α-D-Galactofuranose |
Galactofuranose ABC transporter | P, IM |
| araE | MFS (SP) | Arabinose | Arabinose:H+ symporter | IM |
| dgoT | MFS (ACS) | D-Galactonate | D-Galactonate:H+ symporter | IM |
| fucP | MFS (FHS) | L-Fucose/D-arabinose/ L-galactose |
L-fucose:H+ symporter | IM |
| galP | MFS (SP) | D-Galactose | Galactose:H+ symporter | IM |
| garP | MFS (ACS) | Galactarate/D-glucarate | Galactarate/D-glucarate transporter | IM |
| glpT | MFS (OPA) | Glycerol-3-phosphate | sn-glycerol 3-phophate:phosphate antiporter | IM |
| gudP | MFS (ACS) | Galactarate/D-glucarate | Galactarate/D-glucarate transporter | IM |
| lacY | MFS (OHS) | Lactose/melibiose | Lactose/melibiose:H+ symporter | IM |
| lgoT | MFS (ACS) | L-Galactonate | L-Galactonate:H+ symporter | IM |
| setA | MFS (SET) | Lactose | Sugar exporter SetA | IM |
| setB | MFS (SET) | Lactose | Sugar exporter SetB | IM |
| setC | MFS (SET) | Arabinose-like | Putative arabinose exporter | IM |
| uhpC | MFS (OPA) | Sugar phosphate | Inner membrane protein sensing glucose-6-phosphate | IM |
| uhpT | MFS (OPA) | Hexose-6-phosphate | Hexose-6-phosphate:phosphate antiporter | IM |
| xylE | MFS (SP) | Xylose | D-xylose:H+ symporter | IM |
| ydeA | MFS (DHA1) | Arabinose | L-arabinose exporter | |
| agaBCD | PTS | Galactosamine | Galactosamine specific PTS system EIIBCD | IM, C |
| agaV | PTS | n-acetyl-D-galactosamine (galactose) |
N-acetyl-D-galactosamine specific PTS system IIB | C |
| ascF | PTS | β-Glucoside (arbutin/cellobiose/salicin) |
β-Glucoside specific PTS enzyme IIBC | IM |
| bglF | PTS | β-Glucoside (metil-β-D-glucoside, arbutine, salicin, β-D-glucose) |
β-Glucoside specific PTS enzyme II/BglG kinase/BglG phosphatase | IM |
| chbAC | PTS | β-D-Cellobiose/chitobiose (starch, sucrose) |
N, N’-diacetyl chitobiose-specific PTS enzyme IIAC | C |
| chbB | PTS | β-D-Cellobiose/chitobiose (starch, sucrose) |
N, N’-diacetyl chitobiose-specific PTS enzyme IIB | IM |
| cmtA | PTS | Mannitol (fructose and mannose) |
Mannitol-specific PTS enzyme IICB | IM |
| cmtB | PTS | Mannitol (fructose and mannose) |
Mannitol-specific PTS enzyme IIA | C |
| fruA | PTS | Fructose and mannose | Fructose-specific PTS multi-phosphoryl transfer protein FruA PTS system EIIBC | IM |
| frvA | PTS | Fructose-like | Putative PTS enzyme IIA | C |
| frvB | PTS | Fructose-like | Putative PTS enzyme IIBC | IM |
| frwB—frwD | PTS | Fructose-like | Fructose-like PTS system EIIB | C |
| frwC | PTS | Fructose-like | Fructose-like PTS system EIIC | IM |
| fryC | PTS | Fructose-like | Fructose-like PTS system EIIC | IM |
| fryB | PTS | Fructose-like | Fructose-like PTS system EIIB | C |
| gatA | PTS | Galactitol | Galactitol-specific PTS system EIIA | C |
| gatB | PTS | Galactitol | Galactitol-specific PTS system EIIB | C |
| glvBC | PTS | α-Glucoside | Alpha-glucoside PTS system EIICB | IM |
| malX | PTS | Maltose/glucose | PTS enzyme IIBC component MalX | IM |
| manYZ | PTS | Mannose | Mannose-specific PTS system EIICD | IM |
| manX | PTS | Mannose | Mannose-specific PTS system EIIAB | IM, C |
| mngA | PTS | 2-O-α-mannosyl-D-glycerate | 2-O-α-mannosyl-D-glycerate specific PTS enzyme IIABC | IM |
| mtlA | PTS | Mannitol (fructose, mannose) |
Mannitol-specific PTS enzyme IICBA | IM |
| nagE | PTS | n-Acetylglucosamine | N-acetylglucosamine-specific PTS enzyme II | IM |
| ptsG | PTS | Glucose | Glucose-specific PTS enzyme IIBC component | IM |
| ptsHIcrr | PTS | Glucose | ptsH, phosphor carrier protein HPr ptsI, PTS enzyme I crr, Enzyme IIAGlc |
C |
| sgcA | PTS | Galactitol-like | Galactitol-specific PTS system EIIA | C |
| sgcB | PTS | Galactitol-like | Galactitol-specific PTS system EIIB | C |
| sgcC | PTS | Galactitol-like | Galactitol-specific PTS system EIIC | IM |
| srlA | PTS | Glucitol/Sorbitol | Sorbitol specific PTS system IIC2 | IM |
| srlB | PTS | Glucitol/Sorbitol | Sorbitol specific PTS system EIIA | C |
| srlE | PTS | Glucitol/Sorbitol | Sorbitol specific PTS system IIBC1 | IM |
| treB | PTS | Trehalose | Trehalose-specific PTS enzyme IIBC | IM |
| ulaABC | PTS | Ascorbate | L-ascorbate specific PTS system EIICBA | IM, C |
| bglH | OT (C/P) | β-Glycosides | Carbohydrate-specific outer membrane porin, cryptic | OM |
| glpF | OT (MIP) | Glycerol | Glycerol facilitator | IM |
| lamB | OT (C/P) | Maltose | Maltose outer membrane channel/phage lambda receptor protein | OM |
| melB | OT (EDP) | Melibiose | Melibiose:H+/Na+/Li+ symporter | IM |
| ompF | OT (C/P) | Sugar | Outer membrane porin F | OM |
| ompC | OT (C/P) | Sugar | Outer membrane porin C | OM |
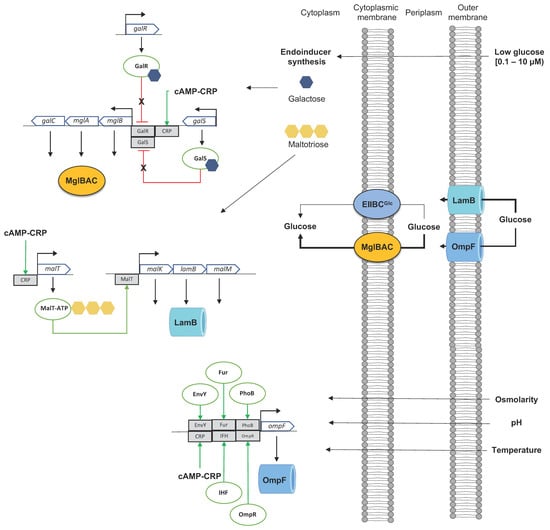
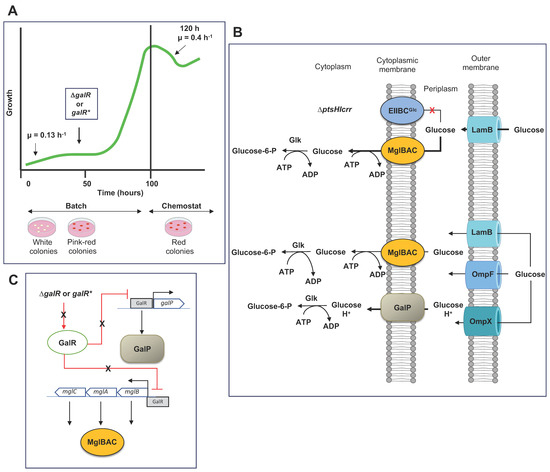
2. Dynamics of Glucose Transport in E. coli under Sugar-Limiting Conditions
| Parental Strain | PTS Mutation | Growth and Relevant Changes in the Expression of Several Genes Involved in Transport Respect the Parental Strain | References | |
|---|---|---|---|---|
| MG1655 | ΔptsG | Aerobic conditions | Anaerobic conditions | [20] |
| Decrement in μ of 73%. Increased expression of galS and down-regulation of galP (0.2 X) and manX (0.5 X). Overexpression of the mgl operon in 10 X. Downregulation of cyaA and increased levels of cAMP: 552.5 X. |
Decrement in μ of 70.2%. Increased expression of galS and downregulation of galP. Increased expression of malE (48 X). Overexpression of the mgl operon in 48 X. Down-regulation of cyaA with increased levels of cAMP: 390.9 X. |
|||
| JM101 | ΔptsHIcrr | Reduction in μ~85% to 57%. | [34][35] | |
| Overexpression of mglB 13.4 X and lamB 17.6 X. | ||||
| Overexpression of some genes of the gal regulon: galP 12.4 X, galR 3.2X, galS 4.9X. | ||||
| MG1655 | ptsHIcrr KO | Reduction in μ~79%. | [36] | |
References
- Yang, D.; Prabowo, C.P.S.; Eun, H.; Park, S.Y.; Cho, I.J.; Jiao, S.; Lee, S.Y. Escherichia coli as a platform microbial host for systems metabolic engineering. Essays Biochem. 2021, 65, 225–246.
- McElwain, L.; Phair, K.; Kealey, C.; Brady, D. Current trends in biopharmaceuticals production in Escherichia coli. Biotechnol. Lett. 2022, 44, 917–931.
- Martínez, K.; de Anda, R.; Hernández, G.; Escalante, A.; Gosset, G.; Ramírez, O.T.; Bolívar, F.G. Coutilization of glucose and glycerol enhances the production of aromatic compounds in an Escherichia coli strain lacking the phosphoenolpyruvate: Carbohydrate phosphotransferase system. Microb. Cell Factories 2008, 7, 1.
- Bren, A.; Park, J.O.; Towbin, B.D.; Dekel, E.; Rabinowitz, J.D.; Alon, U. Glucose becomes one of the worst carbon sources for E. coli on poor nitrogen sources due to suboptimal levels of cAMP. Sci. Rep. 2016, 6, 24834.
- Alva, A.; Sabido-Ramos, A.; Escalante, A.; Bolívar, F. New Insights into transport capability of sugars and its impact on growth from novel mutants of Escherichia coli. Appl. Microbiol. Biotechnol. 2020, 104, 1463–1479.
- Jeckelmann, J.-M.; Erni, B. Transporters of glucose and other carbohydrates in Bacteria. Pflug. Arch. Eur. J. Physiol. 2020, 472, 1129–1153.
- Jahreis, K.; Pimentel-Schmitt, E.F.; Brückner, R.; Titgemeyer, F. Ins and outs of glucose transport systems in Eubacteria. FEMS Microbiol. Rev. 2008, 32, 891–907.
- Dean, D.A.; Reizer, J.; Nikaido, H.; Saier, M.H. Regulation of the maltose transport system of Escherichia coli by the glucose-specific enzyme iii of the phosphoenolpyruvate-sugar phosphotransferase system. characterization of inducer exclusion-resistant mutants and reconstitution of inducer exclusion in proteoliposomes. J. Biol. Chem. 1990, 265, 21005–21010.
- Görke, B.; Stülke, J. Carbon catabolite repression in bacteria: Many ways to make the most out of nutrients. Nat. Rev. Microbiol. 2008, 6, 613–624.
- Carmona, S.B.; Moreno, F.; Bolívar, F.; Gosset, G.; Escalante, A. Inactivation of the PTS as a strategy to engineer the production of aromatic metabolites in Escherichia coli. J. Mol. Microbiol. Biotechnol. 2015, 25, 195–208.
- Keseler, I.M.; Gama-Castro, S.; Mackie, A.; Billington, R.; Bonavides-Martínez, C.; Caspi, R.; Kothari, A.; Krummenacker, M.; Midford, P.E.; Muñiz-Rascado, L.; et al. The EcoCyc Database in 2021. Front. Microbiol. 2021, 12, 711077.
- Karp, P.D.; Billington, R.; Caspi, R.; Fulcher, C.A.; Latendresse, M.; Kothari, A.; Keseler, I.M.; Krummenacker, M.; Midford, P.E.; Ong, Q.; et al. The BioCyc collection of microbial genomes and metabolic pathways. Brief. Bioinform. 2017, 20, 1085–1093.
- Paalme, T.; Elken, R.; Kahru, A.; Vanatalu, K.; Vilu, R. The growth rate control in Escherichia coli at near to maximum growth rates: The A-stat approach. Antonie Leeuwenhoek 1997, 71, 217–230.
- Nikaido, H. Porins and specific channels of bacterial outer membranes. Mol. Microbiol. 1992, 6, 435–442.
- Masi, M.; Winterhalter, M.; Pagès, J.-M. Outer membrane porins. In Bacterial Cell Walls and Membranes; Kuhn, A., Ed.; Springer International Publishing: Cham, Switzerland, 2019; pp. 79–123. ISBN 978-3-030-18768-2.
- Saier, M.H.; Reddy, V.S.; Moreno-Hagelsieb, G.; Hendargo, K.J.; Zhang, Y.; Iddamsetty, V.; Lam, K.J.K.; Tian, N.; Russum, S.; Wang, J.; et al. The Transporter Classification Database (TCDB): 2021 Update. Nucleic Acids Res. 2020, 49, D461–D467.
- Jeckelmann, J.-M.; Erni, B. Carbohydrate transport by group translocation: The Bacterial phosphoenolpyruvate: Sugar phosphotransferase system. In Bacterial Cell Walls and Membranes; Kuhn, A., Ed.; Springer International Publishing: Cham, Switzerland, 2019; pp. 223–274. ISBN 978-3-030-18768-2.
- Deutscher, J.; Francke, C.; Postma, P.W. How Phosphotransferase system-related protein phosphorylation regulates carbohydrate metabolism in bacteria. Microbiol. Mol. Biol. Rev. 2006, 70, 939–1031.
- Somavanshi, R.; Ghosh, B.; Sourjik, V. Sugar influx sensing by the phosphotransferase system of Escherichia coli. PLoS Biol. 2016, 14, e2000074.
- Steinsiek, S.; Bettenbrock, K. Glucose transport in Escherichia coli mutant strains with defects in sugar transport systems. J. Bacteriol. 2012, 194, 5897–5908.
- Shimada, T.; Fujita, N.; Yamamoto, K.; Ishihama, A. Novel roles of cAMP receptor protein (CRP) in regulation of transport and metabolism of carbon sources. PLoS ONE 2011, 6, e20081.
- Tierrafría, V.H.; Rioualen, C.; Salgado, H.; Lara, P.; Gama-Castro, S.; Lally, P.; Gómez-Romero, L.; Peña-Loredo, P.; López-Almazo, A.G.; Alarcón-Carranza, G.; et al. RegulonDB 11.0: Comprehensive high-throughput datasets on transcriptional regulation in Escherichia coli K-12. Microb. Genom. 2022, 8, mgen000833.
- Escalante, A.; Salinas Cervantes, A.; Gosset, G.; Bolívar, F. Current knowledge of the Escherichia coli phosphoenolpyruvate–carbohydrate phosphotransferase system: Peculiarities of regulation and impact on growth and product formation. Appl. Microbiol. Biotechnol. 2012, 94, 1483–1494.
- Ferenci, T. Adaptation to life at micromolar nutrient levels: The regulation of Escherichia coli glucose transport by endoinduction and cAMP. FEMS Microbiol. Rev. 1996, 18, 301–317.
- Ferenci, T. Hungry Bacteria—Definition and properties of a nutritional state. Environ. Microbiol. 2001, 3, 605–611.
- Notley-McRobb, L.; Death, A.; Ferenci, T. The Relationship between external glucose concentration and cAMP Levels inside Escherichia coli: Implications for models of phosphotransferase-mediated regulation of adenylate cyclase. Microbiology 1997, 143, 1909–1918.
- Liu, X.; Ferenci, T. Regulation of porin-mediated outer membrane permeability by nutrient limitation in Escherichia coli. J. Bacteriol. 1998, 180, 3917–3922.
- Geanacopoulos, M.; Adhya, S. Functional characterization of roles of GalR and GalS as regulators of the gal regulon. J. Bacteriol. 1997, 179, 228–234.
- Death, A.; Ferenci, T. Between feast and famine: Endogenous inducer synthesis in the adaptation of Escherichia coli to growth with limiting carbohydrates. J. Bacteriol. 1994, 176, 5101–5107.
- Krishna, S.; Orosz, L.; Sneppen, K.; Adhya, S.; Semsey, S. Relation of Intracellular signal levels and promoter activities in the gal regulon of Escherichia coli. J. Mol. Biol. 2009, 391, 671–678.
- Notley, L.; Ferenci, T. Differential expression of Mal genes under cAMP and Endogenous inducer control in nutrient-stressed Escherichia coli. Mol. Microbiol. 1995, 16, 121–129.
- Rodriguez, A.; Martínez, J.A.; Báez-Viveros, J.L.; Flores, N.; Hernández-Chávez, G.; Ramírez, O.T.; Gosset, G.; Bolivar, F. Constitutive expression of selected genes from the pentose phosphate and aromatic pathways increases the shikimic acid yield in high-glucose batch cultures of an Escherichia coli strain lacking PTS and pykF. Microb. Cell Factories 2013, 12, 17.
- Chandran, S.S.; Yi, J.; Draths, K.M.; von Daeniken, R.; Weber, W.; Frost, J.W. Phosphoenolpyruvate availability and the biosynthesis of shikimic acid. Biotechnol. Prog. 2003, 19, 808–814.
- Flores, N.; Flores, S.; Escalante, A.; de Anda, R.; Leal, L.; Malpica, R.; Georgellis, D.; Gosset, G.; Bolívar, F. Adaptation for fast growth on glucose by differential expression of central carbon metabolism and gal regulon genes in an Escherichia coli strain lacking the phosphoenolpyruvate:carbohydrate phosphotransferase system. Metab. Eng. 2005, 7, 70–87.
- Aguilar, C.; Escalante, A.; Flores, N.; de Anda, R.; Riveros-McKay, F.; Gosset, G.; Morett, E.; Bolívar, F. Genetic changes during a laboratory adaptive evolution process that allowed fast growth in glucose to an Escherichia coli strain lacking the major glucose transport system. BMC Genom. 2012, 13, 385.
- McCloskey, D.; Xu, S.; Sandberg, T.E.; Brunk, E.; Hefner, Y.; Szubin, R.; Feist, A.M.; Palsson, B.O. Adaptive laboratory evolution resolves energy depletion to maintain high aromatic metabolite phenotypes in Escherichia coli strains lacking the phosphotransferase system. Metab. Eng. 2018, 48, 233–242.
- Martínez, J.A.; Bolívar, F.; Escalante, A. Shikimic acid production in Escherichia coli: From classical metabolic engineering strategies to omics applied to improve its production. Front. Bioeng. Biotechnol. 2015, 3, 145.
- Aguilar, C.; Martínez-Batallar, G.; Flores, N.; Moreno-Avitia, F.; Encarnación, S.; Escalante, A.; Bolívar, F. Analysis of differentially upregulated proteins in ptsHIcrr− and rppH− mutants in Escherichia coli during an adaptive laboratory evolution experiment. Appl. Microbiol. Biotechnol. 2018, 102, 10193–10208.
- Hernández-Montalvo, V.; Martínez, A.; Hernández-Chavez, G.; Bolivar, F.; Valle, F.; Gosset, G. Expression of galP and Glk in a Escherichia coli PTS mutant restores glucose transport and increases glycolytic flux to fermentation products: galP and glk genes restore glucose assimilation capacity in E. coli PTS−. Biotechnol. Bioeng. 2003, 83, 687–694.
- Balderas-Hernandez, V.E.; Sabido-Ramos, A.; Silva, P.; Cabrera-Valladares, N.; Hernandez-Chavez, G.; Baez-Viveros, J.L.; Martinez, A.; Bolivar, F.; Gosset, G. Metabolic engineering for improving anthranilate synthesis from glucose in Escherichia coli. Microb. Cell Factories 2009, 8, 19.
- Carmona, S.B.; Flores, N.; Martínez-Romero, E.; Gosset, G.; Bolívar, F.; Escalante, A. Evolution of an Escherichia coli PTS− Strain: A study of reproducibility and dynamics of an adaptive evolutive process. Appl. Microbiol. Biotechnol. 2020, 104, 9309–9325.
- Onyeabor, M.; Martinez, R.; Kurgan, G.; Wang, X. Engineering transport systems for microbial production. In Advances in Applied Microbiology; Elsevier: Amsterdam, The Netherlands, 2020; Volume 111, pp. 33–87. ISBN 978-0-12-820705-5.

