Your browser does not fully support modern features. Please upgrade for a smoother experience.
Submitted Successfully!
 +1 credit
Thank you for your contribution! You can also upload a video entry or images related to this topic.
For video creation, please contact our Academic Video Service.
| Version | Summary | Created by | Modification | Content Size | Created at | Operation |
|---|---|---|---|---|---|---|
| 1 | Julio Garcia | -- | 3079 | 2023-06-20 18:28:02 | | | |
| 2 | Sirius Huang | Meta information modification | 3079 | 2023-06-21 04:13:56 | | |
Video Upload Options
We provide professional Academic Video Service to translate complex research into visually appealing presentations. Would you like to try it?
Cite
If you have any further questions, please contact Encyclopedia Editorial Office.
Mansoor, O.; Garcia, J. 4D-Flow Imaging in Aortic Valve Disease. Encyclopedia. Available online: https://encyclopedia.pub/entry/45879 (accessed on 25 July 2026).
Mansoor O, Garcia J. 4D-Flow Imaging in Aortic Valve Disease. Encyclopedia. Available at: https://encyclopedia.pub/entry/45879. Accessed July 25, 2026.
Mansoor, Omer, Julio Garcia. "4D-Flow Imaging in Aortic Valve Disease" Encyclopedia, https://encyclopedia.pub/entry/45879 (accessed July 25, 2026).
Mansoor, O., & Garcia, J. (2023, June 20). 4D-Flow Imaging in Aortic Valve Disease. In Encyclopedia. https://encyclopedia.pub/entry/45879
Mansoor, Omer and Julio Garcia. "4D-Flow Imaging in Aortic Valve Disease." Encyclopedia. Web. 20 June, 2023.
Copy Citation
The development of abnormal blood flow has been demonstrated to be due to a variety of pathological causes, such as atherosclerotic plaque or valvular disease. Traditionally, cardiovascular magnetic resonance imaging (MRI) has provided high-quality imaging of the heart with its surrounding structures. 4D-flow imaging is an advanced cardiac MR imaging technique that allows fluid hemodynamics to be measured non-invasively in patients. As a growing field in radiology, its adaptation and clinical use remain underutilized.
cardiac flow
abnormal blood flow
4D-flow MRI
valvular disease
1. Introduction
Understanding how blood flow is measured through current non-invasive technology is important for its use in clinical environments. Traditionally, cardiovascular magnetic resonance imaging (MRI) has provided high-quality imaging of the heart with its surrounding structures. Recent advancements in MRI sequences and technology facilitate the quantification of blood flow [1][2][3]. Historically, phase contrast MRI has extended quality images to include angiography and outline flow within blood vessels. Velocity has only been measured in-plane, perpendicular to a blood vessel, such as through a Doppler ultrasound. By using a phase-contrast approach and applying three-dimensional velocity-encoding, Figure 1, we can capture both blood flow velocity and the heart’s anatomy [2]. This MRI technique is called ‘time resolved’ three-dimensional MRI, commonly known as 4D-flow MRI, which also allows additional flow characteristics to be quantified [4]. Moreover, advanced 4D-flow-based parameters can be extracted, for example, turbulent kinetic energy (TKE), which has been compared in research studies and used in risk stratification, disease outcomes, and potential changes in management [5][6]. TKE describes the kinetic energy of the fluctuating velocity field, which is computed using the intravoxel velocity standard deviation from the velocity magnitude images [7].
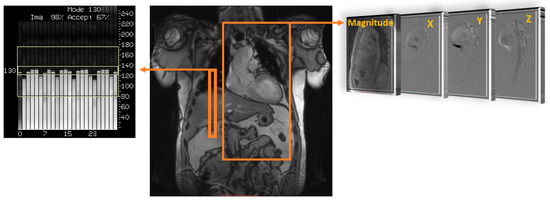
Figure 1. Data acquisition of 4D flow. Coverage of the region of interest; in this example, the thoracic aorta (large orange rectangle) is acquired using electrocardiographic gating and respiratory control to reduce motion artifacts, using diaphragm navigator gating (small orange rectangle). Velocity encoding (right side) obtains blood flow velocities along all three spatial dimensions (X, Y, and Z) and anatomy magnitude over the cardiac cycle.
2. Cardiovascular 4D-Flow
The current literature describes a novel understanding of measuring abnormal blood flow using 4D-flow imaging and key flow parameters closely associated with it. The process of obtaining hemodynamic measurements with 4D-flow imaging has been well defined in the last decade. Standard-of-care 2D phase contrast MRI (PC-MRI) measures thought plane velocity and fails to capture the complex nature of abnormal blood flow. It has the advantage of having a short acquisition of ~20 s. For 4D-flow imaging, however, the acquisition is longer, 10–20 min, using basic acceleration protocols [1][4][8]. The reason behind the additional scan time is the volumetric velocity acquisition of the blood flow in three dimensions, as opposed to one direction seen in 2D PC-MRI [9]. As a result, 4D flow captures the complex nature of the cardiovascular blood flow, as shown in Figure 2.
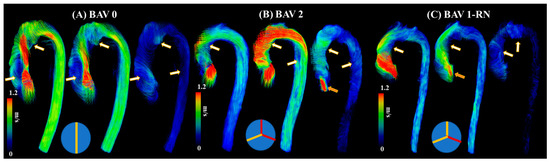
Figure 2. Examples of abnormal blood flow in bicuspid valve disease. Panel (A) illustrates a true bicuspid valve (schematic at the bottom), panel (B) illustrates a type 2 valve fusion phenotype (schematic at the bottom, red lines correspond to valve fusion), and panel (C) illustrates a type 1 valve fusion phenotype (schematic at the bottom). White-gold arrows point to regions with abnormal blood flow patterns at systolic acceleration, peak systole, and systolic deceleration. Orange arrows point to valvular regurgitation or insufficiency.
3. Clinical Applications in Bicuspid Valve Disease
The initial clinical observations were mostly focused on qualitative imaging characteristics produced by BAV. The qualitative assessment included classification schemes for aortic dilation and valve–fusion morphology. A key milestone in understanding the relationship between abnormal blood flow and different aortic pathologies is the advancement of imaging techniques to assess blood flow velocities. The flow across the aorta is currently examined with single-direction velocity; however, 4D-flow imaging allows 3D velocity measurements to quantify blood flow in various directions. For hemodynamic imaging, characteristics signal loss patterns and abnormal blood flow patterns (e.g., helicity and vorticity) were mostly reported. Their main limitations remained the subjectivity of the evaluation and high observer variability. The development of BAV aortopathy has been attributed to genetic and hemodynamic bases. The latter motivated the introduction of quantitative hemodynamic approaches. Two of the most recurrent markers are WSS and flow displacement. WSS has been extensively evaluated and was expected to bring an association with the extracellular matrix in the aorta, resulting in matrix disruption and elastin fragmentation with increased WSS. The main limitation of WSS, as derived from 4D flow, is the limited spatial resolution near the wall (~2.5 mm by voxel). Flow displacement was introduced as a simplified metric of abnormal flow patterns while ensuring the capture of the maximum blood flow displacement and providing a simple way to replace the qualitative assessment of blood flow patterns.
One of the first studies outlining abnormal blood flow in BAV using MRI was performed by Rees et al. [10]. In this study, thirty-six patients were examined after aortic coarctation repair using different imaging modalities. Although abnormal blood flow was not the main objective of this study, it does illustrate the early usage of MRI technology to examine signal loss as a potential marker for blood flow. Six patients from seven demonstrated marked systolic signal loss, which was attributed to the high velocity at the isthmus after the repair of the coarctation. Four additional patients demonstrated abnormal blood flow across the aortic valve, which was presumed to be due to a BAV. This study did introduce the link between abnormal blood flow and signal loss on MRI.
One primary question was to demonstrate why a two-leaflet valve has a higher fail rate than a three-leaflet valve [11]. This study highlights abnormal blood flow as an underestimated factor in BAV disease progression because it can induce irregular patterns of opening and closing of the valve. This irregular pattern can predispose the valve to fibrosis and calcification. This work also illustrates how abnormal blood flow passed the valve can influence the aortic wall and, over time, lead to dissection and dilation. The authors mostly examined preserved BAV from deceased patients that had molds created and were examined in a simulator. The only imaging conducted was ultrasound. Robicsek et al. [11] provide a pathophysiological basis for abnormal blood flow across BAV and the subsequent clinical implications of having two leaflets.
An increasing amount of evidence showcases that BAV disease and its associated aortic complications, such as dilation, occur even in hemodynamic normal BAV [12]. Abnormal or aberrant blood flow might not be the cause of the downstream aortic effects of having a BAV. However, a case report performed by Hope et al. outlines the first direct approach to using 4D-flow imaging to specifically examine abnormal blood flow and flow parameters in a 14-year-old child with BAV [13]. The patient had aortic coarctation, and the authors hypothesized that increased hemodynamic load is placed on the proximal aorta due to the BAV, which leads to the eventual dilation of the aortic wall. The article highlights abnormal blood flow as a future area of research along with WSS using 4D-flow imaging. Furthermore, another study from the same group explores the clinical application of 4D-flow imaging in BAV [14]. This study builds upon the intrinsic wall or abnormal blood flow pattern theory of the aortic dilation eventually seen in BAV patients. This article argues that different disease progress happens in BAV patients based on how the two leaflets of the aortic valve are fused or what BAV phenotype the patient has. As a result, it cannot be explained by just intrinsic features of the aortic wall becoming dilated, and additional flow parameters should be at play. This work points to increased hemodynamic stress being linked to smooth muscle cell apoptosis. This article does provide more power than previous studies by being a randomized control trial and having a higher sample size, which provides more validity to the reported results and findings that agree with previous studies [15]. In addition, BAV patients with eccentric systolic blood flow patterns that are off center and towards the wall of the aorta were statistically significantly increased in terms of their WSS values compared to BAV patients with normal or mild eccentric flow patterns. Figure 3 illustrates the impact of eccentric systolic blood flow on WSS in RL and RN BAV types.
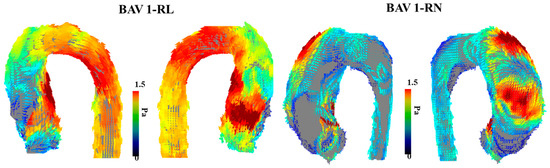
Figure 3. Examples of wall shear stress in bicuspid aortic valve type 1 phenotype. The (left) panel illustrates the vectorial wall shear stress (WSS) representation of a bicuspid aortic valve (BAV) patient with type 1 right–left leaflet fusion. The (right) panel illustrates the vectorial WSS representation in a patient with type 1 right non-coronary fusion. The affected region within the aorta is closely related to the eccentric systolic blood flow jet produced by each valve phenotype.
The reported findings support a flow-mediated process for patients with BAV aneurysms; however, it does outline the evidence for abnormal wall properties. This article supports a dual theory where the wall of the aorta and flow dynamics both play an important role in dilating the aorta in patients with BAV to predispose them to an aortic aneurysm.
Previous research suggests that WSS derived from 4D-flow correlates with aortic elastic fiber thinning in BAV [16]. BAV patients have abnormal WSS values proximal in the aorta compared to patients with normal, tricuspid aortic valves. The increased WSS, when measured non-invasively via 4D-flow MRI, provides more evidence that flow hemodynamics play a role in aortic dilation in these patients as opposed to just an intrinsic feature of the aortic wall. One area of concern in this study was that 96% of the BAV patients also had aortic stenosis and/or aortic regurgitation, which could be a concurrent pathology for the WSS hemodynamic-mediated aortic thinning. The correlation of WSS measures with aortic pathology provides a different insight into abnormal blood flow’s role on BAV and further validates WSS as a clinical marker in relation to aortic thickness. The article highlights that the results might not be sensitive enough to discern between a moderate and a significantly dilated aorta.
Meierhofer et al. [17] provide a strong prospective study design that outlines how significant flow parameters differ in patients with BAV and those with tricuspid valves. One of the strengths of the article is the strict inclusion criteria—this provides a strong foundation for reducing confounders and ensuring accurate patient population representation. The reduction of confounders did not seem to be as apparent of a priority in previous studies on 4D-flow imaging in BAV patients. The article argues that WSS and flow patterns can risk stratifying patients with BAV to have an aneurysm as opposed to an aortic diameter. This is in line with the risk stratification performed by Hope et al. [14]. With elevated WSS in healthy BAV patients with normal aortic diameters, this article does provide an additional way to identify the patients most likely to develop an aneurysm.
A unique approach to utilizing WSS for patients with BAV was presented by van Ooij et al. [18]. As opposed to only quantifying WSS, the goal of this article was to develop individualized ‘heat maps’ that would map abnormal WSS values in an easy-to-read format. The control group provided the normal values of the WSS and if areas of the aorta in a patient with BAV fell outside (mean + 1.96·SD), they were highlighted in red, Figure 4. These maps were also correlated with aortic geometry to account for variations. Most aorta showcased abnormal WSS values in the greater curvature of the ascending aorta. One important finding in this article was that there was no significant correlation between the abnormal WSS surface percentages and other cardiac markers (cardiac output, heart rate, or body surface area). This indicates that abnormal WSS may be an independent marker from standard-of-care imaging cardiac metrics. These correlations could be outside the scope of certain articles or not provide additional value in the setting of BAV patients; however, understanding how 4D-flow measures compared to basic cardiac findings could prove useful.
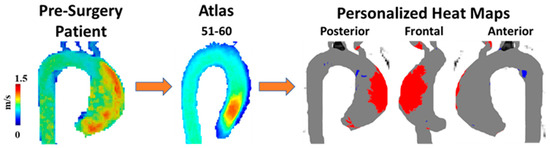
Figure 4. Example of wall shear stress heat map. A 60-year-old man with a bicuspid aortic valve (BAV) was scanned prior to surgery using 4D-flow MRI. Patient’s velocity field was matched by age and biological sex to a velocity atlas allowing to identify abnormal regions of wall shear stress using heat maps. Red in heat maps represents high wall shear stress, blue represents low wall shear stress.
Although much of the previous research has focused on adults and age-matched controls for BAV disease, Rose et al. [19] examine this area in pediatric and young adult populations. Although BAV can be asymptomatic within patients’ childhood and adolescent life stage, they are at risk of complications discussed before, such as aortic dilation or aortic aneurysm. The main goal of this article is to examine these hemodynamic values in BAV patients using 4D-flow imaging and understand if they change over time in a pediatric and younger population. The results showcase that no significant change in WSS and peak velocity occurred over a mean follow-up time of 1.8 ± 1.0 years. There were no significant correlations between WSS and aortic diameter, a contrast to previous studies but in line with Hope et al. [20]. Although there have been discrepancies in the literature regarding WSS and aortic dilation in adult patients, most articles indicate a correlation. Rose et al. [19], however, do not describe this correlation in pediatric and younger patients. This could be attributed to the small follow-up time and how WSS and its effect on the aortic wall could need much more time to occur. A key finding in younger patients with BAV is the stable hemodynamic parameters (WSS and peak velocity) despite increased ascending aortic growth (i.e., diameter increment over time, typically assessed on a one-year basis). These findings, however, need to be taken into the context of the limitations of this study. The small follow-up time is a significant limitation of this study as hemodynamic changes could take a much longer time to create any clinical effect. Although this study has a smaller sample size, the power calculations indicate they should be able to detect clinically significant results in velocity and WSS.
Burris and Hope [15] agreed with Borger and David’s [12] analysis by reflecting on whether abnormal blood flow or the aortic wall characteristics causes the aortic consequences of BAV, and they agreed that it is debated in the literature. This work mainly discussed WSS and flow displacement, as shown in Figure 5. WSS estimates the frictional force applied onto the endothelium from flow viscosity, with higher WSS values indicating remodeling of the endothelium vasculature. Burris and Hope [15] outline how flow displacement can also distinguish between the types of BAV and go further to contrast previous studies to mention how flow displacement can be measured using current 2D PC-MRI. This provides a different perspective from previous articles that have not mentioned obtaining this parameter with 2D PC-MR imaging. Aside from flow displacement, a key theme throughout this article is that these parameters could become clinically relevant in the future. As 4D cardiac MRI is researched further and larger datasets are collected, we will understand the clinical relevance of this imaging technique.
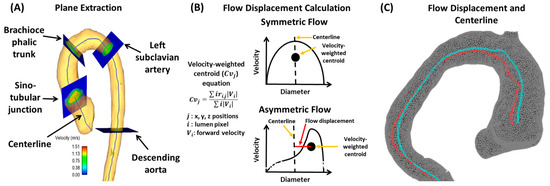
Figure 5. Example of flow displacement calculation. Panel (A) shows the plane analysis extraction from a centerline. Multiple equidistant planes are automatically generated for analysis. Landmark planes help to characterize the aorta in a reproducible manner. Panel (B) illustrates the calculation performed on each plane to obtain flow displacement. Panel (C) shows an example of flow displacement (red line) and centerline (blue line) in a bicuspid valve patient with aortic dilation.
4. Clinical Applications in Aortic Stenosis (AS)
Aortic stenosis (AS) refers to the narrowing of the aortic valve, often due to calcification or other causes, which restricts blood from entering the aorta [5]. Patients can be stratified into mild, moderate, or severe based on their symptoms, ejection fractions, and transthoracic echocardiography (TTE) findings. This section aims to analyze articles that have examined AS and 4D-flow imaging.
Barker et al. [21] outline an initial approach to examining abnormal blood flow and energy loss using 4D-flow imaging. They examined laminar flow energy loss from different aortic pathologies, including AS to provide in vivo results. The researchers had two patient groups (dilated ascending aortas and those with AS with dilation), which were picked because of their association with abnormal blood flow. The article outlines how viscous energy loss measured by 4D-flow imaging could become a useful parameter in the future as it produces one value if one segment needs to be examined (EL′). This could be useful to clinicians as one value provides the opportunity to discuss between patients, risk stratification, and use in clinical research projects later on. Since this article positions itself as a pilot study, it does provide a basis for future research studies to be conducted on how 4D-flow imaging can be useful in defining AS patients, their disease management, and their disease outcomes. An example of energy loss is shown in Figure 6.
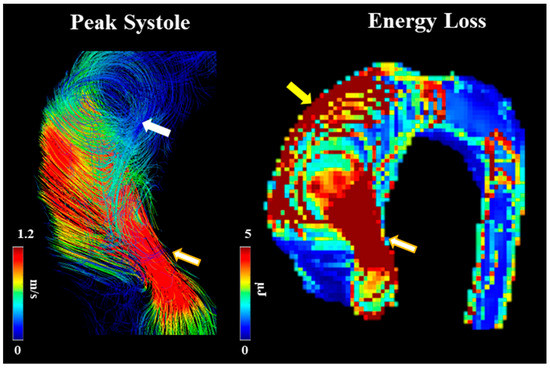
Figure 6. Example of energy loss in a subject with bicuspid valve and moderate aortic stenosis. White arrow points to helical flow. Yellow arrow points to energy loss at the aortic wall. Golden-white arrows point to transvalvular energy loss.
Few studies have simultaneously assessed AS severity using 4D-flow imaging and transthoracic echocardiography (TTE). Binter et al. [5] examine AS severity using TTE and 4D-flow imaging to examine if additional turbulence parameters provide clinical benefit. One key finding was that TKE was found to be significantly higher in AS patients but did not correlate to any TTE parameters. The results indicate that TKE could provide supplementary information to TTE to help stratify patients based on the severity of AS. TKE could be used as a measure of exercise-induced symptoms but is not an option for certain patients to help place their AS into mild, moderate, or severe categories. The article provides appropriate future directions for the research of 4D-flow imaging and AS by highlighting how TKE could be correlated with certain laboratory values that predict outcomes in patients. Understanding the clinical use of TKE as a potential predictor of mortality could provide the basis for 4D-flow imaging to become more involved in the diagnosis and management of AS, similar to BAV. If TKE could be used to stratify AS patients without relying on symptoms, which are often subjective, 4D-flow imaging could provide useful clinical information. One area the article could have focused on more was the outcome of AS, such as dilation or LV hypertrophy, and how TKE values change with respect to these downstream complications. This approach would have required longer follow-up time and ensuring patients enrolled did not already have these complications and/or are minimized during inclusion criteria.
References
- Markl, M.; Frydrychowicz, A.; Kozerke, S.; Hope, M.; Wieben, O. 4D flow MRI. J. Magn. Reson. Imaging 2012, 36, 1015–1036.
- Dyverfeldt, P.; Sigfridsson, A.; Kvitting, J.P.E.; Ebbers, T. Quantification of intravoxel velocity standard deviation and turbulence intensity by generalizing phase-contrast MRI. Magn. Reson. Med. 2006, 56, 850–858.
- Dillinger, H.; McGrath, C.; Guenthner, C.; Kozerke, S. Fundamentals of turbulent flow spectrum imaging. Magn. Reson. Med. 2022, 87, 1231–1249.
- Dyverfeldt, P.; Bissell, M.; Barker, A.J.; Bolger, A.F.; Carlhäll, C.J.; Ebbers, T.; Francios, C.J.; Frydrychowicz, A.; Geiger, J.; Giese, D.; et al. 4D flow cardiovascular magnetic resonance consensus statement. J. Cardiovasc. Magn. Reson. 2015, 17, 72.
- Binter, C.; Gotschy, A.; Sündermann, S.H.; Frank, M.; Tanner, F.C.; Lüscher, T.F.; Manka, R.; Kozerke, S. Turbulent Kinetic Energy Assessed by Multipoint 4-Dimensional Flow Magnetic Resonance Imaging Provides Additional Information Relative to Echocardiography for the Determination of Aortic Stenosis Severity. Circ. Cardiovasc. Imaging 2017, 10, e005486.
- Dyverfeldt, P.; Hope, M.D.; Tseng, E.E.; Saloner, D. Magnetic resonance measurement of turbulent kinetic energy for the estimation of irreversible pressure loss in aortic stenosis. JACC Cardiovasc. Imaging 2013, 6, 64–71.
- Dyverfeldt, P.; Kvitting, J.P.E.; Sigfridsson, A.; Engvall, J.; Bolger, A.F.; Ebbers, T. Assessment of fluctuating velocities in disturbed cardiovascular blood flow: In vivo feasibility of generalized phase-contrast MRI. J. Magn. Reson. Imaging 2008, 28, 655–663.
- Jamalidinan, F.; Hassanabad, A.F.; François, C.J.; Garcia, J. Four-dimensional-flow Magnetic Resonance Imaging of the Aortic Valve and Thoracic Aorta. Radiol. Clin. N. Am. 2020, 58, 753–763.
- Zhuang, B.; Sirajuddin, A.; Zhao, S.; Lu, M. The role of 4D flow MRI for clinical applications in cardiovascular disease: Current status and future perspectives. Quant. Imaging Med. Surg. 2021, 11, 4193–4210.
- Rees, S.; Somerville, J.; Ward, C.; Martinez, J.; Mohiaddin, R.H.; Underwood, R.; Longmore, D.B. Coarctation of the aorta: MR imaging in late postoperative assessment. Radiology 1989, 173, 499–502.
- Robicsek, F.; Thubrikar, M.J.; Cook, J.W.; Fowler, B. The congenitally bicuspid aortic valve: How does it function? Why does it fail? Ann. Thorac. Surg. 2004, 77, 177–185.
- Borger, M.A.; David, T.E. Management of the Valve and Ascending Aorta in Adults with Bicuspid Aortic Valve Disease. Semin. Thorac. Cardiovasc. Surg. 2005, 17, 143–147.
- Hope, M.D.; Meadows, A.K.; Hope, T.a.; Ordovas, K.G.; Reddy, G.P.; Alley, M.T.; Higgins, C.B. Images in cardiovascular medicine. Evaluation of bicuspid aortic valve and aortic coarctation with 4D flow magnetic resonance imaging. Circulation 2008, 117, 2818–2819.
- Hope, M.D.; Hope, T.A.; Crook, S.E.; Ordovas, K.G.; Urbania, T.H.; Alley, M.T.; Higgins, C.B. 4D flow CMR in assessment of valve-related ascending aortic disease. JACC Cardiovasc. Imaging 2011, 4, 781–787.
- Burris, N.S.; Hope, M.D. 4D Flow MRI Applications for Aortic Disease. Magn. Reson. Imaging Clin. N. Am. 2015, 23, 15–23.
- Bollache, E.; Guzzardi, D.G.; Sattari, S.; Olsen, K.E.; Di Martino, E.S.; Malaisrie, S.C.; van Ooij, P.; Collins, J.; Carr, J.; McCarthy, P.M.; et al. Aortic valve-mediated wall shear stress is heterogeneous and predicts regional aortic elastic fiber thinning in bicuspid aortic valve-associated aortopathy. J. Thorac. Cardiovasc. Surg. 2018, 156, 2112–2120.e2.
- Meierhofer, C.; Schneider, E.P.; Lyko, C.; Hutter, A.; Martinoff, S.; Markl, M.; Hager, A.; Hess, J.; Stern, H.; Fratz, S. Wall shear stress and flow patterns in the ascending aorta in patients with bicuspid aortic valves differ significantly from tricuspid aortic valves: A prospective study. Eur. Heart J. Cardiovasc. Imaging 2013, 14, 797–804.
- van Ooij, P.; Potters, W.V.; Collins, J.; Carr, M.; Carr, J.; Malaisrie, S.C.; Fedak, P.; McCarthy, P.M.; Markl, M.; Barker, A. Characterization of Abnormal Wall Shear Stress Using 4D Flow MRI in Human Bicuspid Aortopathy. Ann. Biomed. Eng. 2014, 43, 1385–1397.
- Rose, M.J.; Rigsby, C.K.; Berhane, H.; Bollache, E.; Jarvis, K.; Barker, A.J.; Schnell, S.; Allen, B.D.; Robinson, J.D.; Markl, M. 4-D flow MRI aortic 3-D hemodynamics and wall shear stress remain stable over short-term follow-up in pediatric and young adult patients with bicuspid aortic valve. Pediatr. Radiol. 2019, 49, 57–67.
- Hope, M.D.; Sigovan, M.; Wrenn, S.J.; Saloner, D.; Dyverfeldt, P. MRI hemodynamic markers of progressive bicuspid aortic valve-related aortic disease. J. Magn. Reson. Imaging 2014, 40, 140–145.
- Barker, A.J.; van Ooij, P.; Bandi, K.; Garcia, J.; Albaghdadi, M.; McCarthy, P.; Bonow, R.O.; Carr, J.; Collins, J.; Malaisrie, S.C.; et al. Viscous energy loss in the presence of abnormal aortic flow. Magn. Reson. Med. 2014, 72, 620–628.
More
Information
Subjects:
Cardiac & Cardiovascular Systems
Contributors
MDPI registered users' name will be linked to their SciProfiles pages. To register with us, please refer to https://encyclopedia.pub/register
:
View Times:
704
Revisions:
2 times
(View History)
Update Date:
21 Jun 2023
Table of Contents


Notice
You are not a member of the advisory board for this topic. If you want to update advisory board member profile, please contact office@encyclopedia.pub.
OK
Confirm
Only members of the Encyclopedia advisory board for this topic are allowed to note entries. Would you like to become an advisory board member of the Encyclopedia?
Yes
No
${ textCharacter }/${ maxCharacter }
Submit
Cancel
Back
Comments
${ item }
|
${ item.createdUser.fullName }
${ item.createdAt }
${ item.vote }
${ item.reply }
Delete
${ reply.createdUser.fullName }
${ reply.createdAt }
${ reply.vote }
Delete
There is no reply to this comment~
${ item.replyTextCharacter }/${ item.replyMaxCharacter }
Submit
Cancel
More
No more~
There is no comment~
${ textCharacter }/${ maxCharacter }
Submit
Cancel
${ selectedItem.replyTextCharacter }/${ selectedItem.replyMaxCharacter }
Submit
Cancel
Confirm
Are you sure to Delete?
Yes
No