Your browser does not fully support modern features. Please upgrade for a smoother experience.
Submitted Successfully!
 +1 credit
Thank you for your contribution! You can also upload a video entry or images related to this topic.
For video creation, please contact our Academic Video Service.
| Version | Summary | Created by | Modification | Content Size | Created at | Operation |
|---|---|---|---|---|---|---|
| 1 | Ronny Berndtsson | -- | 5985 | 2023-05-31 11:54:26 | | | |
| 2 | Camila Xu | Meta information modification | 5985 | 2023-06-01 07:41:13 | | | | |
| 3 | Camila Xu | Meta information modification | 5985 | 2023-06-02 08:56:00 | | | | |
| 4 | Camila Xu | Meta information modification | 5985 | 2023-06-02 08:57:33 | | | | |
| 5 | Camila Xu | Meta information modification | 5985 | 2023-06-02 09:00:27 | | |
Video Upload Options
We provide professional Academic Video Service to translate complex research into visually appealing presentations. Would you like to try it?
Cite
If you have any further questions, please contact Encyclopedia Editorial Office.
Abdiyev, K.; Azat, S.; Kuldeyev, E.; Ybyraiymkul, D.; Kabdrakhmanova, S.; Berndtsson, R.; Khalkhabai, B.; Kabdrakhmanova, A.; Sultakhan, S. Slow Sand Filtration for Raw Water Treatment. Encyclopedia. Available online: https://encyclopedia.pub/entry/45048 (accessed on 13 July 2026).
Abdiyev K, Azat S, Kuldeyev E, Ybyraiymkul D, Kabdrakhmanova S, Berndtsson R, et al. Slow Sand Filtration for Raw Water Treatment. Encyclopedia. Available at: https://encyclopedia.pub/entry/45048. Accessed July 13, 2026.
Abdiyev, Kaldibek, Seitkhan Azat, Erzhan Kuldeyev, Darkhan Ybyraiymkul, Sana Kabdrakhmanova, Ronny Berndtsson, Bostandyk Khalkhabai, Ainur Kabdrakhmanova, Shynggyskhan Sultakhan. "Slow Sand Filtration for Raw Water Treatment" Encyclopedia, https://encyclopedia.pub/entry/45048 (accessed July 13, 2026).
Abdiyev, K., Azat, S., Kuldeyev, E., Ybyraiymkul, D., Kabdrakhmanova, S., Berndtsson, R., Khalkhabai, B., Kabdrakhmanova, A., & Sultakhan, S. (2023, May 31). Slow Sand Filtration for Raw Water Treatment. In Encyclopedia. https://encyclopedia.pub/entry/45048
Abdiyev, Kaldibek, et al. "Slow Sand Filtration for Raw Water Treatment." Encyclopedia. Web. 31 May, 2023.
Copy Citation
Filtration methods are traditional techniques of water purification used by mankind since ancient times. By filtering, water can be cleaned of sand, silt, turbidity, scale, and other suspended particles. Modern slow sand filters (SSFs) for water purification were first used in the 19th century in England. Therefore, they are often called English filters. The first slow filter was built by the English engineer James Simpson in 1829 in London to purify water from the river Thames.
slow sand filtration
developing countries
microbes
1. History
Filtration methods are traditional techniques of water purification used by mankind since ancient times. By filtering, water can be cleaned of sand, silt, turbidity, scale, and other suspended particles. According to [1], people have used sand and gravel filters as early as 2000 BC in ancient India. In ancient times, the Romans built canals near lakes to take advantage of natural filtration through the canal walls.
Modern slow sand filters (SSFs) for water purification were first used in the 19th century in England. Therefore, they are often called English filters. The first slow filter was built by the English engineer James Simpson in 1829 in London to purify water from the river Thames [2][3]. However, various designs of sand filters were used for water purification in earlier years in several Scottish cities: Paisley (1804), Glasgow (1807), and Greenock (1827) [4][5]. In Berlin, slow filters were built in 1853, in Warsaw in 1880, and in Moscow in 1902 [6]. In the United States, the first SSFs were built in 1872 at Poughkeepsie, New York [7][8], which operated until 1959 [9]. Thus, slow filtration of water has been an effective way to prevent the spread of various gastrointestinal diseases through drinking water for over 150 years [10][11]. In 1855, John Snow, in his essay “On the Means of Transmitting Cholera”, suggested a correlation between the spread of the cholera epidemic and the quality of the water supply in Soho [12].
According to Wegelin [13], “no other simple purification process can improve the physical, chemical, and bacteriological quality of surface waters better than SSF.” In 19th century Europe, SSF of water was recommended as one of the effective ways to prevent the spread of an infectious disease, the cholera epidemic [14]. SSFs can eliminate 90–99% of bacteria and viruses, remove 93.3% of fecal coliforms, and completely remove Giardia lamblia cysts and Cryptosporidium oocysts [15]. In view of its efficiency for basic raw water treatment and low-cost characteristics, it is noteworthy that only about half a million people in developing countries use SSFs to obtain a basic quality of drinking water [10][16]. Obviously, SSF has a much larger role to play in this regard to help reach the UN Sustainable Development Goals.
2. SSF Requirements
A distinction can be made between rapid sand filtration and SSF of water [17][18][19]. SSFs have an effective particle size diameter of 0.15–0.35 mm and a uniformity factor of 1.5–3.0. The effective particle size for trapping in fast filters is greater than 0.55 mm, with a uniformity factor of less than 1.5. The water filtration rate in fast filters varies between 4 and 21 m/h (100–475 m3 × m−2 × day−1) [20] and in SSF varies from 0.1 to 0.4 m/h (1–8 m3 × m−2 × day−1) [21]. The difference between these two methods is not only in the filtration rate but most importantly in the technology of water purification. Table 1 provides a list of particles frequently present in raw water [22]. Table 1 can represent a typical surface water source in a developing country affected by untreated wastewater since the contents include various kinds of microbial pollutants.
Table 1. Examples of elements found in raw water [22].
| Category | Group/Name | Size (μm) |
|---|---|---|
| Mineral | Clays (colloidal) | 0.001–1 |
| Silicates | No data | |
| Non-Silicates | No data | |
| Biological | Viruses | 0.001–0.1 |
| Bacteria | 0.3–10 | |
| Algae, unicellular | 30–50 | |
| Giardia cysts | 10 | |
| Parasite eggs | 10–50 | |
| Nematode eggs | 10 | |
| Cryptosporidium oocysts | 4–5 | |
| Other particles | Amorphous debris, small | 1–5 |
| Organic colloids | No data |
SSF refers to biological water treatment methods, although filtering also refers to a mechanical and chemical (inertial collision and attachment, diffusion, adsorption, and sedimentation) separation of dispersed particles [22]. Fast sand filtration is a purely mechanical method of water treatment. Fast sand filters remove mainly relatively large, suspended particles. Fast sand filters can be either operated by gravity or pressure. SSF is an effective way to remove microbial contaminants and bacteria as well [23][24]. Particles are mainly removed in the upper part of the sand layer (schmutzdecke layer—German for “dirt layer”) [25]. Nonpathogenic aerobic microorganisms deposited on the surface of the sand filter can metabolize organic matter that enters the filter with the incoming water. These microorganisms can prey on bacteria and viruses present in the water [26].
The biological treatment functioning of the SSF is especially important in developing countries where wastewater and greywater usually are discharged without prior treatment. However, most surface water microbial quality studies have been performed for developed countries and temperate climates [27]. Thus, the dynamic distribution of pathogens is poorly quantified for developing countries. Usually, the same indicator organisms (commonly fecal coliform, E. coli and Enterococci) are used in both developed and developing countries. However, the indicator organisms for, e.g., temperate regions, may not be completely relevant for tropical regions. In warmer climates, the foremost waterborne pathogens can be V. cholerae, Salmonella, Shigella, C. perfringens, cyanobacteria, Entamoeba, rotavirus, and Giardia [27][28].
SSFs represent many advantages over other water treatment methods. They do not require chemical reagents and qualified specialists, are easy to operate, and have minimal maintenance and manpower requirements, low capital and operating costs, and low energy requirements [29][30][31]. For this reason, SSF has found widespread use in rural areas to provide good-quality drinking water [32]. However, there are some limitations, e.g., SSF is not recommended for water treatment with turbidity greater than five nephelometric turbidity units (NTU), because high turbidity can lead to filter clogging and thereby shorten the life of the filter [33]. Apart from turbidity, for successful application of SSF treatment, chlorophyll content in feed water must be <0.05 μg/L; iron and manganese must not exceed 0.3 and 0.05 mg/L, respectively. The quantity of dissolved heavy metals, pesticides, and colorants must be minimal, and the presence of residual oxidant before filtration is not desired [33]. At the same time, SSFs are better at purifying water contaminated with non-clayey impurities [34].
In Saskatchewan, Canada [35], a modular SSF polyethylene system was developed and tested that incorporated pre-treatment and post-treatment processes such as ozone oxidation, pre-treatment, and biological activated carbon (BAC) filters to provide significant reduction in turbidity, heavy metals, color, and organics. In the initial period, the filtration efficiency without the schmutzdecke layer may not be more than 60% [11]. Several studies [36][37] summarize work on the modification of SSFs, which help to eliminate the limitations of the application of this method.
Currently, for the preparation of potable water in many cases, chemical methods of treatment are used. However, the use of reagent methods at small treatment plants may create problems associated with the lack of qualified specialists and with the high cost of equipment and chemical reagents used for water treatment. These facts lead to the conclusion that reagent-free water treatment methods often are better-suited for rural areas in developing countries.
3. SSF Biological Processes
There are two important mechanisms regarding the filtration of particles and microorganisms through a slow sand layer: the transport mechanism and the attachment mechanism [37]. According to the transport mechanism, particles in water that are larger than the pore diameter of the sand layer cannot pass through the filter and are retained on the surface of the sand layer. Larger particles are mainly retained by the transport mechanism. However, as the particles settle and the biofilm schmutzdecke “matures” on the surface of the sand layer, the pore diameter of the sand filter gradually decreases. Because of this, particles and microorganisms much smaller than the pore diameter of the sand bed can be retained on the surface of the sand bed [38]. The particles (microorganisms) present in the water adhere to the sand layer surface through Van der Waals or electrostatic forces of attraction [39][40]. In this case, the formation of chemical (e.g., hydrogen) bonds between particles and solid surface cannot be excluded as well [41][42]. Bacteria (size 0.01–10 µm) [43], viruses (0.01–0.1 µm) [44][45], and colloidal particles (0.001–1 µm) [39] are mainly retained by this mechanism.
4. General Design of SSF
Traditional slow filters are usually tanks up to 6 m wide, up to 60 m long, and consisting of four layers (Figure 1) [26]. Drainage is placed on the bottom of the tank. Hollow pipes, bricks, or concrete slabs with gaps are usually used as drainage [37][42]. A supporting layer (approximate thickness of 0.5 m) of gravel, pebbles, or crushed stone is placed on the surface of the drainage. The particle size of the supporting layer can vary from 2 to 30 mm. Above the supporting layer, a filtering layer of sand (thickness 450–1250 mm) is placed with a developed surface and high porosity. The sand particle size can vary from 0.2 to 2 mm [46][47]. On the surface of the filtration layer, the supernatant water is located. The supernatant layer must provide the necessary head to filter water through the porous sand layer [48]. The flow rate can be regulated by changing the difference between the head of the supernatant water and the height at which the discharge pipe is open to the atmosphere.
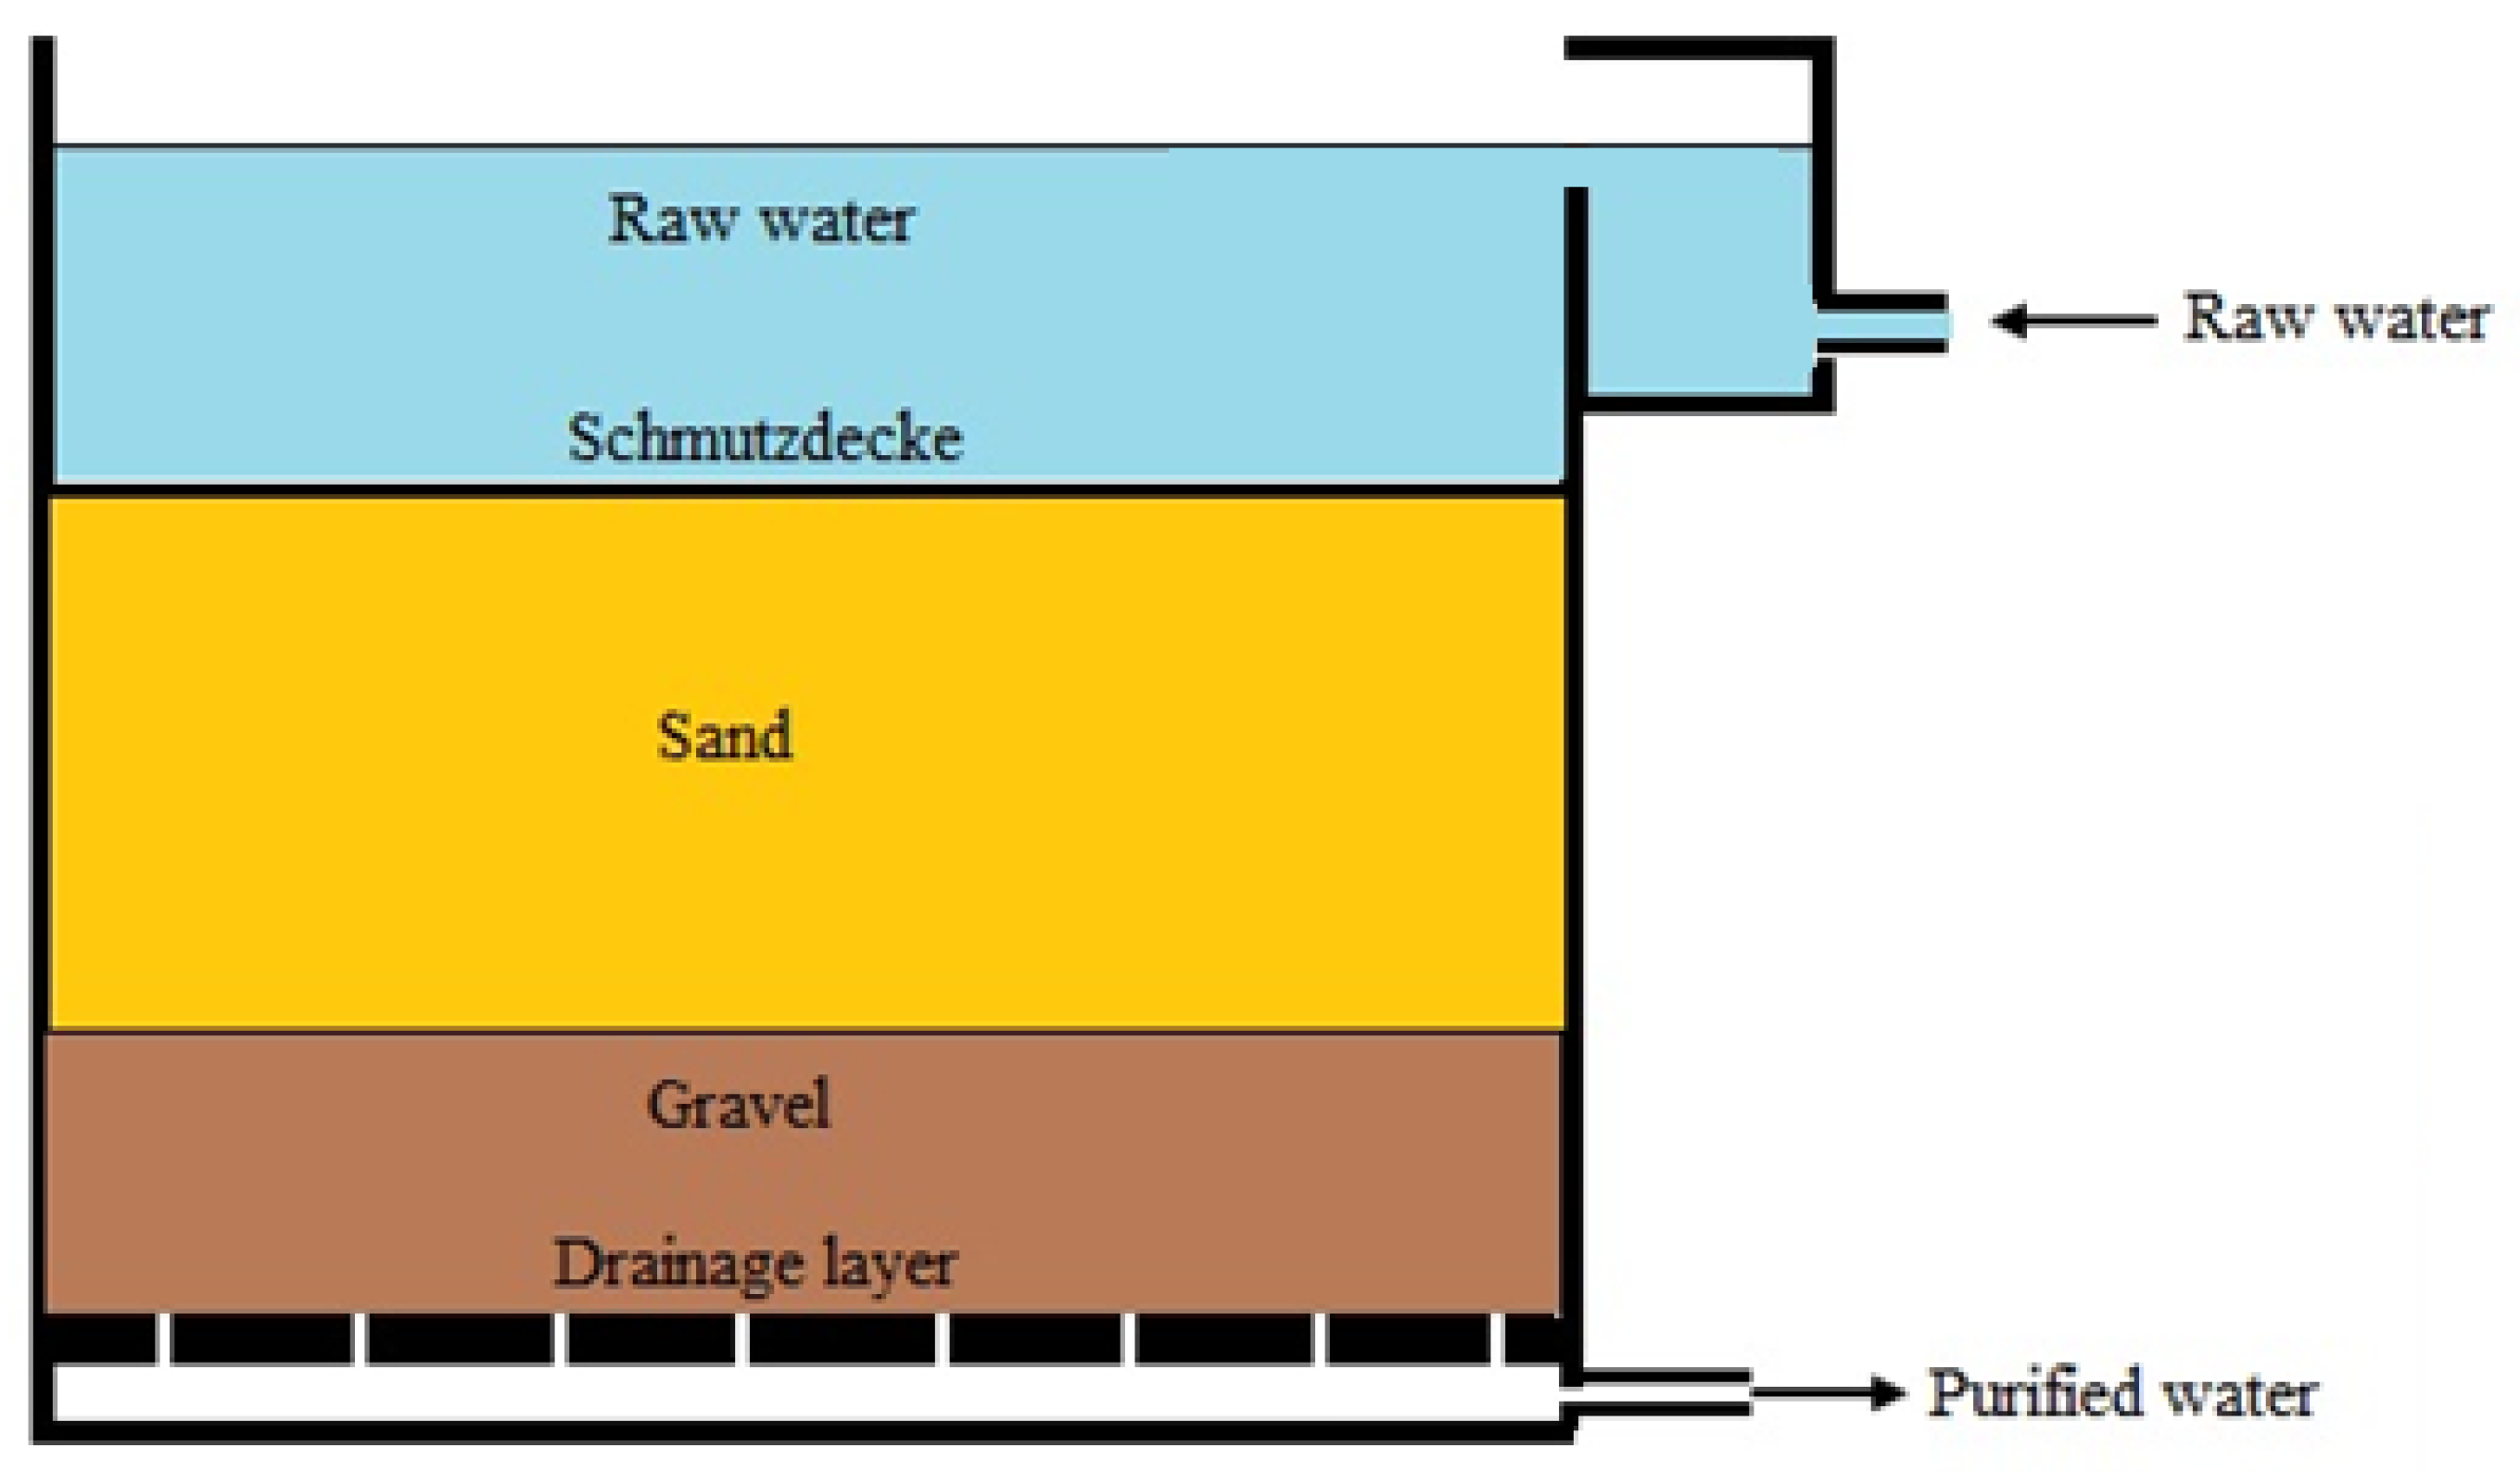
Figure 1. Schematic of a general SSF design (adapted from Wikimedia Commons).
It is regarded that a sand layer thickness of 0.3 m is sufficient for the proper removal of turbidity and coliform bacteria and a thickness of 0.6 m for the significant removal of virus from the water composition [42]. Changing the thickness of the sand layer affects the removal rates of bacteria and viruses. For example, a decrease in sand layer thickness from 0.6 m to 0.3 m resulted in a 0.04% decrease in poliovirus removal (from 99.98% to 99.94%) [26][49] and a 2% decrease in coliform removal (from 97% to 95%) observed when filter layer thickness was reduced from 0.97 m to 0.48 m [22][50].
Depending on the weather conditions, the slow-filter tank can be located outdoors or indoors. During the cold winter period, it is recommended to conduct the filtration process indoors, especially at subzero temperatures when the filter may not work at all. Over time, as the biofilm thickens, the SSFs gradually lose their efficiency and the flow rate through the filter decreases. In this case, it is necessary to rebuild the filter. As a rule, the duration of an SSF is from 30 to 60 days, but sometimes it can reach more than 100 days [37][42]. This depends on the water flow and pollutant load. Water containing algae is known to clog up SSF in short periods of time. This may be a specific problem in developing countries with surface water containing nutrients.
5. SSF Regeneration
There are two main methods of filter layer regeneration: (1) removal of the upper contaminated layer of sand and (2) washing of the contaminated sand surface layer directly in the filter by mechanical or hydraulic loosening and removal of contaminants by a stream of clean water (wet harrowing) [51][52]. In the first method, the top layer of sand is periodically (2–3 times a month) removed and washed several times with clean water. After that, the cleaned sand is loaded back into the tank. After cleaning the filter, it takes some time for the filter to regain its full treatment capacity. Depending on which of the above methods are used, it is expected that this time is several weeks to about a month depending on the external environment [26].
6. SSF Speed Mode
The slow filtration rate depends on the suspended solids content of the raw water. At a particle concentration of not more than 25 mg/L, the filtration speed is 0.08–0.4 m/h [51], and at a particle concentration exceeding 25 mg/L, the filtration speed varies from 0.1 to 0.2 m/h.
Contaminated water in slow filters is purified with the help of the biological schmutzdecke film or hypogeal layer that forms on the surface of the filtering sand layer of algae, bacteria, and settled contaminant particles [22][38][53][54][55][56][57]. The duration of filter maturation significantly affects the rate and degree of removal of microbial and organic contaminants by the filter [16][49]. An effective biological film forms during the first 10–40 days of the SSF process of water [16][58][59][60] as mentioned above and provides detention of up to 90–98% of highly dispersed solids, bacteria [51], reduction in fecal coliform bacteria, turbidity per log10 [57], and reduction in total coliforms and turbidity to 97% [61]. A low filtration rate is necessary for complete biological processes in the filter [62][63].
SSF can remove pathogenic microorganisms, suspended organic and inorganic contaminants [46][64], turbidity [64], bacteria, viruses, and enteroparasite cysts [49][64][65]. Meanwhile, the main biological mechanisms responsible for the removal of bacteria in slow sand filters are predation by algae, eating detritus by aquatic worms, natural mortality, inactivation, metabolic breakdown, and adsorption on the sticky zoogleal surface of the sand [55][63][64][65][66].
The sorption capacity of the schmutzdecke layer is estimated through the sorption coefficient (Kd), which is calculated using [67]:
where Cs is the milligram of sorbed antimicrobial per kilogram of solid, mg/kg; Ce is the aqueous antimicrobial concentration mg/L after 24 h equilibration. Sorption coefficients are normalized to the share of organic carbon (Koc = Kd/foc) and organic matter (Kom = Kd/fom) where foc and fom are the mass fraction of organic carbon and organic matter in the schmutzdecke layer, respectively.
7. Influence of Filter Media and Hydraulic Residence Time
The size and homogeneity of sand particles essentially influence the efficiency of water purification with an SSF [4]. The homogeneity of the particles is determined by the homogeneity coefficient. The homogeneity coefficient of sand is defined as the ratio: coarseness at which 60% (by weight) of the sand sample passes through the sieve divided by the coarseness at which 10% of the same sample (by weight) passes through the sieve, i.e., K60/10 = d60/d10. A uniformity factor of one means that all particles are the same size. As the uniformity of the sand particles increases, the filtration efficiency increases. If the sand particles vary greatly in size, the smaller sand particles will fill the gaps between the larger particles, resulting in filter clogging [68]. The most effective sand particle size for slow filtration is 0.15–0.35 mm and a uniformity factor of less than two [69].
The thickness of the sand layer has a significant influence on the degree of removal of contaminants from the water composition by the method of SSF. It is generally assumed that the thicker the sand layer, the greater the retention of fine and colloidal particles and viruses and the better the discoloration of water. According to [70], a sand layer 200 mm thick removes 99.5% of fecal bacteria. The minimum thickness of the sand layer to remove turbidity and coliform bacteria is 300 mm, while 600 mm sand thickness is sufficient to remove all viruses [42].
According to [26], the key design parameter of SSF controlling water quality is the filter’s hydraulic residence time (HRT). HRT is determined by:
where Q is the water volume flow rate, m3/h; V is the total sand volume, m3; and n is the sand porosity. The porosity of sand usually ranges from 0.35 to 0.50. This means that 35 to 50% of the volume of the active filter is water in contact with microorganisms attached to the sand grains. Reducing the sand particle size increases the water–sand contact surface area and the porosity of the material. On the other hand, a wide range of particle sizes reduces the porosity of the sand layer, which leads to lower HRT. Therefore, the sand must have a sufficiently high homogeneity. According to [26], the use of a sand layer consisting of particles with a size of 0.35–1.5 mm provides a high degree of water purification at HRT from 8 to 12 h.
8. Purification of Water of Ions, Bacteria, and Microbes
SSF can also be used to purify water of ions. However, there are chemical impurities that cannot be effectively removed by SSF alone. These include sulfate (SO42−), nitrate (NO3−), sodium (Na+), calcium (Ca2+), and magnesium (Mg2+) ions and water hardness (as CaCO3) [71][72]. According to [72], biological treatment converts most ammonium ions (NH4+) to nitrate ions (NO3−). In addition, stable colloidal particles are also difficult to remove by SSF [34][35].
In the last two decades, so-called bio-sand filters (BSFs) have become widespread. For example, the company CAWST (Center for Accessible Water Supply and Sanitation Technology) in Calgary, Canada, has developed concrete filters made of bio-sand, which are used in 450 organizations in more than 55 countries [11][36]. Triple Quest of Grand Rapids, USA, offers bio-sand filters: 60 L HydrAid filters made of plastic [26]. Plastic bio-sand filters are relatively cheap and lighter than concrete BSFs [73][74][75]. The authors [26] proposed a modified household plastic filter (BSF). In the new filter design, the gravel layer is replaced by a thin porous plastic plate placed in a plastic bag. This replacement reduces the required filter media and increases the total pore volume in the core. As a result, the cost and labor required to install and maintain the filter is reduced.
A study [76] proposed a household SSF for the removal of As, Fe, and Mn from the composition of groundwater for rural areas in Vietnam. The sand for filtration was collected from the banks of the Red River. It was found that nitrate-reducing, Fe(II)-oxidizing, and Fe(III)-reducing bacteria were present in the dry sand, while microaerophilic Fe(II)-oxidizing bacteria were absent. Mn-oxidizing bacteria were found in the composition of the dry sand. Based on the analysis of the composition of the microbial community, the authors concluded that the abiotic processes of oxidation of Fe(II) prevail over the biotic oxidation of Fe(II) on the filter. Moreover, Mn-oxidizing bacteria played an important role in Mn(II) oxidation and deposition of Mn(III/IV) oxide in a separate layer of the sand filter. The formation of Mn(III/IV) oxides promoted abiotic oxidation of As(III) and immobilization of As(V) by sorption onto (oxy-hydro) oxides of Fe(III). This resulted in a significant reduction in As, Fe, and Mn concentrations in filtered groundwater.
In several studies [77][78][79], the design and principle of operation of a slow self-cleaning filter for natural water deferrization were proposed. A Birm Regular filter was used as a filter load, which simultaneously acts as a catalyst for the reaction of oxidation of Fe2+ by oxygen to Fe3+. Trivalent iron cations are hydrolyzed to Fe(OH)3, and then positively charged colloidal particles of Fe(III) hydroxide are formed [80]. Positively charged colloidal particles of iron (III) hydroxide are adsorbed on the negatively charged surface of the particles of filter media, resulting in the formation of a dense, gel-like adsorption layer on the surface. Such a layer is an effective filtering material. The concentration of Fe(OH)2 varied from 6.0 to 16 mg/L in the model’s natural water (simulant). It was established that the output of the filter to the working mode at Fe3+ concentration in the model solution of 16.0 mg/L was not more than 2.0 h. The analysis of the experimental data obtained for water with an iron concentration of 16.0 mg/L showed that at the first stage of filter operation the Fe3+ concentration in the treated water decreased from 16.0 to 0.9 mg/L after 20 min of filtration, and after 1.5 h it was 0.1 mg/L. The maximum allowable concentration for Fe3+ in drinking water is 0.3 mg/L [81]. According to the authors, the use of the proposed design for the pre-treatment of water contaminated with iron ions will significantly reduce the load on the stage of the final purification of water of iron.
In [82], the possibility of removing cyanobacterial hepatotoxins (microcystins) from the composition of water taken from Berlin lakes using SSFs was studied. Two full-scale experiments were performed: One experiment was performed with dissolved microcystins extracted from a cyanobacterial flower in one of the Berlin lakes. The second experiment was performed with a longer exposure of live cyanobacterial cells (collected from the same lake) to the filter. It was found that the experiment with dissolved microcystins revealed high rates of microcystin elimination (95%) within the sand filter bed and with a half-life for microcystins of about 1 h. In the second experiment, where cell-bound microcystins were used, rather good results (elimination of 85%) were also obtained in the first days after application of cyanobacteria. However, as the temperature decreased to 4 °C, elimination decreased to 60%, which, according to the authors, is associated with a slowing down of bacterial biodegradation at low temperature. Thus, it was concluded that at moderate plus temperatures, slow filtration through sand can serve as an effective method of removing microcystins from drinking water composition.
In [67], the efficiency of removal of water-soluble antimicrobials such as sulfamethazine (SMZ), tylosin (TYL), sulfamethoxazole (SMX), trimethoprim (TRI), and lincomycin (LIN) from water in rural areas by SSF was studied. Basalt sand was used as filtering material. Water-soluble antimicrobials are used in livestock and poultry production to promote growth and prevent bacterial infections. In rural areas, surface water may be contaminated by antimicrobials from wastewater or by diffuse contamination from the application of manure and processed biological solids containing antimicrobial residues to the soil [83][84][85]. Experiments were carried out using coarse (fast) and SSF methods. The coarse filter showed low antimicrobial removal efficiency. SSF showed effectiveness in removing antimicrobials, with the sorption of drugs on the surface of the filter layer changing as follows: TYL > TRI > LIN > SMX > SMZ. At the end of the 14-day period of the SSF study, the following results were obtained: >99% TRI removal, <25% LIN removal, and <4% sulfonamide antimicrobial removal from the contaminated river water.
In [21], slow and fast sand filtration methods were used to remove Triactinomyxon actinospores (Tams) of the salmon parasite Myxobolus cerebralis from contaminated water. Sand with a particle diameter of 0.180 mm was used as the filter material. The sand cushion of the filter was 17.8 cm, and the support gravel was 17.8 cm. Aquarium fish were used as targets of Tams infestation. Tams were introduced into fish-rearing systems over sand filters. The rapid filtration method was tested with two backwashing regimes. In the first, a continuous backwash was performed, and in the second, flow was diverted past the fish tanks for 5 min after backwashing. SSF through a sand filter without backwashing served as a control for the two fast filters. After 60 days, clinical signs of circling behavior and black tails were seen among the positive controls. Polymerase chain reaction (PCR) analysis for Myxobolus cerebralis showed that infections were absent in both fast sand filter water treatments, whereas 1.6% of all fish were infected with the SSF treatment. Based on these results, the authors concluded that both fast and SSFs can be used to remove Tams from the water composition, and the backwash method is important for the reliable functioning of fast sand filters [21].
Studies have indicated different removal mechanisms for bacteria and viruses in SSF. In [86], it was found that most of the E. coli was removed through filtration by the schmutzdecke. Consequently, the residence time in the SSF’s biologically active part had no significant effect on the E. coli removal. On the other hand, most MS-2 viruses were removed through longer residence time and effects in the biologically active layer. The schmutzdecke filtration did not have a significant effect on the MS-2 virus removal. However, ZVI (zero-valent iron as a waste byproduct from the iron industry)-amended filtering removed 100% of both E. coli and MS-2.
9. Temperature Effects
Temperature effects on a variety of pollutants for different SSF designs have not been extensively studied. Table 2 shows a summary of temperature effects on treatment efficiency for SSF. As seen from the table, temperature has significant effects on the treatment efficiency. The references mainly contain results for microbiological constituents.
Table 2. Temperature effects on SSF treatment efficiency.
| Temperature Change | Treatment Efficiency | Reference |
|---|---|---|
| Decrease from 20 °C to <4 °C | Microcystins were eliminated >85%, decreasing to <60% due to slowing down of bacterial biodegradation at low temperature. | [82] |
| Decrease from 21 °C to 5.5 °C | Higher temperature had 2.5 times more efficient microbial removal rates for Bacillus spores and E. coli due to biological respiration. | [87] |
| Decrease from 16–18 °C to 5–8 °C | Virus removal was reduced from an average of 99.997% to 99.68%. Bacteriophages appeared not to be significantly affected. Coliform bacteria removal decreased from >99.5% to 97.6% while E. coli concentration increased from >88.0% to >94.6%. | [49] |
| Decrease from about 20 °C to 0.5 °C | Findings suggested that Cryptosporidium may not be adequately removed from a contaminated source water under very cold operating conditions or if the filtration plant does not comply with accepted design standards. | [88] |
| Decrease from 17 °C to 2 °C | Giardia was not affected, while coliform bacteria increased 100 times. | [50] |
| Decrease from 23–25 °C to 10–14 °C | Removal rates of turbidity, COD, color, and total bacterial counts decreased by 12.5%, 26.5%, 22.9%, and 5.8% (advanced wastewater treatment). | [89] |
| Decrease from 17 °C to 5(2) °C | Removal of Total coliform bacteria decreased from 97% to 87%. Standard plate bacteria increased 100 times. | [64] |
| Decrease from 19.5 °C to 4 °C | Experiments and modeling showed that removal of microorganisms (Bacteriophage, Escherichia coli) is most sensitive to changes in temperature and age of the schmutzdecke. Change in filtration rate had small effect on microorganism removal. | [90] |
| Decrease from 14 °C to 2 °C | Temperature has effect on pH, BOD, COD, and TOC removal by about 50% decrease. | [91] |
| Decrease from 24 °C to 8 °C | E. coli Log removal rate decreased from 2.2–2.5 to 1.6–1.7. | [92] |
However, [91] states clear effects on pH, BOD, COD, and TOC removal as well (50% decrease by temperature decrease from 14 °C to 2 °C). SSF is highly efficient by means of removing enteroviruses from contaminated water [49]. Factors affecting this removal rate in a negative way are temperature, high flow rates, reduced sand depth, and filter immaturity [49]. Variation in removal rates is also stated to be mostly determined by temperature and the age of the schmutzdecke [90]. Change in filtration rate had a small effect on microorganism removal [90]. It has been suggested that for normal temperature, predation of bacteria is the most important of all biological removal mechanisms [56]. Consequently, at normal temperature, adsorption to biomass is the least significant mechanism due to reduced biological activity [93].
10. Modifications to the Filter Media
Different sand particle size distributions and various additions to the sand will affect the HRT and adsorption properties of the SSF. Adding biologically or chemically active amendments to the filter can improve the treatment efficiency. In [94], the effect of modifying a slow sand filter with quartz sand or Anadara granosa shells on the removal efficiency of turbidity, total suspended solids, and iron from the water composition of the Kali Jagir Surabaya River (Indonesia) was investigated. The data were processed using the Design Expert 11 software. The SSF reactor was operating continuously for 6 days. The optimum results were obtained in the SSF reactor plant filled with quartz sand and with a filtration rate of 0.1 m/h. The efficiency of removing turbidity was 82.1%, total suspended solids was 89.5%, and iron was 50.1%.
The possibility of using wood pellets and granulated cork as carbon sources in laboratory biofilters working under water-saturated and water-unsaturated conditions was studied in [95]. The efficiency of biofilters was monitored by determining the reduction in nitrate ions (200 mg/L) and pesticides (mecoprop, diuron, atrazine, and bromacil, each at a concentration of 5 μg/L) and by determining the formation of nitrite and pesticide transformation products. Microbiological characterization of each biofilter was also carried out. It was found that the highest nitrate removal (>99%) occurred in water-saturated wood biofilters, while cork biofilters lost all denitrifying capacity over time (38% to no removal). Unsaturated bio-filter columns were ineffective for nitrate removal (20–30% removal). Regarding pesticides, all biofilters showed high removal of mecoprop and diuron (>99% and >75%, respectively). Atrazine removal in wood pellet biofilters was better than in granulated cork (68–96% vs. 31–38%). Bromacil was removed only in the water-saturated granulated cork biofilter (67%). However, a product of bromacil transformation was formed. It should be noted that the water-saturated wood biofilter contained the largest number of de-nitrifying microorganisms, the characteristic representative of which was Methyloversatilis. Overall, the results showed that biofilters based on wood pellets operate under water-saturated conditions and can be applied for the treatment of groundwater polluted by nitrates and pesticides.
Prospects for the use of organic coagulant–flocculant for the pre-treatment of water to improve the reduction in microbial contamination and turbidity in combination with sand filtration for domestic conditions (point-of-use, POU) were studied by [96]. Chitosan was used as a flocculant. In this case, tabletop periodic sand filters with a 16 cm layer of sand and two different grain sizes, representing slow and fast sand filters, were dosed daily for 57 days with the addition of microbes to the surface water. E. coli bacteria and MS2 coliphage virus counts were determined every two weeks (N = 17) using culture methods. The removal of bacteria and viruses was found to be significantly improved compared to sand filtration without pre-treatment with chitosan (Wilcoxon Rank-Sum, p < 0.05). When water was pre-treated with an optimum dose of chitosan (10 mg/L) followed by filtration through the sand, a log10 decrease in the number of bacteria and viruses in the water was observed. The reduction in microbial activity and turbidity generally improved over the life of the filter but was independent of the filtration rate.
The effect of sand particle size, filter thickness, and filtration rate on the disinfection efficiency, bacterial community, and metabolic function of slow bio-sand filters was studied in [97]. It was shown that the average removal efficiency of fine sand was about 4% higher than that of coarse sand and that the thick filter layer showed a more stable performance. In water treatment, the schmutzdecke layer played an overwhelming role and removed most of the turbidity and organic contaminants. The filtration rate was a key factor in shaping the bacterial community structure. As filtration rate increased, the relative abundance of Proteobacteria and Cyanobacteria decreased and increased significantly, respectively. Co-occurrence patterns were dominant in the bacterial communities. Functional bacteria (e.g., Hyphomicrobium and Methylophilus) and rare genera (Curvibacter and Simplicispira) were identified as nodule genera in the networks. Bacterial communities exhibited metabolic versatility. Some secondary metabolic pathways shifted significantly under different conditions, such as biodegradation and xenobiotic metabolism. Moreover, the filtration rate and predominant species strongly influenced the efficiency of contaminant removal.
In [98], the effectiveness of four models of domestic slow sand filters (HSSFs) to remove microorganisms from river water throughout their biological development in the schmutzdecke was investigated. Two models were designed for continuous operation (HSSF-CC and HSSF-CT) and two models intermittently (HSSF-ID and HSSF-IF). The filters were fed with 48 L of pre-treated river water daily. Coarse solids in the river water were sedimented for 24 h, and then the water was passed through a non-woven synthetic blanket. The water samples were quantified with E. coli group bacteria and analyzed using light-field microscopy to visualize the microorganisms. Microorganisms such as algae, protozoa, and helminths were detected in raw water and pre-treated water. After passing through the sand filters, the total reduction in coliform bacteria in the water was between 1.42 ± 0.59 log and 2.96 ± 0.58 log, with continuous models showing better performance (p < 0.004). Escherichia coli reduction ranged from 1.49 ± 0.58 log to 2.09 ± 0.66 log, and HSSF-IF, HSSF-CC, and HSSF-CT showed similar performance (p > 0.06), slightly better than that represented by HSSF-ID (p = 0.04). The results of the study confirmed the feasibility of using HSSF in rural communities in domestic settings (POU) to reduce microbiological risk from river water.
The effect of the household sand filter process mode on the effectiveness of turbidity and color reduction, as well as on the reduction in E. coli and E. coli concentrations in the water after treatment, was studied in [99]. Two PVC house slow sand filters (HSSFs) were operated in continuous (C-HSSF) and intermittent (I-HSSF) flow regimes for eight consecutive months. A non-woven blanket was placed on top of the fine sand to facilitate cleaning. The results of the experiment showed that there were no differences between the continuous-flow and intermittent-flow modes in physicochemical parameters and overall E. coli reduction parameters. However, C-HSSF showed a better result in the reduction in E. coli in water (p = 0.02). Measurement of dissolved oxygen concentration in the adherent biofilm using a Clark microsensor also showed no significant difference between I-HSSF and C-HSSF (p = 0.98).
The effectiveness of the application of sand coated with graphene oxide on the degree of removal of two representative micropollutants (MPs)—atrazine (ATZ) and atenolol (ATL)—from the composition of groundwater by the SSF method was studied in [100]. A layer of graphene oxide (GO) on the surface of sand particles was applied using a simple thermal method. The results showed that the GO-coated sand removes ATZ, ATL, and total organic carbon (TOC) better and reduces water turbidity stronger than the simple sand. From this, it is assumed that the enhanced removal capacity of coated sand with respect to ATZ, ATL, and TOC may be mainly due to the GO coating layer and not to the formation of a biofilm (schmutzdecke). Consequently, the application of GO-coated sand in the SSF field to remove organic contaminants can eliminate the schmutzdecke biofilm growth phase.
In [101], to improve the efficiency of bacteria removal from water, biochar produced at different temperatures (400 °C, 550 °C, and 700 °C) and arginine-modified biochar were added (0.5 and 1 wt. %) to sand filtration columns as filter layers. The addition of biochar to the sand columns was shown to increase the removal efficiency of Escherichia coli and Bacillus subtilis under both slow (4 m/day) and fast (240 m/day) filtration conditions. At the same time, the removal efficiency of bacteria in sand columns with the addition of biochar made at 700 °C was higher than that of columns with the addition of biochar made at 400 °C and 550 °C. Moreover, the modification of biochar with arginine further improved bacteria removal efficiency. For example, complete removal of bacteria (1.35 × 10⁷ ± 10% cells/mL) was achieved under both slow and fast filtration conditions in sand columns with the addition of biochar modified with 1 wt. % arginine. Increased adsorption capacity of bacteria was observed in columns with the addition of biochar modified with arginine. Bacteria are more closely associated with arginine-modified biochar than with simple biochar. Moreover, complete removal of bacteria in the combined presence of 5 mg/L humic acid in suspensions was achieved in columns with the addition of 1 wt. % arginine-modified biochar. The results of this study showed that arginine-modified biochar has great potential for cleaning water contaminated by pathogenic bacteria.
The effect of exposure to solar energy in combination with HSSF on the quality of drinking water was considered in [102]. For this purpose, a filter was built from PVC tubes, sand, and gravel. Solar water disinfection was performed according to the Solar Water Disinfection (SODIS) methodology. At a filtration rate of 2.38 m3/(m2 day), turbidity removal was 97%, and for all E. coli it was 99.9% and E. coli 99.1%.
In [103], the possibility of using a mixed layer of sand with activated carbon for the post-treatment of wastewater containing surfactants was investigated. The activated carbon was obtained from waste coffee grounds and the surfactant concentration in the wastewater in the Sewage Treatment Plant (STP)-Vila City (Brazil) varied from 21 to 39 mg/L. The slow filtration rate was 15 m3/(m2 day). The removal of surfactants was about 9% and 7% in Upflow Anaerobic Sludge Bed reactors (UASB-RALF) and in secondary treatment, respectively, in STP-Vila City plants. At the subsequent stage of water treatment by filtration/adsorption through a mixed layer of sand with activated carbon, a reduction of 94% turbidity (NTU) and 95% surfactant removal was achieved.
The possibility of treating natural water taken from the Blue Nile and White Nile (Egypt) with a domestic slow sand filter (HSSF) using local materials was investigated in [104]. Two filters were used to purify natural water. The first filter consisted of the following layers: standing water (30 cm), fine sand column (40 cm), and gravel (20 cm). The second filter consisted of the following layers: standing water (30 cm), fine sand column (25 cm), coarse (natural river) sand column (20 cm), and gravel (20 cm). The results showed that both filters were very effective in removing E. coli and all E. coli. The mean log10 removal of all E. coli and E. coli for the first filter ranged from 1.9 log to 1.7 log compared to a range of 1.1 log to 1.2 log for the second filter. The relationship of total coliform log10 with turbidity and TSS changed dramatically after filtration. In this case, the best performance of filter 1 was noted for bacteria removal, turbidity, iron (Fe), TSS, K, NO2, and Zn, respectively, compared to NO2, Fe, and Zn for filter 2 in the same order. All soluble ions after filtration did not exceed WHO limits. It is assumed that the first filter is more effective for treating natural water than the second filter.
References
- Shanahan, P. Water and Wastewater Treatment Engineering. Massachusetts Institute of Technology: MIT OpenCourseWare. 2006. Available online: https://ocw.mit.edu (accessed on 3 January 2023).
- Brief History during the Snow Era. Available online: https://www.ph.ucla.edu/epi/snow/1859map/Chelsea_waterworks_a2.html (accessed on 24 February 2023).
- Christman, K. The history of chlorine. Waterworld 1998, 14, 66–67.
- Huisman, L.; Wood, W.E. Slow Sand Filtration; World Health Organization: Geneva, Switzerland, 1974. Available online: https://apps.who.int/iris/bitstream/handle/10665/38974/9241540370.pdf?sequence=1&isAllowed=y (accessed on 23 January 2023).
- Buchan, J. Crowed with Genius: The Scottish Enlightenment: Edinburgh’s Moment of the Mind; Harper Collins: New York, NY, USA, 2003.
- Crittenden, J.; Trussell, R.R.; Hand, D.W.; Howe, K.; Tchobanoglous, G. Water Treatment: Principles and Design, 2nd ed.; Wiley: Hoboken, NJ, USA, 2005.
- Johnson, G. Present Day Water Filtration Practice. J. Am. Water Work. Assoc. 1914, 1, 31–80.
- National Drinking Water Clearinghouse. Slow sand filtration. Municipal Water Supply. In Water Encyclopedia; John Wiley & Sons, Inc.: Hoboken, NJ, USA, 2005.
- History|Poughkeepsies Water Treatment Facility. Retrieved 18 May 2017. Available online: www.pokwater.com (accessed on 13 February 2023).
- Lacey, M. Filtration to privatization, utility issues are universal. J. Am. Water Work. Assoc. 2009, 101, 2.
- Manz, D. New horizons for slow sand filtration. In Proceedings of the Eleventh Canadian National Conference and Second Policy Forum on Drinking Water and the Biennial Conference of the Federal-Provincial-Territorial Committee on Drinking Water, Promoting Public Health through Safe Drinking Water, Calgary, AB, Canada, 3–6 April 2004; pp. 682–692.
- Gunn, S.; William, A.; Masellis, M. Concepts and Practice of Humanitarian Medicine. 23 October 2007. Available online: https://books.google.com/books?id=t1exE1cfKXIC&pg=PA87 (accessed on 19 January 2023).
- Wegelin, M. Roughing gravel filters for suspended solids removal. In Slow Sand Filtration: Recent Developments in Water Treatment Technology; Graham, N.J.D., Ed.; Ellis Horwood Ltd.: England, UK, 1988; p. 86.
- Logsdon, G.S.; Lippy, E.C. The role of filtration in preventing waterborne disease. J. Am. Water Work. Assoc. 1982, 74, 649–655.
- Erazo-Oliveras, A.; May Ol-Bracero, O.L.; Ríos-Dávila, R.A. Improving slow sand filters for water-limited communities. Opflow 2012, 38, 24–27.
- Elliott, M.A.; Stauber, C.E.; Koksal, F.; DiGiano, F.A.; Sobsey, M.D. Reductions of E-coli, echovirus type 12 and bacteriophages in an intermittently operated household-scale slow sand filter. Water Res. 2008, 42, 2662–2670.
- Collins, M.R. Experiences introducing “new” technology: Slow sand filtration. In Providing Safe Drinking Water in Small Systems: Technology, Operations, and Economics; Cotruvo, J.A., Craun, G.F., Hearn, N., Eds.; CRC Press: Boca Raton, FL, USA, 1998; pp. 213–224.
- Letterman, R.D.; Cullen, T.R. Slow Sand Filter Maintenance: Costs and Effects on Water Quality; Report 600/S2-85/056; U.S. Environmental Protection Agency: Washington, DC, USA, 1985.
- Al-Ani, M.; McElroy, J.M.; Hibler, C.P.; Hendricks, D.W. Filtration of Giardia Cysts and Other Substances: Volume 3, Rapid-Rate Filtration; Report 600/S2-85/027; U.S. Environmental Protection Agency: Washington, DC, USA, 1985.
- Droste, R.L. The Theory and Practice of Water and Wastewater Treatment; Wiley: New York, NY, USA, 1997.
- Arndt, R.; Wagner, E. Rapid and slow sand filtration Techniques and Their Efficacy at Filtering Triactinomyxons of Myxobolus cerebralis from Contaminated Water. N. Am. J. Aquac. 2004, 66, 261–270.
- Bellamy, W.D.; Silverman, G.P.; Hendricks, D.W.; Logsdon, G.S. Removing Giardia cysts with slow sand filtration. J. Am. Water Work. Assoc. 1985, 77, 52–60.
- Frederick, W. Drinking Water Regulation and Health, 1st ed.; Pontius, Wiley and Science: New York, NY, USA, 2003; ISBN 13: 978-0471415541/10: 0471415545.
- Yildiz, B.S. Water and wastewater treatment: Biological processes. In Metropolitan Sustainability; Woodhead Publishing Limited: Cambridge, UK, 2012; pp. 406–428.
- Lubarsky, H.; Fava, N.D.M.N.; Souza Freitas, B.L.; Terin, U.C.; Oliveira, M.; Lamon, A.W.; Pichel, N.; Byrne, J.A.; Sabogal-Paz, L.P.; Fernandez-Ibañez, P. Biological Layer in Household Slow Sand Filters: Characterization and Evaluation of the Impact on Systems Efficiency. Water 2022, 14, 1078.
- Maiyo, J.K.; Dasika, S.; Jafvert, C.T. Slow Sand Filters for the 21st Century: A Review. Int. J. Environ. Res. Public Health 2023, 20, 1019.
- Islam, M.M.M.; Iqbal, M.S.; D’Souza, N.; Islam, M.A. A review on present and future microbial surface water quality worldwide. Environ. Nanotechnol. Monit. Manag. 2021, 16, 100523.
- Liang, L.; Goh, S.G.; Vergara, G.G.R.V.; Fang, H.M.; Rezaeinejad, S.; Chang, S.Y.; Bayen, S.; Lee, W.A.; Sobsey, M.D.; Rose, J.B.; et al. Alternative fecal indicators and their empirical relationships with Enteric Viruses, Salmonella enterica, and Pseudomonas aeruginosa in surface waters of a tropical urban catchment. Appl. Environ. Microbiol. 2015, 81, 850–860.
- Clark, P.A.; Pinedo, C.A.; Fadus, M.; Capuzzi, S. Slow-sand water filter: Design, implementation, accessibility and sustainability in developing countries. Med. Sci. Monit. 2012, 18, RA105–RA117.
- Visscher, J.T. Slow sand filtration: Design, Operation, and Maintenance. J. Am. Water Work. Assoc. 1990, 82, 67–71.
- Logsdon, G.S.; Sorg, T.J.; Clark, R.M. Capability and Cost of Treatment Technologies for Small Systems. J. Am. Water Work. Assoc. 1990, 82, 60–66.
- Verma, S.; Daverey, A.; Sharma, A. Slow sand filtration for water and wastewater treatment—A review. Environ. Technol. Rev. 2017, 6, 47–58.
- Logsdon, G.S.; Kohne, R.; Abel, S.; LaBonde, S. Slow sand filtration for small water systems. J. Environ. Eng. Sci. 2002, 68, 100–108.
- Cleary, S. Sustainable Drinking Water Treatment for Small Communities using Multistage Slow Sand Filtration. Master’s Thesis, University of Waterloo, Waterloo, ON, Canada, 2005.
- Gottinger, A.M.; McMartin, D.W.; Price, D.; Hanson, B. The effectiveness of slow sand filters to treat Canadian rural prairie water. Can. J. Civ. Eng. 2011, 38, 455–463.
- Collins, M.R.; Eighmy, T.T.; Malley, J.P. Evaluating Modifications to Slow Sand Filters. J. Am. Water Work. Assoc. 1991, 83, 62–70.
- Guchi, E. Review on slow sand filtration in removing microbial contamination and particles from drinking water. Research 2015, 3, 47–55.
- Weber-Shirk, M.; Dick, R. Physical–chemical mechanisms in slow sand filters. J. Am. Water Work. Assoc. 1997, 89, 87–100.
- Montgomery, J.M. Water Treatment: Principles and Design; John Wiley & Sons: Hoboken, NJ, USA, 1985; pp. 1–432.
- Galvis, G.; Latorre, J.; Visscher, J.T. Multi-Stage Filtration: An Innovative Water Treatment Technology; TP Series; IRC International Water and Sanitation Center: The Hague, The Netherlands, 1998; Volume 34.
- Mc Connell, L.J. Evaluation of the Slow Rate Sand Filtration Process for Treatment of Drinking Water Containing Virus and Bacteria. Master’s Thesis, Utah State University, Logan, UT, USA, 1984.
- Ellis, K.V.; Wood, W.E. Slow sand filtration. CRC Crit. Rev. Environ. Control. 1985, 15, 315–354.
- Van Dijk, J.C.; Ooman, J.H.C. Slow Sand Filtration for Community Water Supply in Developing Countries: A Design and Construction manual; WHO International Reference Center for Community Water Supply: The Hague, Netherlands, 1978; Chapter 4.
- Troyan, J.J.; Hansen, S.P. Treatment of Microbial Contaminants in Potable Water Supplies; Noyes Data Corporation: Park Ridge, IL, USA, 1989; pp. 5–54.
- Yahya, M.T.; Cluff, C.B.; Gerba, C.P. Virus removal by slow sand filtration and nanofiltration. Water Sci. Technol. 1993, 27, 445–448.
- Cullen, T.R.; Letterman, R.D. The Effect of Slow Sand Filter Maintenance on Water Quality. J. Am. Water Work. Assoc. 1985, 77, 48–55.
- Campos, L.C.; Su, M.F.; Graham, N.J.; Smith, S.R. Biomass development in slow sand filters. Water Res. 2002, 18, 4543–4551.
- Haig, S.J.; Collins, G.; Davies, R.L.; Dorea, C.C.; Quince, C. Biological aspects of slow sand filtration: Past, present and future. Water Sci. Technol. Water Supply 2011, 11, 468–472.
- Poynter, S.F.B.; Slade, J.S. The removal of viruses by slow sand filtration. Prog. Water Technol. 1977, 9, 75–88.
- Bellamy, W.D.; Silverman, G.P.; Hendricks, D.W. Filtration of Giardia Cysts and Other Substances: Volume 2, Slow Sand Filtration; U.S. Environmental Protection Agency, Water Engineering Research Laboratory: Cincinnati, OH, USA, 1985.
- Slow Sand Filtration; Tech Brief Fourteen; National Drinking Water Clearinghouse (U.S.): Morgantown, WV, USA, 2000.
- Eighmy, T.T.; Collins, M.R. Modifications to the slow rate Filtration Process for Improved Trihalometane precursor Removal. In Slow Sand Filtration: Recent Developments in Water Treatment Technology; Graham, N.J.D., Ed.; Ellis Horwood Ltd.: England, UK, 1988; pp. 1–97.
- Edzwald, J.K. American Water Works Association. Water Quality & Treatment, a Handbook on Drinking Water, 6th ed.; McGraw-Hill: New York, NY, USA, 2010.
- Biosand Filter Manual: Design, Construction, & Installation; Centre for Affordable Water and Sanitation Technology: Calgary, AB, Canada, 2007.
- Haarhoff, J.; Cleasby, J.L. Biological and Physical Mechanisms in Slow Sand Filtration; Logsdon, G.S., Ed.; SSF American Society of Civil Engineers: New York, NY, USA, 1991; pp. 19–68.
- Weber-Shirk, M.; Dick, R. Biological mechanisms in slow sand filters. J. Am. Water Work. Assoc. 1997, 89, 72–83.
- Weber-Shirk, M.; Dick, R. Bacterivory by a chrysophyte in slow sand filters. Water Res. 1999, 33, 631–638.
- Bauer, R.; Dizer, H.; Graeber, I.; Rosenwinkel, K.-H.; López-Pilaa, J.M. Removal of bacterial fecal indicators, coliphages and enteric adenoviruses from waters with high fecal pollution by slow sand filtration. Water Res. 2011, 45, 439–452.
- Kennedy, T.J.; Anderson, T.A.; Hernandez, E.A.; Morse, A.N. Determining the operational limits of the biosand filter. Water Sci. Technol.-Water Supply 2013, 13, 56–65.
- Fewster, E.; Mol, A.; Wiessent-Brandsma, C. The Bio-sand Filter. Long term sustainability: User habits and technical performance evaluated. In Proceedings of the Presentation Given at the 2003 International Symposium on Household Technologies for Safe Water, Nairobi, Kenya, 16–17 June 2004.
- Mahmood, Q.; Baig, S.A.; Nawab, B.; Shafqat, M.N.; Pervez, A.; Zeb, B.S. Development of low cost household drinking water treatment system for the earthquake affected communities in Northern Pakistan. Desalination 2011, 273, 316–320.
- United States Environmental Protection Agency (EPA). Technologies for Upgrading Existing or Designing New Drinking Water Treatment Facilities. Document No. EPA/625/4-89/023. 1990. Available online: https://nepis.epa.gov/Exe/ZyNET.exe/300048WU.TXT (accessed on 2 March 2023).
- HDR Engineering. Handbook of Public Water Systems; John Wiley and Sons: New York, NY, USA, 2001; p. 353. ISBN 978-0-471-29211-1. Available online: https://www.wiley.com/en-ie/Handbook+of+Public+Water+Systems,+2nd+Edition-p-9780471292111 (accessed on 28 March 2023).
- Bellamy, W.D.; Hendricks, D.W.; Logsdon, G.S. Slow Sand Filtration: Influences of Selected Process Variables. J. Am. Water Work. Assoc. 1985, 77, 62–66.
- Burman, N.P. Biological control of slow sand filtration. Effl. Water Treat. J. 1962, 2, 674.
- Weber-Shirk, M.L. Enhancing slow sand filter performance with an Acid- Soluble Seston Extract. Water Res. 2002, 36, 4753–4756.
- Rooklidge, S.J.; Miner, J.R.; Kassim, T.A.; Nelson, P.O. Antimicrobial contaminant removal by multistage slow sand filtration. J. Am. Water Work. Assoc. 2005, 97, 92–100.
- Lesikar, B. Sand Filters for Home Use—Texas Agricultural Extension Service. Scribd. Available online: http://www.scribd.com/doc/34621075/Sand-filters-for-home-use-Texas-Agricultural-Extension-Service (accessed on 25 January 2023).
- Logan, A.J.; Stevik, T.K.; Siegrist, R.L.; Rønn, R.M. Transport and fate of Cryptosporidium parvum oocysts in intermittent sand filters. Water Res. 2001, 35, 4359–4369.
- Williams, P.G. A study of bacteria reduction by slow sand filtration. In Paper Presented at the 1987 IWPC Biennial Conference, Port Elizabeth, South Africa, 12–15 May 1987; National Institute for water Research: Pretoria, South Africa, 1987.
- Peterson, H.; Corkal, D. Biological Treatment of Ground Water. Prairie Farm Rehabilitation Administration. Water Quality Matters. Available online: http://www5.agr.gc.ca/resources/prod/doc/pfra/pdf/bio_treat_groundwater_e.pdf (accessed on 25 January 2023).
- Peterson, H.; Broley, T.; Sketchell, J.; Corkal, D. ADD Board 15 and 43 Project Report: Biological Treatment of Ground Water; Publication No. R-1640-6-E-97; Saskatchewan Research Council: Saskatoon, SK, Canada, 1997.
- Kennedy, T.J.; Hernandez, E.A.; Morse, A.N.; Anderson, T.A. Hydraulic Loading Rate Effect on Removal Rates in a BioSand Filter: A Pilot Study of Three Conditions. Water Air Soil Pollut. 2012, 223, 4527–4537.
- Bradley, I.; Straub, A.; Maraccini, P.; Markazi, S.; Nguyen, T.H. Iron oxide amended biosand filters for virus removal. Water Res. 2011, 45, 4501–4510.
- Hussain, G.; Haydar, S.; Bari, A.J.; Aziz, J.A.; Anis, M.; Asif, Z. Evaluation of Plastic Household Biosand Filter (BSF) In Combination with Solar Disinfection (SODIS) For Water Treatment. J. Chem. Soc. Pak. 2015, 37, 352–362.
- Nitzsche, K.S.; Weigold, P.; Losekann-Behrens, T.; Kappler, A.; Behrens, S. Microbial community composition of a household sand filter used for arsenic, iron, and manganese removal from groundwater in Vietnam. Chemosphere 2015, 138, 47–59.
- Lukasheva, G.N.; Yurovsky, A.V. Slow self-cleaning filter for deferrization of natural waters. Bull. Assoc. Univ. Tour. Serv. 2010, 4, 56–63. (In Russian)
- Yurovsky, A.V.; Lukasheva, G.N. Study of the efficiency of a slow self-cleaning filter. In Materials of the All-Russian Scientific Conference of Graduate Students and Young Scientists “Modern Problems of Tourism and Service”; FGSHUVPO “RGUTiS”: Moscow, Russia, 2010; pp. 270–274. (In Russian)
- Yurovsky, A.V.; Lukasheva, G.N. Formation of a chemisorption layer of the filter bed of a slow self-cleaning iron removal filter. In Materials of the All-Russian Scientific Conference of Graduate Students and Young Scientists “Modern Problems of Tourism and Service”; FGSHUVPO “RGUTiS”: Moscow, Russia, 2010; pp. 274–278. (In Russian)
- Sultanov, F.; Daulbayev, C.; Azat, S.; Kuterbekov, K.; Bekmyrza, K.; Bakbolat, B.; Bigaj, M.; Mansurov, Z. Influence of Metal Oxide Particles on Bandgap of 1D Photocatalysts Based on SrTiO3/PAN Fibers. Nanomaterials 2020, 10, 1734.
- Rakhmanin, Y.A.; Cheskis, A.B. Drinking Water. Quality Standards. Handbook; VINITI: Moscow, Russia, 1993; pp. 1–7, 19, 26, 46.
- Grützmacher, G.; Böttcher, G.; Chorus, I.; Bartel, H. Removal of microcystins by slow sand filtration. Environ. Toxicol. 2002, 17, 386–394.
- Onan, L.; LaPara, T. Tylosin-resistant Bacteria Cultivated from Agricultural Soil. FEMS Toxicol. Lett. 2003, 220, 15–24.
- De Liguoro, M.; Cibin, V.; Capolongo, F.; Halling-Sørensen, B.; Montesissa, C. Use of oxytetracycline and tylosin in intensive calf farming: Evaluation of transfer to manure and soil. Chemosphere 2003, 52, 203–210.
- Inglezakis, V.J.; Azat, S.; Tauanov, Z.; Mikhalovsky, S.V. Functionalization of biosourced silica and surface reactions with mercury in aqueous solutions. Chem. Eng. J. 2021, 423, 129745.
- Pachocka, M. Intermittent Slow Sand Filters: Improving their Design for Developing World Applications. Master’s Thesis, University of Delaware, Newark, DE, USA, 2010.
- Partinoudi, V.; Collins, M.R.; Dwyer, P.L.; Martin-Doole, M. Assessing Temperature Influences on Slow Sand Filtration Treatment Performance. Project Summary, New England Water Treatment Technology Assistance Center, Univ. of New Hampshire. 2007. Available online: http://www.unh.edu/wttac/Project_Summaries/assessing_temperature_slow_sand.pdf (accessed on 14 January 2023).
- Fogel, D.; Isaac-Renton, J.; Guasparini, R.; Moorehead, W.; Ongerth, J. Removing giardia and cryptosporidium by slow sand filtration. J. Am. Water Work. Assoc. 1993, 85, 77–84.
- Liu, J.; Cao, X.; Meng, X. Effects of temperature on performances of a slow sand filter used for advanced wastewater treatment. Chin. J. Environ. Eng. 2010, 4, 2437–2440.
- Schijven, J.F.; van den Berg, H.H.J.L.; Colin, M.; Dullemont, Y.; Hijnen, W.A.M.; Magic-Knezev, A.; Oorthuizen, W.A.; Wubbels, G. A mathematical model for removal of human pathogenic viruses and bacteria by slow sand filtration under variable operational conditions. Water Res. 2013, 47, 2592–2602.
- Jabur, H.S.; Gimbel, R.; Graham, N.J.D.; Collins, M.R. The Effect of Water Temperature on the Slow Sand Filter Process. Recent Progress in Slow Sand and Alternative Biofiltration Processes; IWA: London, UK, 2006; Volume 5, p. 582.
- Unger, M.; Collins, M.R. Assessing Escherichia coli removal in the schmutzdecke of slow-rate biofilters. J. Am. Water Works Ass. 2008, 100, 60–73.
- Welte, B.; Montiel, A. Removal of BDOC by Slow Sand Filtration: Comparison with granular activated carbon and effect of temperature. In Advances in Slow Sand and Alternative Biological Filtration; Graham, N., Collins, R., Eds.; John Wiley & Sons Ltd.: England, UK, 1996; p. 60.
- Fitriani, N.; Wahyudianto, F.E.; Salsabila, N.F.; Mohamed, R.M.S.R.; Kurniawan, S.B. Performance of modified slow sand filter to reduce turbidity, total suspended solids, and iron in river water as water treatment in disaster areas. J. Ecol. Eng. 2023, 24, 1–18.
- Escola Casas, M.; Guivernau, M.; Vinas, M.; Fernandez, B.; Caceres, R.; Biel, C.; Matamoros, V. Use of wood and cork in biofilters for the simultaneous removal of nitrates and pesticides from groundwater. Chemosphere 2023, 313, 137502.
- Holmes, E.B.; Oza, H.H.; Bailey, E.S.; Sobsey, M.D. Evaluation of chitosans as coagulants—Flocculants to improve sand filtration for drinking water treatment. Inter. J. Mol. Sci. 2023, 24, 1295.
- Liu, H.-L.; Li, X.; Li, N. Application of bio-slow sand filters for drinking water production: Linking purification performance to bacterial community and metabolic functions. J. Water Process Eng. 2023, 53, 103622.
- Fava, N.M.N.; Terin, U.C.; Freitas, B.L.S.; Sabogal-Paz, L.P.; Fernandez-Ibanez, P.; Byrne, J.A. Household slow sand filters in continuous and intermittent flows and their efficiency in microorganism’s removal from river water. Environ. Technol. 2022, 43, 1583–1592.
- Lamon, A.W.; Faria Maciel, P.M.; Campos, J.R.; Corbi, J.J.; Dunlop, P.S.M.; Fernandez-Ibanez, P.; Byrne, J.A.; Sabogal-Paz, L.P. Household slow sand filter efficiency with schmutzdecke evaluation by microsensors. Environ. Technol. 2022, 43, 4042–4053.
- Vu, C.T.; Wu, T. Enhanced slow sand filtration for the removal of micropollutants from groundwater. Sci. Total Environ. 2022, 809, 152161.
- Zhang, M.; He, L.; Zhang, X.; Wang, S.; Zhang, B.; Hsieh, L.; Yang, K.; Tong, M. Improved removal performance of Gram-negative and Gram-positive bacteria in sand filtration system with arginine modified biochar amendment. Water Res. 2022, 211, 118006.
- Rosa e Silva, G.O.; Loureiro, H.O.; Soares, L.G.; de Andrade, L.H.; Santos, R.G.L. Evaluation of an alternative household water treatment system based on slow filtration and solar disinfection. J. Water Health 2022, 20, 157–166.
- Ribeiro, M.P.; Botari, A. Evaluation of effluent post-treatment by slow filtration and adsorption with activated carbon produced from spent coffee grounds in surfactant removal in sewage treatment. Rev. Ambiente Agua 2022, 17, E2756.
- Mohammed, M.O.A.; Solumon, A.A.M. Two models of household sand filters for small scale water purification. Pol. J. Environ. Stud. 2022, 31, 2737–2748.
More
Information
Subjects:
Green & Sustainable Science & Technology; Materials Science, Biomaterials; Engineering, Environmental
Contributors
MDPI registered users' name will be linked to their SciProfiles pages. To register with us, please refer to https://encyclopedia.pub/register
:
View Times:
8.2K
Revisions:
5 times
(View History)
Update Date:
02 Jun 2023
Table of Contents


Notice
You are not a member of the advisory board for this topic. If you want to update advisory board member profile, please contact office@encyclopedia.pub.
OK
Confirm
Only members of the Encyclopedia advisory board for this topic are allowed to note entries. Would you like to become an advisory board member of the Encyclopedia?
Yes
No
${ textCharacter }/${ maxCharacter }
Submit
Cancel
Back
Comments
${ item }
|
${ item.createdUser.fullName }
${ item.createdAt }
${ item.vote }
${ item.reply }
Delete
${ reply.createdUser.fullName }
${ reply.createdAt }
${ reply.vote }
Delete
There is no reply to this comment~
${ item.replyTextCharacter }/${ item.replyMaxCharacter }
Submit
Cancel
More
No more~
There is no comment~
${ textCharacter }/${ maxCharacter }
Submit
Cancel
${ selectedItem.replyTextCharacter }/${ selectedItem.replyMaxCharacter }
Submit
Cancel
Confirm
Are you sure to Delete?
Yes
No