Your browser does not fully support modern features. Please upgrade for a smoother experience.
Submitted Successfully!
 +1 credit
Thank you for your contribution! You can also upload a video entry or images related to this topic.
For video creation, please contact our Academic Video Service.
| Version | Summary | Created by | Modification | Content Size | Created at | Operation |
|---|---|---|---|---|---|---|
| 1 | Rui Duarte | -- | 1957 | 2023-05-11 10:26:13 | | | |
| 2 | Dean Liu | -48 word(s) | 1909 | 2023-05-12 11:38:34 | | | | |
| 3 | Dean Liu | Meta information modification | 1909 | 2023-05-15 08:53:28 | | |
Video Upload Options
We provide professional Academic Video Service to translate complex research into visually appealing presentations. Would you like to try it?
Cite
If you have any further questions, please contact Encyclopedia Editorial Office.
Duarte, R.P.; Cunha, C.A.S.; Alves, V.N.N. Application for Food Plan Management Alzheimer Patients. Encyclopedia. Available online: https://encyclopedia.pub/entry/44136 (accessed on 25 July 2026).
Duarte RP, Cunha CAS, Alves VNN. Application for Food Plan Management Alzheimer Patients. Encyclopedia. Available at: https://encyclopedia.pub/entry/44136. Accessed July 25, 2026.
Duarte, Rui P., Carlos A. S. Cunha, Valter N. N. Alves. "Application for Food Plan Management Alzheimer Patients" Encyclopedia, https://encyclopedia.pub/entry/44136 (accessed July 25, 2026).
Duarte, R.P., Cunha, C.A.S., & Alves, V.N.N. (2023, May 11). Application for Food Plan Management Alzheimer Patients. In Encyclopedia. https://encyclopedia.pub/entry/44136
Duarte, Rui P., et al. "Application for Food Plan Management Alzheimer Patients." Encyclopedia. Web. 11 May, 2023.
Copy Citation
Alzheimer’s disease is a type of dementia that affects many individuals, mainly in an older age group. Over time, it leads to other diseases that affect their autonomy and independence. The quality of food ingestion is a way to mitigate the disease and preserve the patient’s well-being, which substantially impacts their health.
human–computer interaction
user-centered design
user experience questionnaire
1. Mapping Real World Food Plans
Before designing the interface, it was essential to understand what the system is to its users instead of how the designers present it. This was carried out by creating conceptual models, namely by the definition of a system metaphor [1]. The principles beneath this approach relate to the definition of analogies with the real world; the definition and relation between concepts correctly mapped to the task domain supported by the system. Therefore, in the context of the work presented in this paper, it was crucial to understand what meal planning is for users.
Conceptually, meal planning includes types and amounts of food, incorporating dietary fiber, understanding proper serving sizes, management of eating out and special occasions, as well as incorporating favorite recipes. In real terms, meal planning relates to different food types in a dish. Meals are different throughout the day; the major understood types are breakfast, lunch, snack, and dinner. With this in mind, and considering knowledge acquired by users throughout their lives, a metaphor for the system is the Plate Model [2], as presented in Figure 1. It is a visual method of food representation through pictures, graphs, charts, and food replicas. The centerpiece is the dinner plate, which serves as a pie chart representing the proportions of food. The model also includes side dishes, beverages, and other meal courses. One of the critical elements in nutrition is learning appropriate food quantities. To this end, portion size is an essential aspect of the plate model. Each food must be visually represented in the correct size concerning the overall food distribution on the plate. Using the plate model allows users to understand the concept and carry out tasks in an interface as in real life.
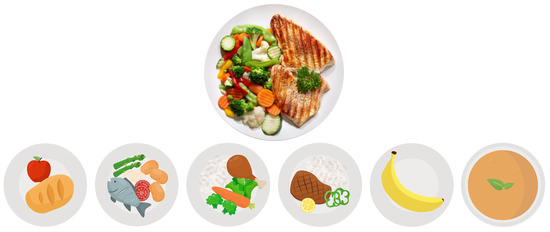
Figure 1 Different representations of meals that map a real meal (depicted in the plate image presented in the first row).
The metaphor used in this context imposes two significant constraints: the creation of sections in the dish—where food is placed—and the visual representation of food so that users will understand the meal. For the first, as presented in Figure 2, the general idea is to create sections in the dish that contain food (considering the food plan prescribed by a nutritionist). The algorithm used to create the circular areas is presented.
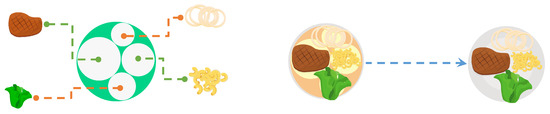
Figure 2. Representation of the interface metaphor. Food is placed in a dish according to its proportions.
For the visual representation of food products, a list of 1307 products was considered. Given the effort required to create each item, they were separated into 77 categories representing several food products or groups. Similar categories were grouped into contexts: drinks, common carbohydrates, milk derivatives, deserts and sweet food, proteins, fruits, vegetables, and other categories that do not fit in the previous. All the elements were created in the scope of this paper for an accurate representation of the food products.
Another important aspect is the percentage of food ingested from the dish. The real-time monitoring of a food plan depends on the feedback on the adequate ingestion of nutrients. It avoids misleading feedback on meal consumption. Therefore, it is critical to represent the percentage of consumed food, which is concordant with the common knowledge of users and the plate model, instead of looking at grams of consumption, which are much more challenging to measure. This way, visual markers were created, representing 200%, 150%, 100%, 75%, 50%, and 25% of each food in the prescribed meal.
2. Components
Several requirements have to be met so that the application can be used by both AP (at an early stage of AD) and IC/FC. Therefore, this section aims to provide a tool to control a nutritionist’s real consumption of a prescribed food plan and the development of several components. First, the core component of the application is the dynamic import and presentation of the meal consultation and the consumption of food in a meal. It comprises a meal tab, a detailed view of the food that composes the meal, and the plate presentation and the food on the plate, as presented in Figure 3.
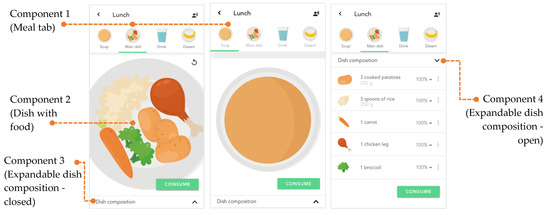
Figure 3. General view of a meal and food placement in a meal.
Given that dehydration is common in people with diseases that cause dementia, water intake outside meals is a critical aspect to consider for patients and has to be taken into account in the interface design and implementation. In the following subsections, several features of the application are presented.
2.1. Import Meal
In a food plan, the nutritionist defines the meal and it is delivered to the patient or its IC. Every imported meal is dynamic and can be composed of a combination of soup, main dish, water, and desert (Figure 4). Each element contains different food consumed (or not) by the AD patient. These data are stored in a structure containing Boolean values determining the element’s visibility in the dish tab.
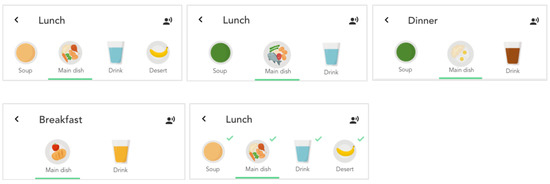
Figure 4. Meal import with different meal tabs depending on the prescribed food plan, and feedback on meal consumed using a visual marker.
Moreover, when a user consumes a dish, this list provides feedback to the user on the meal consumed. To achieve that, the data structure containing the food in the dish is compared to the food consumed. A checkmark is added to the meal to represent its consumption when there is a complete match.
Another important feature is the food placement in the dish when the food plan is imported. The D3.js (Data-Driven Documents) [3] provides a set of libraries that allow data to bind to a Document Object Model (DOM). Reseasrchers implemented a variation of the Zoomable Circle Packing library [4], where a circle represents each node (meal). All children of that node (food in a meal) are positioned next to each other at that level, as presented in Figure 2. This library determines the size and minor circle spaces considering the amount of food to be ingested (in grams). It allows the correct representation of food for a natural and dynamic visualization of meals to the user, depicted in Figure 5.
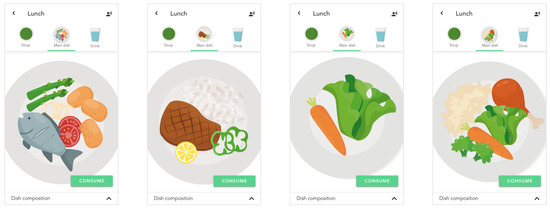
Figure 5. View of meals dynamically created using the Zoomable Circle Packing library.
Another important feature is the correct representation of food in a meal when the food plan is imported into the application. Visually, if a certain amount of prescribed food is low, then the visual representation of this food in the dish must be low (as in a normal dish). For example, if broccoli has a low percentage in the dish, its size has to be adjusted to be visually adequate. To implement relative amounts of food in the dish, the flow presented in Figure 6 was applied.
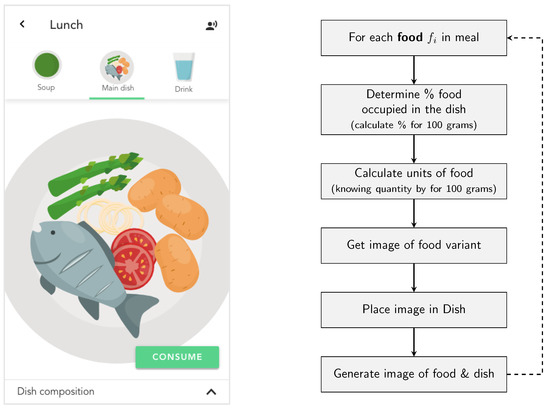
Figure 6. Logic associated with dish presentation.
The logic is implemented in the following manner. First, it is important to consider that a food plan is composed of the amount of food (in grams) that must be consumed to reach the goal of nutrients for each day. Therefore, the amount of food is converted into the percentage of food occupied in a dish. Next, the percentage of food is converted into images representing that food, and a meal is visually generated. For example, if 100 g of a specific food is represented by one image, 200 g is represented by two images of that food.
2.2. Weekly View of Food Plan
The previous knowledge of a future meal is of major interest to users once they can plan and anticipate food ingestion. Considering that people tend to shop for food on a weekly basis, the interface design focused on presenting the food plan for a week. This allows users to view the nutrients required for ingestion and change some food that is of interest. The weekly view of the food plan is presented in Figure 7.

Figure 7. Weekly view of the food plan and detailed view of meals.
For each day, the food plan is presented to the user as a general view of the meals to be consumed. Moreover, the user can add an extra meal by clicking the “+” button (see Figure 8). When a portion of food is consumed (food with a checkmark in Figure 6), the nutrients associated with the food are added to the overall nutrients that are to be consumed on a specific day. So far, the natural operation of viewing and the general consumption of a food plan was created in the interface and is presented. The following sections focus on the design of the remaining four natural operations on food in a meal: partial consumption, exchange, add/remove, and water consumption.
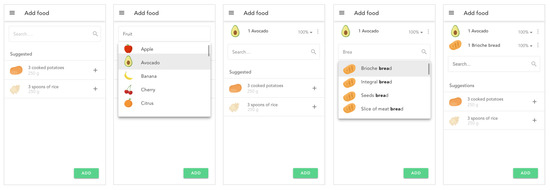
Figure 8. Add food to a meal or outside the meal as an extra.
2.3. Operations on Food and Meal
The concept associated with partial food consumption in a meal is very important for nutritionists since it determines the number of nutrients consumed according to a prescribed food plan. Therefore, if a user only consumes 80% of a particular food, it is important to provide such feedback to the nutritionist since this will provide a realistic view of the food plan consumption and infer the real amount of nutrients consumed. This is presented in the first row of Figure 9, where the user registers the consumption of only 90% of the defined amount of carrots.
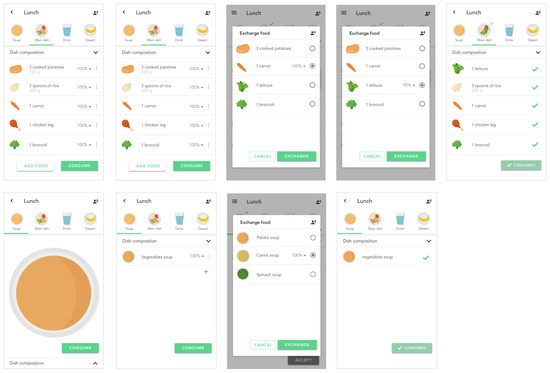
Figure 9. Exchange food from a meal and consumption indicators for the main dish in lunch and soup.
The concept of food change in a meal is associated with the ability of the user to change food from the food plan (with an equivalent) related to the user’s food preferences and the availability of specific food. This allows users to adjust the food plan, maintaining the base nutrients that compose a meal (second row of Figure 9, where a soup is changed with another soup). To this end, the user interface was created considering that food equivalent to the same nutritional level can be exchanged with another food.
Finally, adding food to a meal is an option that has to be provided to users. Consuming food outside a prescribed food plan is not a desirable option since the plan is adjusted to nutrients for each user. However, adding this feature allows positive feedback to the nutritionist and implements a realistic view of ingested food (Figure 8). Moreover, it allows the nutritionist to adjust periods of food ingestion and types of meals by considering the user’s food ingestion habits.
2.4. Water Consumption
Water consumption is most important to individuals with Alzheimer’s due to the impact of a lack of hydration. Therefore, this element, presented in Figure 10, is represented in the meal interface and the menu tab. The design process is analogous to the mental, where the user has visual markers for water ingestion and different quantities of water. The information on each day’s hydration goal is present since it is a stimulus for reaching the goal and maintaining adequate hydration levels.
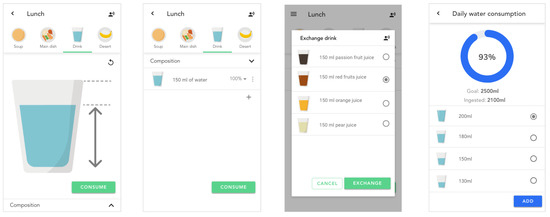
Figure 10. Consumption of water.
2.5. Macronutrients Statistics
Similar to hydration, daily statistics related to the ingestion of macronutrients are also available for consultation (Figure 11). More than a piece of information for consultation, these statistics also serve the purpose of goal-reaching either for the correct ingestion of macronutrients, materialized in calories, or the food that has most contributed to each category.
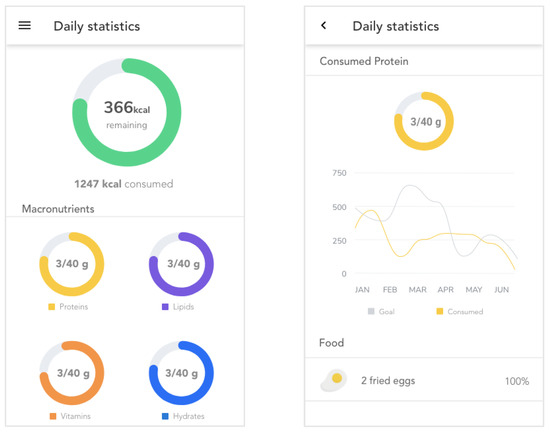
Figure 11. Statistics of consumption of macronutrients.
References
- Johnson, J.; Henderson, A. Conceptual Models: Begin by Designing What to Design. Interactions 2002, 9, 25–32.
- Camelon, K.M.; Hadell, K.; Jamsen, P.T.; Ketonen, K.J.; Kohtamaki, H.M.; Makimatilla, S.; Tormala, M.L.; Valve, R.H. The Plate Model: A Visual Method of Teaching Meal Planning. J. Am. Diet. Assoc. 1998, 98, 1155–1158.
- Bostock, M.; Ogievetsky, V.; Heer, J. D3 Data-Driven Documents. IEEE Trans. Vis. Comput. Graph. 2011, 17, 2301–2309.
- Bostock, M. Zoomable Circle Packing. Available online: https://observablehq.com/@d3/zoomable-circle-packing (accessed on 25 April 2023).
More
Information
Subjects:
Others; Health Care Sciences & Services
Contributors
MDPI registered users' name will be linked to their SciProfiles pages. To register with us, please refer to https://encyclopedia.pub/register
:
View Times:
781
Revisions:
3 times
(View History)
Update Date:
15 May 2023
Table of Contents


Notice
You are not a member of the advisory board for this topic. If you want to update advisory board member profile, please contact office@encyclopedia.pub.
OK
Confirm
Only members of the Encyclopedia advisory board for this topic are allowed to note entries. Would you like to become an advisory board member of the Encyclopedia?
Yes
No
${ textCharacter }/${ maxCharacter }
Submit
Cancel
Back
Comments
${ item }
|
${ item.createdUser.fullName }
${ item.createdAt }
${ item.vote }
${ item.reply }
Delete
${ reply.createdUser.fullName }
${ reply.createdAt }
${ reply.vote }
Delete
There is no reply to this comment~
${ item.replyTextCharacter }/${ item.replyMaxCharacter }
Submit
Cancel
More
No more~
There is no comment~
${ textCharacter }/${ maxCharacter }
Submit
Cancel
${ selectedItem.replyTextCharacter }/${ selectedItem.replyMaxCharacter }
Submit
Cancel
Confirm
Are you sure to Delete?
Yes
No