2. Oxygen Sensor-Based Respirometry in Microbial Testing
2.1. Measurement Principles
Optical O
2 respirometry is a group of techniques that uses phosphorescent O
2 sensing materials in the form of solid-state coatings or soluble probes to trace the dynamics of O
2 concentration in biological samples, usually containing living cells
[6]. The long-decay emission of these materials is reversibly quenched by O
2 via a collisional (i.e., non-chemical) mechanism, and this process reduces sensor intensity and lifetime signals in a manner dependent on O
2 concentration
[6][7][8]. The relationship between the sensor signals and O
2 concentration is described by the Stern–Volmer equation
[9]:
where
Io,
I and
τo,
τ are the phosphorescence intensity and lifetime, LT, signals in the absence and presence of
O2, respectively;
kq is the bimolecular quenching rate constant and
KSV is the Stern–Volmer quenching constant. Thus,
O2 concentration or partial pressure can be quantified by measuring sensor
I or
τ signal
[9]:
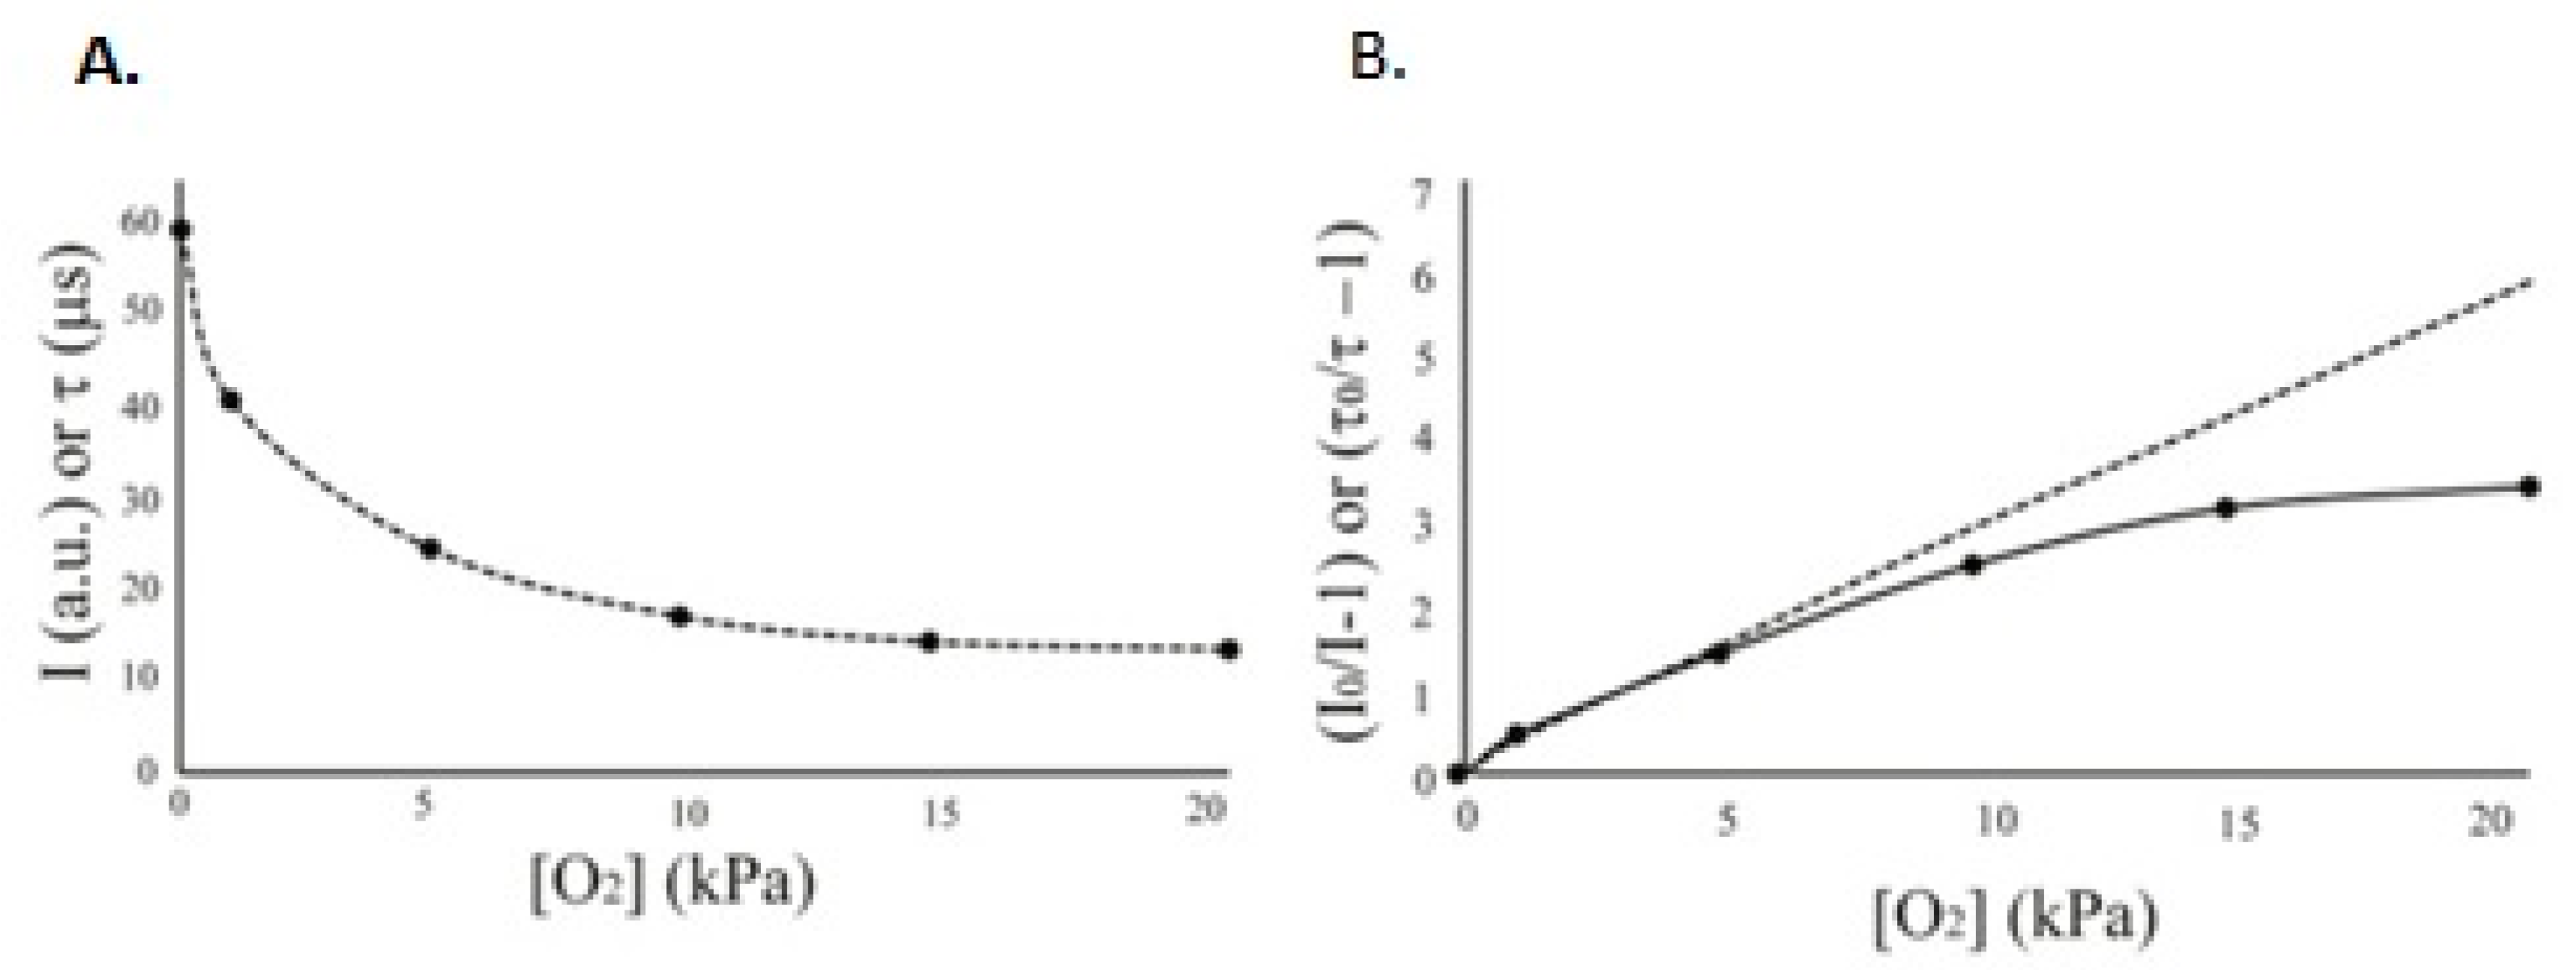
The dependence between O
2 concentration and sensor parameters is shown in
Figure 1. The linear plot corresponds to an ideal system with homogenous dispersion of dye molecules within the sensor matrix
[9]. However, in practice, curved plots reflecting heterogeneous dispersions are commonly observed, which are better described by the ‘two-site’ model
[7][10].
Figure 1. Typical relationship between sensor I and τ signals and O2 concentration (A) and its linearization in Stern–Volmer plots (B) which show the theoretical straight line (dashed) and experimental curve with data points (solid line).
Phosphorescence intensity measurements are used in some O
2 sensing platforms, but they are more error-prone, unstable and difficult to operate. This is because intensity signals, I, are influenced by the fluctuation of the light source and detector, sensor positioning/measurement geometry, photobleaching and leaching of the dye, optical properties of the sample and instrument variability
[6][7][8][9][10]. This in turn leads to large measurement errors, unstable calibrations and inaccurate results.
In contrast, LT (or τ) is the intrinsic parameter of the sensor material
[9], which is influenced by O
2 concentration (see Equations (1) and (2)) but is independent of the instrument, measurement settings and dye concentration
[7]. These features of LT-based O
2 sensing allow for more stable and robust measurements, including respirometry
[6][11], with batch-calibrated disposable sensors and sensing systems.
LT-based O
2 sensing can be performed in the time domain whereby short excitation pulses are applied on the sensor/sample, and its emission decay is traced directly
[9]. A simplified method called rapid lifetime determination (RLD)
[12] uses time-resolved fluorescence intensity (TR-F) measurements at two different delay times with subsequent calculation of LT values using the following equation
[6][11]:
where
t1,
t2 are the first and second delay times, and
I1 and
I2 are the corresponding TR-F intensity signals. The TR-F and RLD modes are supported by standard multilabel readers, although their temporal resolution (LT values > 15 μs) is compatible with only some sensor materials.
In phase-domain methods, the sensor is excited with periodically modulated light while measuring the phase shift, Δ
ϕ (degrees angle), of the emission signal
[13][14]. Phase readout is a version of LT-based sensing, as Δ
ϕ is related to
τ as
[9]:
where
ν is the modulation frequency of excitation (Hz).
2.2. O2 Sensing Materials
While many different photoluminescent dyes have been suggested for O
2 sensing
[6][8], the dyes currently used in biological applications and O
2 respirometry are phosphorescent Pt(II)-porphyrins (excitation and emission bands are 400/650 nm or 525/650 nm) and Pt(II)-benzoporphyrins (430/760 or 615/760 nm); Ir(III)-porphyrins (390/655 or 525/655 nm)
[15] and fluorescent complexes of Ru(II) (470/615 nm)
[6][7]. These dyes and materials on their basis have appropriate O
2 sensing characteristics, brightness, chemical and photo-stability, commercial availability and price. However, they differ in their spectral and LT characteristics, compatibility with the common sensor matrices (polymers, other materials) and available detection instrumentation. When such an O
2-sensitive dye is embedded in a suitable matrix or microenvironment, it produces sensing material with a characteristic and stable response to O
2.
The main types of sensor materials are (i) solid-state, i.e., water-insoluble, sensors, and (ii) liquid and water-soluble probes. The solid-state sensors are integrated into respirometric systems either as permanent coatings on the inner side of assay vessels
[8] or as small inserts with dot sensor coatings immersed in food packs, homogenates or liquid samples
[16][17]. The coatings usually comprise a hydrophobic dye dissolved in a hydrophobic polymer; they are produced from a precursor ‘cocktail’ with sensor ingredients, dissolving them in organic solvent and spotting on a suitable substrate or assay vessel
[6]. Alternatively, monomeric precursors can be polymerized or cured (e.g., sol-gels, poly(acrylamide), styrene). Multistep, multicomponent fabrication and coating procedures for solid-state sensors are far from trivial, especially when uniform and stable; batch-calibrated and disposable sensors or coated substrates are required by large-scale applications.
Soluble O
2 probes comprise dispensable liquid reagents, which are simply pipetted to aqueous samples in an assay vessel. Such probes are represented by
[6]: (i) small molecule structures, i.e., hydrophilic derivatives of the above phosphors; (ii) macromolecular conjugates, e.g., a reactive derivative of the dyes (e.g., PtCP-NCS) covalently linked to a hydrophilic carrier, such as serum albumin and (iii) stable dispersions of micro- and nanoparticles, such as core–shell nanoparticles of amphiphilic polymers impregnated with hydrophobic dye molecules.
The soluble O
2 probes overcome the challenges of solid-state sensors associated with their fabrication and integration in respirometric substrates and assays. They are better suited for use in high throughput cell-based screening assays of small samples on standard bioassay substrates and equipment (i.e., microrespirometry). However, liquid probes have their own challenges, such as (i) being poorly usable in large samples (costly); (ii) being more susceptible to optical and quenching interferences than ‘shielded’ solid-state sensors and nanoparticles
[18]; (iii) unwanted interactions with cells and surfaces during the assay (e.g., non-specific binding); (iv) long-term storage in liquid form or drying/reconstitution issues and (v) complex synthesis.
2.3. Typical Profiles in Optical O2 Respirometry and Their Analysis
Depending on the sample, assay format and measurement settings, O
2 sensor-based respirometry can produce respiration profiles of different shapes
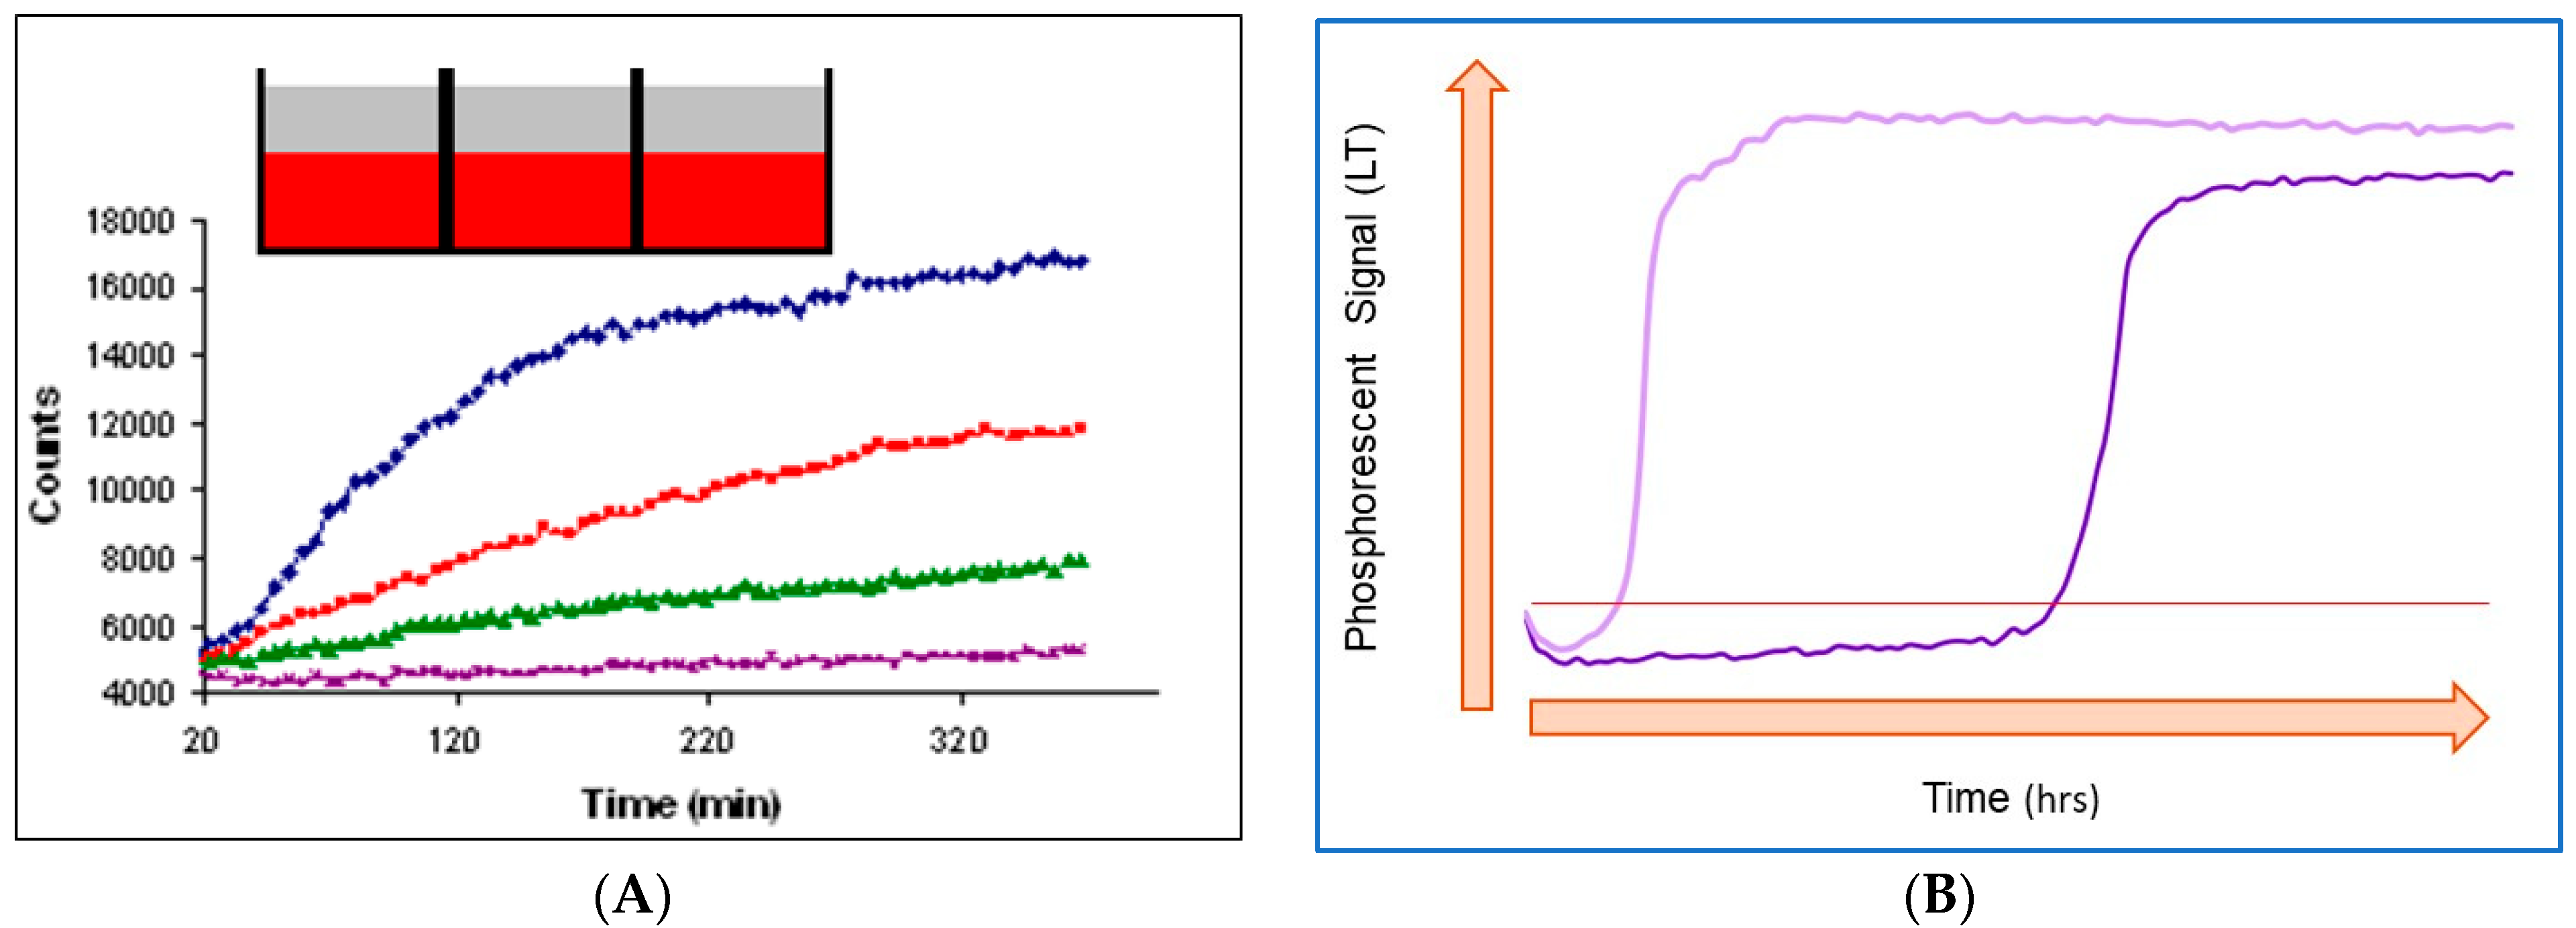
[6][11]. The two main types, characteristic of mammalian cells and bacterial cells, are shown in
Figure 2. It is worth noting though that technically (i.e., by changing assay settings: cell density, timing, etc.), it is possible to convert one type of profile into another. Some ‘special’ formats are also known, such as the monitoring of adherent mammalian cells pre-stained with an intracellular O
2 probe in an open microplate under a steady state
[19].
Figure 2. Typical respiration profiles produced by mammalian cells (A) and bacterial cells (B). Cell numbers are increasing from bottom to top in (A) and from right to left in (B). The inset in (A) shows that samples in microwells are sealed with mineral oil (top layer). The horizontal line in (B) is the signal threshold used to identify threshold time (TT) values (see below).
2.3.1. Mammalian Cell Respiration
Respiration profiles of mammalian cells (and this is true for many other assays with enzymes, microtissue samples or small organisms
[20]) usually have a relatively short time span (5 min–2 h) close to the linear initial part and curved final part with saturation (
Figure 2A)
[6][21]. This shape reflects that the biomass is not changing much during the assay (cell doubling times 24 h) and that the OCR is low and constant.
However, small and weakly respiring samples exposed to ambient air cannot develop O
2 gradients due to the high rate of atmospheric O
2 back-diffusion
[6]. Therefore, for the measurements in standard 96/384-well plates, mineral oil is applied on top of each sample (see inset in
Figure 2A). Such a seal, applied with a pipette or a simple dropper, creates a barrier for ambient O
2 diffusion and also primes the assay
[21]. The same general approach is used in sealable plates
[22], microchamber devices
[23] or fluidic biochips
[24] specially designed for respirometry. Besides the hermetic sealing, these devices also provide a high cell volume-to-sample volume ratio, which facilitates fast, sensitive and accurate OCR measurements
[22].
Usually, the linear part of the respiration profile is used for OCR calculation, for which:
where
vo is the specific respiration activity of a cell,
N is the number of cells being measured and
V is the measurement volume.
Profiles expressed in the [O
2] concentration scale potentially allow for the determination of absolute OCR values (e.g., in pmol/min/cell). Changes in OCR at different time points or O
2 levels can also be assessed from full profiles. However, the sealing efficiency of the measurement chamber, the rate of O
2 back-diffusion and the sensor calibration equation (described above) must be considered. All this leads to complex mathematical models and data processing algorithms for such sensor systems
[25].
Another common approach in respirometric assays is to deal with raw sensor signal (
τ or even I) profiles and corresponding relative OCRs and their changes
[21]. This approach simplifies data processing by avoiding complex modeling and errors brought in by signal conversion and profile transformation.
The temperature has strong effects on cell respiration, sensor signals and response to O
2 (stronger quenching at high temperatures
[9]). So, if samples were prepared on a bench at room temperature and then set for measurements at 37 °C, gradual temperature equilibration of the sample will take place, seen as a downward drift of the sensor signal and skewed respiration profile in the first 15–20 min
[26][27]. If significant, this part of the profile should either be excluded from analysis or eliminated by preparing the plate with samples on a heated stage or pre-incubating at 37 °C prior to the sealing and measurement.
2.3.2. Respiration Profiles of Bacterial Cells and their Characteristic Features
Typical respiration profiles of aerobic bacterial cells shown in
Figure 2B differ considerably from those produced by mammalian cells. These profiles usually span over several hours and have a sigmoidal shape with a steep transition of the sensor signal from low values to high
[28]. Such a shape reflects the steady increase of the biomass (exponential with cell doubling times of 20 min) and respiration rate during the assay.
In the initial phase (flat part on the left side), cell numbers and OCRs are low and cannot change the sample oxygenation state which remains air-saturated. Phase 2 kicks in when the sample reaches a certain cell density, which prompts fast depletion of dissolved O2. This is seen as a steep increase in the sensor signal (I or τ) from the low baseline level to the high level. Once the dissolved O2 is depleted, the signal enters Phase 3, which is also flat but much higher and corresponds to a deoxygenated sample.
The steep transition from the air-saturated state to deoxygenated state upon achieving high CFU and OCR values makes bacterial respirometry more tolerant to back diffusion of atmospheric O
2. For small samples measured in standard microplates, mineral oil sealing is still required, as it makes sensor signals more stable and respiration profiles smoother and less affected by mechanical movements of the plate during reads. Whereas for larger samples measured in plastic tubes, special sealing becomes unnecessary
[28][29]. The liquid sample itself provides a sufficient barrier for O
2 diffusion from the air phase on top of the tube to the bottom part where the sensor is usually placed. Still, rigorous handling, agitation or shaking of samples, which affect their oxygenation and sensor signal, should be avoided during the assay.
The characteristic onset of the sensor signal for samples with a higher initial load of bacteria occurs faster than for samples with a lower cell load (
Figure 2B)
[27]. This is because during Phase 1 and the start of Phase 2, the number of cells in the sample, N, and the OCR continues to increase exponentially over time, while the stock of O
2 is limited:
where
No is the initial (seeding) number of cells,
td is the cell doubling time and t is the current time since the start of the assay.
Of note, low O
2 levels in the sample in Phases 2/3 may trigger other processes, such as (i) inhibition of respiration, i.e., a reduction of
vo; (ii) anoxic cell death reducing the number of respiring cells,
N, and (iii) increased O
2 back-diffusion due to a higher gradient. These factors can alter the classical sigmoidal shape and produce more complex respiration profiles
[18]. However, the initial part of Phase 2 of the profile for which dissolved O
2 levels still remain close to ambient O
2 is usually stable and less affected by such factors. Therefore, it is better suited for analysis (as will be shown below).
Being a rather complex and floating function (Equation (9)), OCRs of microbial samples are less commonly used as assay readouts, whereas the initial load of viable bacteria,
No, which is equivalent to total aerobic viable counts, TVC, is a more useful parameter for many applications.
No and TVC are amenable to simple quantification by O
2 respirometry
[27][30] since they determine the onset time on the respiration profile or the time to reach a certain threshold signal (
TT)
[31]. Such a threshold signal is shown as a red line in
Figure 2B.
Furthermore, it appears that in most TVC assays, sample
TT is linearly related to its log(TVC) value
[27]:
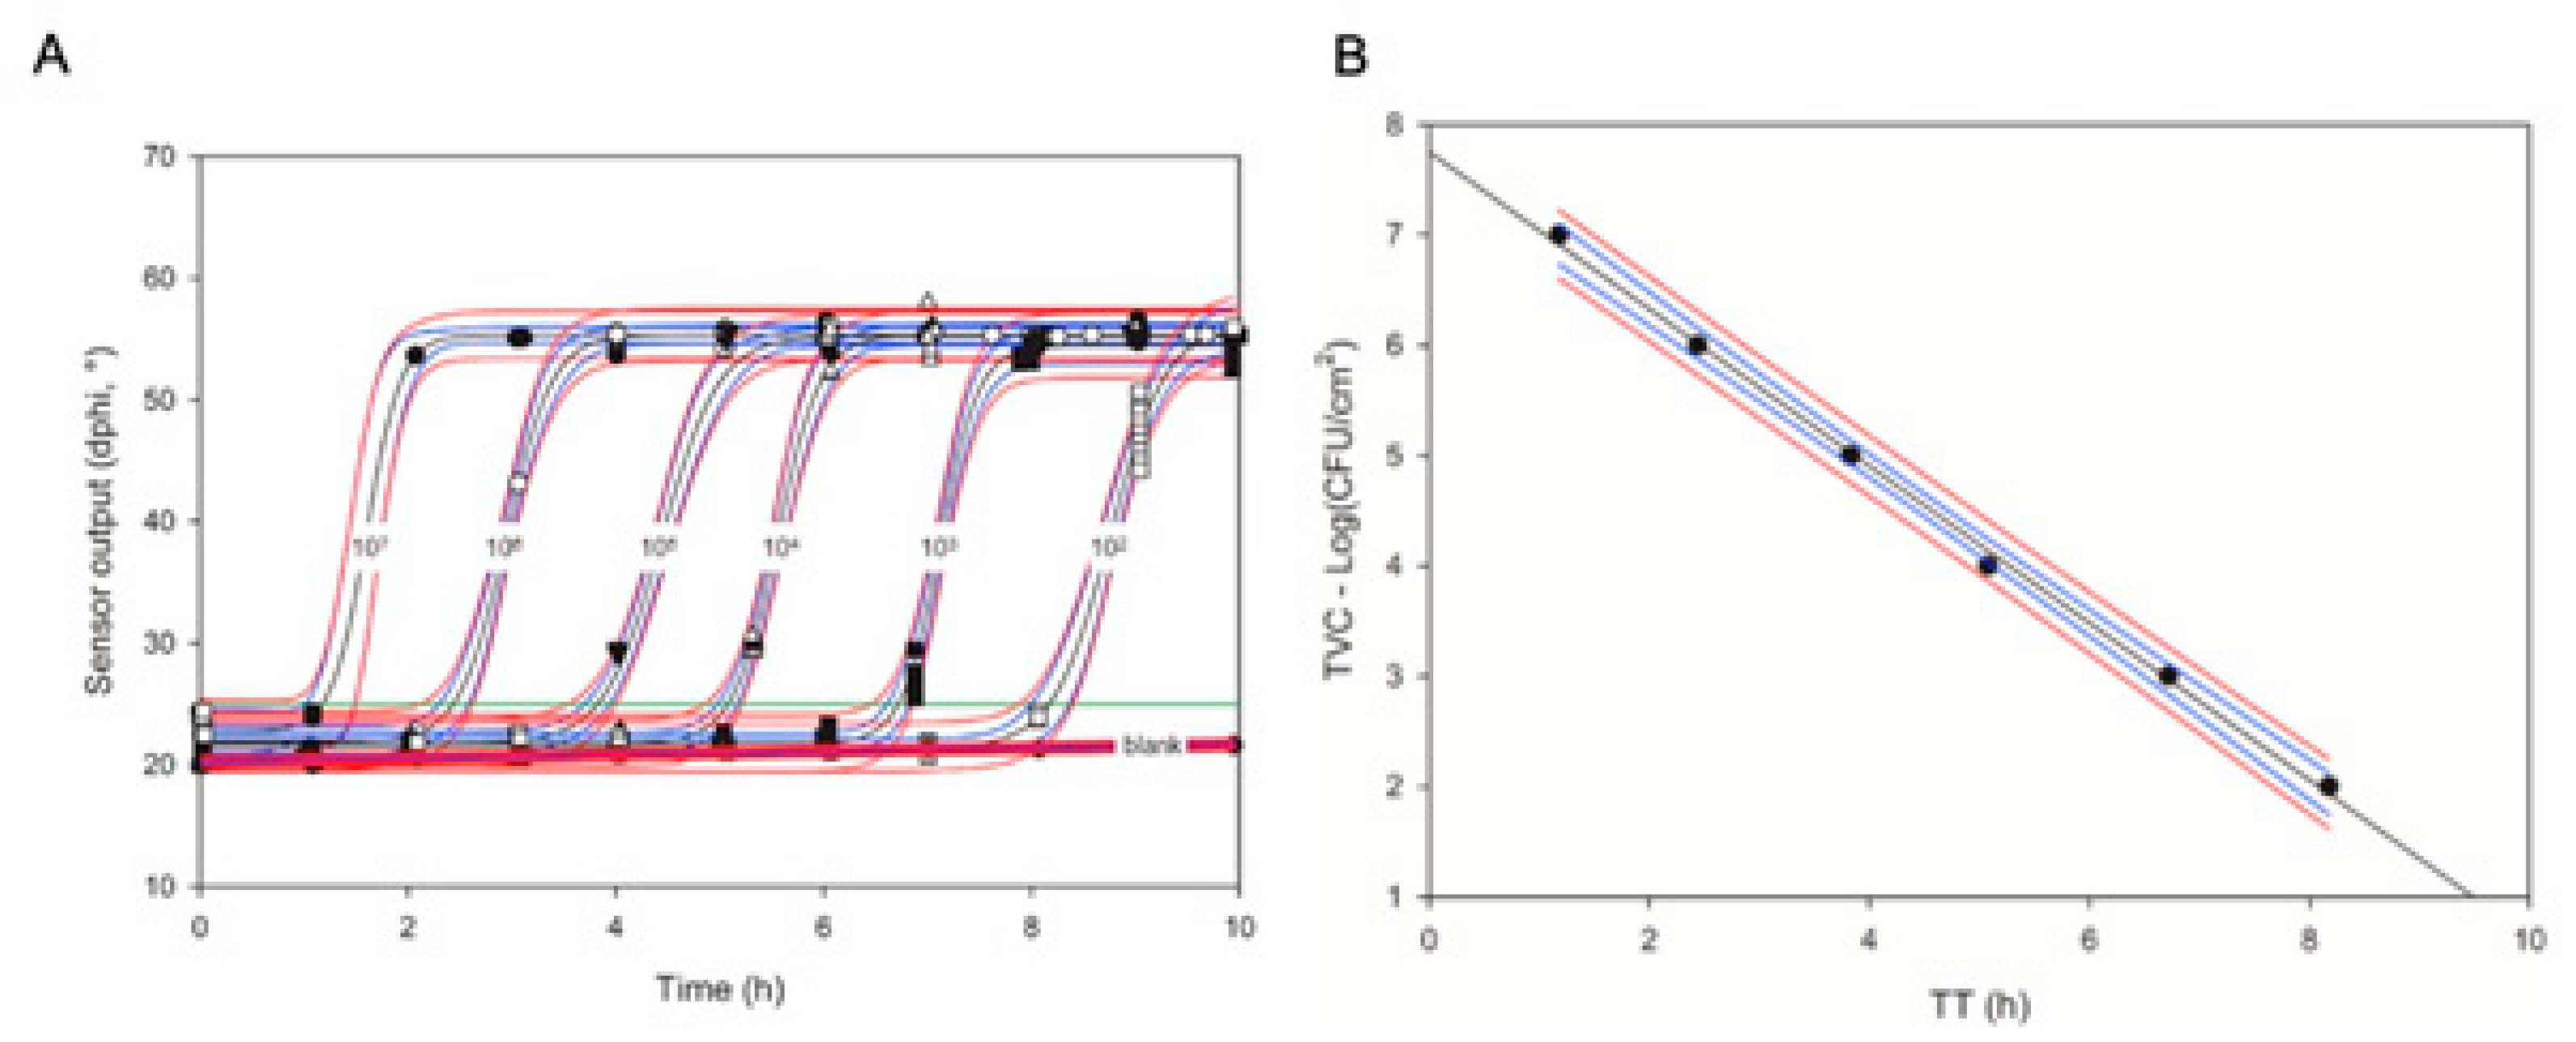
A mathematical equation for such a relationship can be established in a simple, once-off calibration experiment with a set of TVC standards (see
Figure 3 and
[30]). The semi-logarithmic linear relationship between
TT and TVC (Equation (10)) is convenient and works well with various microorganisms and sample types, including crude homogenates of solid food products
[17][30][31][32]). It spans over many Logs of cell concentrations and does not require additional dilutions and re-calibrations. Individual signal readings (τ or Δϕ) and corresponding respiration profiles are stable, reproducible and uniform so that individual sensor readings can be taken at a low frequency (every 20–30 min) and fitted with sigmoidal functions to produce smooth profiles and accurate
TT values
[28].
Figure 3. Respiration profiles of E. coli standards in nutrient broth (NB) media generated in swab sensor vials in 4 replicates (A) and the resulting calibration plot for the TVC assays of swabs (B).
The general procedure of a typical respirometric TVC assay looks as follows:
-
Take sample specimen and put it in assay medium that promotes microbial cell growth; homogenize, if required;
-
Transfer the sample to a measurement chamber and record its sensor signals over time under standard (optimal) assay conditions;
-
Determine (once-off) the optimal threshold sensor signal for these conditions and the recorded respiration profile(s), which accounts for sensor, sample and assay variability and avoids any false-positive or false-negative results;
-
Apply the threshold and determine the corresponding TT value for each profile and sample;
-
Apply the mathematical equation (pre-determined, see above) to convert measured TT values into corresponding cell counts (log (CFU/mL) or log (CFU/g) for each tested sample.
In theory and experimentally, microbial respirometry can detect a single viable cell in a sample
[27]. However, practical sensitivity and LOD (CFU/mL) are limited by several factors: (i) sampling errors due to statistical variation at low cell numbers, (ii) measurement errors due to variability of respiration profiles and
TT values (in repeating experiments); (iii) sample volume and (iv) sample dilutions used. Therefore, larger (and so more representative) samples together with a low dilution factor provide a higher practical sensitivity and lower LOD.
Due to their high sensitivity, respirometric TVC assays based on the determination of
TT values are gaining wide practical use, particularly in low TVC and sterility testing, industrial hygiene, process control, food safety and environmental monitoring
[6][29]. These simple mix-and-measure assays are rapid, cost-efficient and applicable to different types of samples and for many important microbiological and analytical tasks. Their time-to-result is reciprocal to the microbial load: 1–2 h for bacterial loads 10
8–10
6 CFU/mL or 8–10 h for very low TVCs
[28].
Respirometric TVC assays can also provide a simple semi-quantitative assessment of samples with a single end-point read of their sensor signals. In this case, the measurement time point from the start of the assay is calculated from the existing calibration for the given TVC threshold (CFU/mL) and sensor signal threshold (μs, or Δϕ). This method allows the operator to differentiate measured samples into three categories: those with sensor readings below the threshold are graded as negative or ‘clean’; those with readings above the threshold are graded as positive or ‘contaminated’. In addition, if the sensor reading falls close to the threshold, the sample is graded as suspicious and requires further assessment, e.g., another sensor reading. Overall, this gives a useful ‘traffic light system’ for industrial samples (e.g., food, dairy products) with fast testing and a Go/No-Go decision on batch release on the same day or even shift
[31].
Besides the initial load of aerobic viable cells (N
o, TVC or CFU/mL), other parameters also influence the shape of the sample respiration profile and
TT value (Equation (10)). These parameters include (i) the type of cells, their v
o and t
d characteristics and metabolic status; (ii) assay conditions—media, temperature, mass exchange and (iii) other compounds or treatments applied
[33][34]. These parameters can also be assessed by O
2 respirometry.
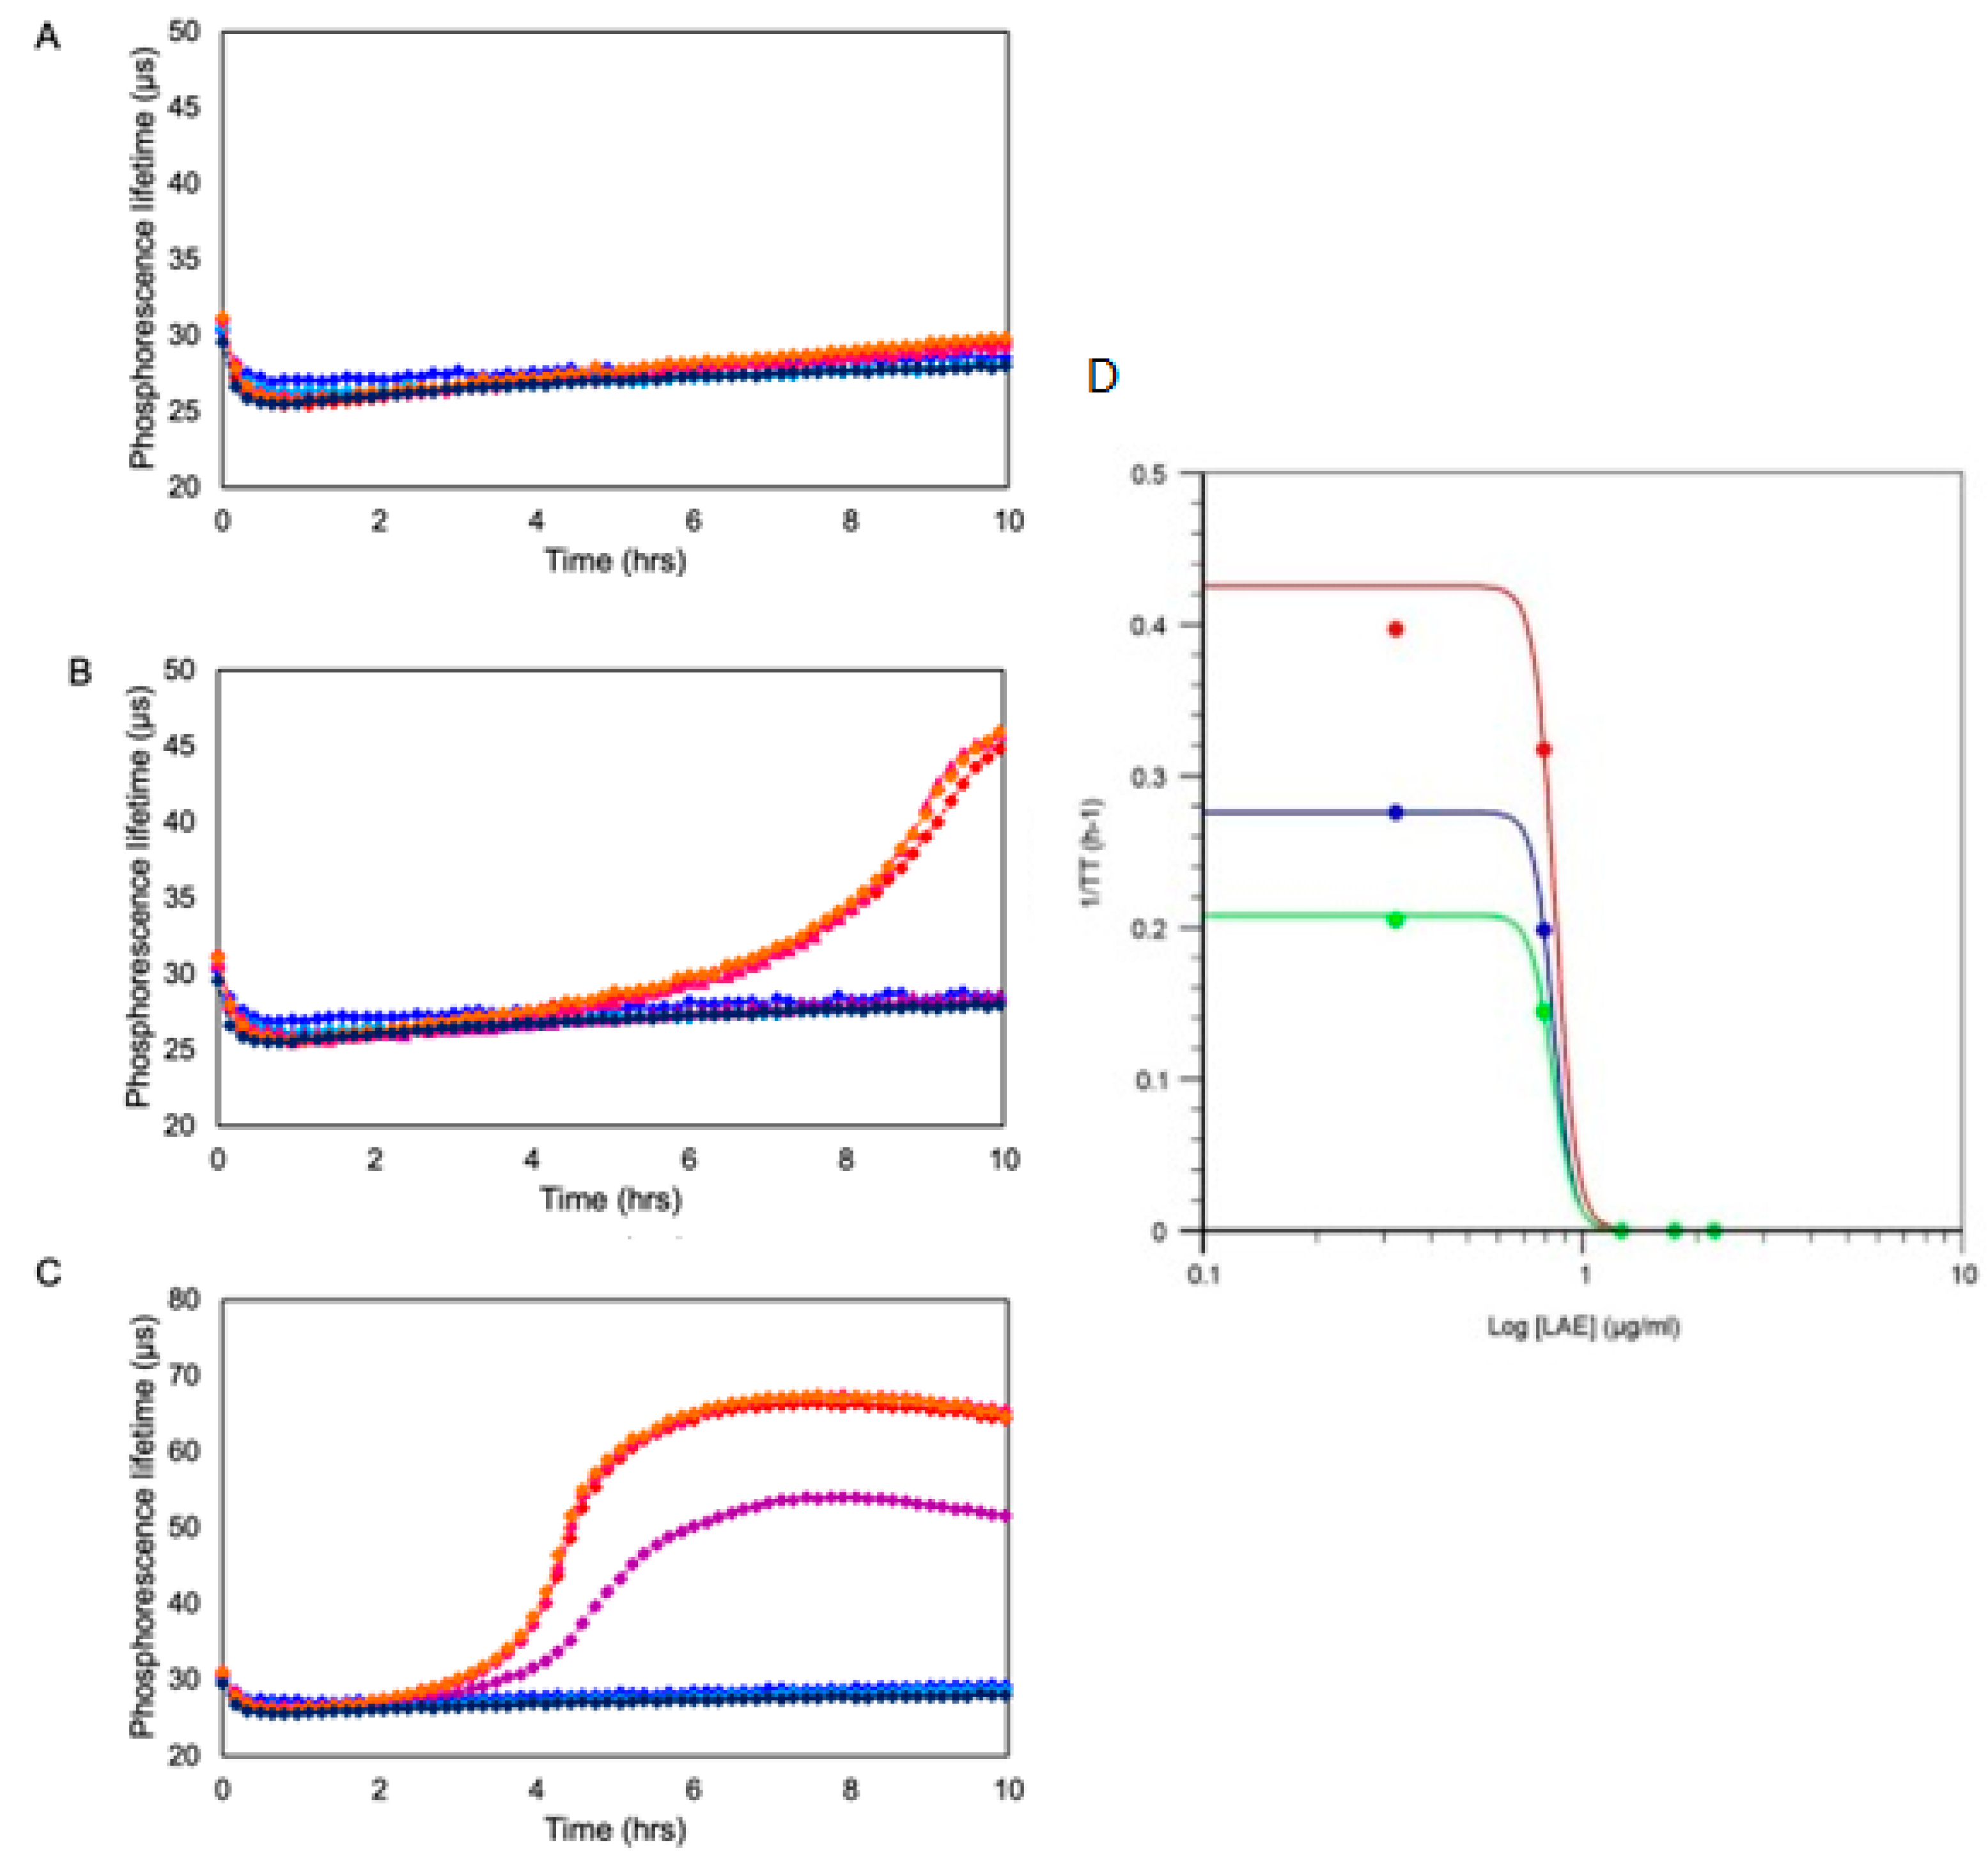
One such application widely used by the industry and research labs is the toxicological screening and profiling of compounds, such as antimicrobials, food additives, drugs and drug formulations and complex environmental samples
[20][33][34]. In such applications, microbial and mammalian cell O
2 respirometry provides fast, quantitative and accurate assessment and determination of compound EC50 or MIC values under various conditions. This in turn gives researchers and food and pharma companies rich information on the mode and mechanism of the toxic action of compounds on cells, including cell specificity, dose and time dependence of toxicity, effects of mixtures and drug formulations (additive synergistic or antagonistic), in a very fast, quantitative and accurate manner. Examples of such data are given in
Figure 4.
Figure 4. Exemplary profiles of toxicity of an antimicrobial compound (LAE) produced by O2 respirometry of Gram-negative bacteria Pseudomonas fluorescens taken at initial concentrations of 104 CFU/mL (A), 105 CFU/mL (B) and 106 CFU/mL (C) in the presence of increasing concentrations of LAE (2.1, 6.3, 18.9, 56.7 and 166.7 µg/mL). Profiles were generated on Platform 4 using MitoXpress probe.
Sensor material type, sensitivity to O2 and calibration function also have an effect on respiration profiles, mostly on the magnitude of signal change. The shape of the profile is less affected if the O2 calibration covers the range 0–21 kPa or 0–200 μM of O2 (Figure 1).
On the other hand, sensor materials can show chemical and photo-toxicity on cells
[35] and thus influence the respirometric assays and measured
TT and OCR values. Conversely, certain chemical ingredients present in complex and even regular growth media may affect the sensor/probe signals
[36]. Thus, several pH indicators, chromogenic substrates, metal ions, surfactants and aromatics present in common selective media were shown to cause optical and quenching interferences
[18]. Such effects, if seen, should be tackled by optimizing the sensor material and assay settings. In this regard, ‘shielded’ solid-state sensors look more favorable than soluble probes
[18].
Generally, the high analytical performance of the sensors, including stable O
2 sensing characteristics, calibration-free operation, no cross-sensitivity, stability to optical and chemical interferences and sample matrix effects and general ruggedness, is key for most applications of respirometry, particularly the measurement of absolute OCRs, TVC testing and safety assessment of food products, process hygiene, antimicrobials and high throughput screenings of new chemical entities, drugs and formulations. Disposable respirometric devices for such applications, including sensor tubes
[28], biosensor sachets and swab vials
[29], which provide calibration-free operation, are becoming popular and abundant. These off-the-shelf devices are usually batch or factory calibrated, quality-controlled and optimized for specific applications and produced in batches of >100 s by the industry and in research labs
[28]. All these features of O
2 sensor-based bacterial respirometry allow it a broad range of applications, many of which are important and unique.
2.4. Existing Formats and Applications of Bacterial Respirometry
Platform 1 was designed by Becton Dickinson for the detection of microbial infections (
Mycobacterium tuberculosis) in blood samples
[37]. Samples were dispensed into sterile measurement vials with liquid growth media and sensor coatings (ruthenium dye in silicone resin) at the bottom, then capped, placed in an incubator rack and monitored for their intensity signals with a fluorescent detector. The system was simple but slow (detection took several days), bulky, specialized for one application and performed qualitative or semi-quantification analysis (growth/no growth, fast/slow). Its low sensitivity and speed were due to the slow-growing test organisms and also air in the vial headspace. A similar system with a fluorescent CO
2 sensor was observed to function more optimally
[37]).
Adaptation of Platform 1 for operation in 96/384-well plates gave rise to Platform 2, called BD Biosensor
[38], which was more flexible and user-friendly and tailored for widely available fluorescent readers. Still, the main settings of Platform 2 were not optimal for quantitative O
2 sensing and respirometry. Its main shortcomings were the silicone - Ru-dye sensor chemistry, intensity-based sensing, no sample sealing, slow response, low sensitivity and biocompatibility unsuitable for adherent cells. Nevertheless, this platform was successfully demonstrated in the screening of bacterial cells and antimicrobials but was later withdrawn from the market.
The Platform 3 OxyDish Sensor Plate
[39] is an improved version of the BD Biosensor with Pt-porphyrin-based sensor coatings in 24/96-well plates. The sensors have better performance and biocompatibility, and the plate operates with a portable multichannel phase detector, which provides stable operation with a quantitative real-time readout of O
2 concentration and simultaneous measurement of multiple samples.
Platform 4 was designed for sensitive multiparametric analysis of adherent mammalian cells using special sealable microwell plates and O
2 and pH sensors on the tips of the pins that go inside the wells and mechanically seal the samples
[25]. While showing excellent performance and usability in various metabolic and bioenergetic studies performed with mammalian cells
[22], Platform 4 is poorly suited for bacterial cell respirometry, as it is overly complicated, inflexible and expensive for basic TVC assays and food applications.
Platform 5, also marketed as MitoXpress
® and GreenLight-960 systems
[21][30][31], comprises a dedicated but flexible DIY (Do-It-Yourself) approach to O
2 respirometry
[34]. It differs from Platforms 1–4 in that it uses:
- (i)
-
A soluble, dispensable O2-sensing probe MitoXpress-Xtra (Agilent) based on a Pt-porphyrin dye instead of the pre-made, solid-state sensor coatings;
- (ii)
-
Standard 96/384-well plates, uncoated, tissue-culture treated and even customized assay substrates
[23];
- (iii)
-
Sealing the samples on the plate with mineral oil;
- (iv)
-
Measuring the plate on a multilabel plater reader in the TRF/RLD mode
[26], thus implementing LT-based O
2 sensing.
In the assay, the medium, samples with cells and the probe are simply dispensed into the wells, covered with mineral oil, placed in a TR-F reader and measured at constant temperature (30 or 37 °C) periodically to generate respiration profiles for each sample. Platform 5 has been demonstrated in many useful applications, including mammalian cell respiration and responses to stimuli
[26], enumeration of bacteria in pure cultures
[27], TVC in complex food and environmental samples
[30], screening of antimicrobials and drugs with EC50 and MIC determination
[34] and metabolic and toxicological profiling of bacteria and environmental samples
[20][33].
Platforms 6–9 rely on disposable plastic substrates (vials, sachets, swab vials) integrated with solid-state O
2 sensitive coatings or inserts based on bright near-infrared dye PtBP
[28][29]. The sensors in assay vessels are interrogated with a portable and low-cost LT-based detector. Platforms 6–9 were developed for TVC testing of complex samples, such as raw meat, mince and other foods (solid and liquid) and their crude homogenates and swabs. They differ in their:
-
Measurement vessels type and size: 2 mL vials for Platform 6, 30–50 mL vials for Platform 7, 15 mL vials with swab brushes for Platform 8 and flexible plastic pouches for Platform 9;
-
Sensor integration method: permanent coatings (dots at vial bottom) for Platforms 6, 7 or on vial side for Platform 8 or small inserts membrane type in Platform 9;
-
Detector type: automated benchtop reader with incubator and carousel for sensor vials (GreenLight-930 in Platform 6) or autonomous handheld reader for in-field operation (Platforms 7–9).
Platform 10—the
ambr system from Sartorius
[40][41]—uses essentially the same sensor chemistry and settings as Platform 3 (OxyPlate). It was designed for rapid development, optimization and up-scaling of industrial biofermentation processes, particularly the high throughput optimization of media composition, conditions of cell growth and product harvesting in small-scale model bioreactors. It is dedicated to achieving maximal rates of cell growth by working at maximal cell densities and expression levels of the target product. Similar to Platform 4, Platform 10 serves rather special niche applications; therefore, it is difficult to characterize it with respect to bacterial cell respirometry and TVC assays. The same is true for the remaining Platforms 11 and 12.
Automated Platforms 1, 2, 4, 6 and 10 provide high throughput (e.g., up to 48 samples per run for Platform 6), while manual Platforms 7–9 can handle up to 20–30 samples per run, which is quite sufficient for on-site TVC testing. TVC assay throughput is limited by sample preparation time, which, for the assays with synchronous measurement of all samples, should be kept below 15 min
[28]. However, sensor measurement takes only 1–3 s per sample or <1 min for the whole batch, so one reader can be used to measure several batches with shifted assay start time.
Additional equipment includes just media and a pipette/dispenser for Platform 6, a simple incubator or block heater for Platforms 7–9 and a heat-sealing machine for Platform 9. Detection equipment for O
2 respirometry is mostly LT based, which provides stable and accurate measurement of sensor signals and resilience to sample matrix effects and optical interferences that may occur in TVC assays
[18]. These features are also aided by the use of indicator dyes with high brightness and longwave spectral characteristics, such as PtBP used in Platforms 3, 6–9 and 11.
2.5. Comparison of O2 Respirometry with Established Microbial Testing Methods
From the previous sections, it is clear that O2 sensor-based respirometry techniques have enabled a range of new bioanalytical applications. The most important and demanding microbiological applications include (i) rapid TVC testing of complex samples, such as food, environmental, clinical samples and swabs; (ii) compound screening and toxicological profiling of antimicrobials, drugs and drug formulations, libraries of mutant cells and culturomics and (iii) sterility and hygiene testing via surface swabs.
The main competitive advantages and operational characteristics of the respirometric TVC assays include:
-
Detection and enumeration of only viable cells via monitoring of their growth.
-
Ultimate single cell sensitivity, broad concentrations range and minimal number of steps.
-
Rapid mix-and-measure assay in liquid media with real-time signal output and time-to-result 1–10 h. Quantitative, accurate and automated.
-
Assays require only disposable sensor vials, a simple sensor reader and an incubator. No special facilities, equipment or skills are needed.
-
Various types of samples can be analyzed: swabs, crude homogenates, food and environmental samples, etc. Sample preparation is the same as in the ISO method.
-
Choice of different sensor materials, assay substrates (microplates, vials, pouches) and detectors.
-
Portable, autonomous, low-cost commercial sensor readers that provide LT-based sensing and low start-up costs for the whole system (from $2000 upwards).
The ‘gold standard’ agar plating TVC methods (ISO 4833-1:2013 and ISO 18593:2018
[42][43]) and respirometry both detect
live aerobic bacteria, but the ISO method uses the growth of colonies on
solid agar media in multiple plates (serial dilutions) and tedious end-point counting. As a result, the ISO test is much slower than respirometry (24–72 h vs. 2–8 h) and is more complex and laborious (dilutions, multiple steps). While applicable to complex samples without major pre-treatment (only homogenization), the ISO test is poorly automated and produces lots of hazardous waste. Both tests allow for the predictive identification of particular bacterial specie using special
selective media
[18], but still, these results require confirmation by molecular methods.
The ATP-BL assay is sensitive (down to 10 cells/mL), simple and fast. The detection step uses one reagent, which provides cell lysis and measurement of the BL signal on a simple instrument. The assay is not selective; it detects mostly viable bacterial cells, but somatic cells and lethally injured bacteria can also contribute to measured ATP signals. Moreover, the relationship between ATP (or BL signal) and TVC is not simple and depends on the sample and cell type. BL detection suffers from matrix effects and requires clear samples (diluted or processed). Therefore, lengthy steps of sample clarification and enrichment are often used
[44][45].
DNA/RNA amplification assays have long and tedious sample preparation steps that include enrichment of target cells, cell lysis and RNA extraction and purification followed by RT-PCR. While providing the best selectivity and identification of specific strains of bacteria, such assays cannot reliably distinguish dead and live cells or provide single-cell sensitivity. They are expensive, prone to matrix effects and false-negative results and require special facilities and equipment. More fast or automated methods, such as qPCR and LAMP, can simplify the assay but only in part. The 16 S rRNA sequencing reports on the whole spectrum of bacterial species present in the sample, but it also includes tedious sample preparation steps, shares similar limitations with the PCR and has moderate sensitivity. O2 respirometry does not have all these limitations, but it does not provide the selectivity of the molecular methods.
The antibody-based TVC assays, such as live cell ELISAs, lateral flow and IMS assays, show selectivity similar to PCR, but lower sensitivity and more prominent matrix effects. Sample preparation and throughput are similar to respirometry, while detection equipment is even simpler (colorimetric, visual or with digital cameras). But again, these methods cannot distinguish between dead and viable cells.
The last group of instrumental techniques—flow cytometry, Raman/SCRS and MS—provide high selectivity (species identification potential) and sensitivity (rarely reaching 1 CFU/mL levels). However, they all require expensive and stationary detection equipment, the corresponding infrastructure (dedicated labs) and trained personnel. The assays also require special sample preparation procedures and data analysis algorithms.
 +1 credit