Your browser does not fully support modern features. Please upgrade for a smoother experience.
Submitted Successfully!
 +1 credit
Thank you for your contribution! You can also upload a video entry or images related to this topic.
For video creation, please contact our Academic Video Service.
| Version | Summary | Created by | Modification | Content Size | Created at | Operation |
|---|---|---|---|---|---|---|
| 1 | João Paulo Teixeira | -- | 2535 | 2023-05-09 08:11:48 | | | |
| 2 | Catherine Yang | Meta information modification | 2535 | 2023-05-09 08:48:36 | | |
Video Upload Options
We provide professional Academic Video Service to translate complex research into visually appealing presentations. Would you like to try it?
Cite
If you have any further questions, please contact Encyclopedia Editorial Office.
Teixeira, F.L.; Costa, M.R.E.; Abreu, J.P.; Cabral, M.; Soares, S.P.; Teixeira, J.P. Electroencephalography in Schizophrenia. Encyclopedia. Available online: https://encyclopedia.pub/entry/44015 (accessed on 24 June 2026).
Teixeira FL, Costa MRE, Abreu JP, Cabral M, Soares SP, Teixeira JP. Electroencephalography in Schizophrenia. Encyclopedia. Available at: https://encyclopedia.pub/entry/44015. Accessed June 24, 2026.
Teixeira, Felipe Lage, Miguel Rocha E Costa, José Pio Abreu, Manuel Cabral, Salviano Pinto Soares, João Paulo Teixeira. "Electroencephalography in Schizophrenia" Encyclopedia, https://encyclopedia.pub/entry/44015 (accessed June 24, 2026).
Teixeira, F.L., Costa, M.R.E., Abreu, J.P., Cabral, M., Soares, S.P., & Teixeira, J.P. (2023, May 09). Electroencephalography in Schizophrenia. In Encyclopedia. https://encyclopedia.pub/entry/44015
Teixeira, Felipe Lage, et al. "Electroencephalography in Schizophrenia." Encyclopedia. Web. 09 May, 2023.
Copy Citation
Electroencephalography (EEG) provides a non-invasive tool for the study of the brain’s temporal and spatial register of electric activity. Schizophrenia is a complex and heterogeneous disease, manifesting deficits that underlie many overlapping pathological mechanisms distributed across multiple brain regions. Patients with schizophrenia have sensory processing deficits and high-level attention-dependent cognitive deficits. These deficits can be assessed by the time-locked EEG activity in stimuli called ERPs and extracting the features. EEG oscillations are considered biomarkers or features of complex states in health and schizophrenia persons. The oscillatory activity of the EEG in schizophrenia patients indicates abnormal temporal integration and interregional connectivity of brain networks during neurocognitive function. EEG signal analysis can be performed in the time, frequency, and time–frequency domains.
schizophrenia
speech
EEG
ERP
1. EEG Features
This section describes the main features that can be used to diagnose schizophrenia with an EEG signal. The spatial position in 64 EEG electrodes can be observed in Figure 1. Additional details about the EEG approach can be found in [1].
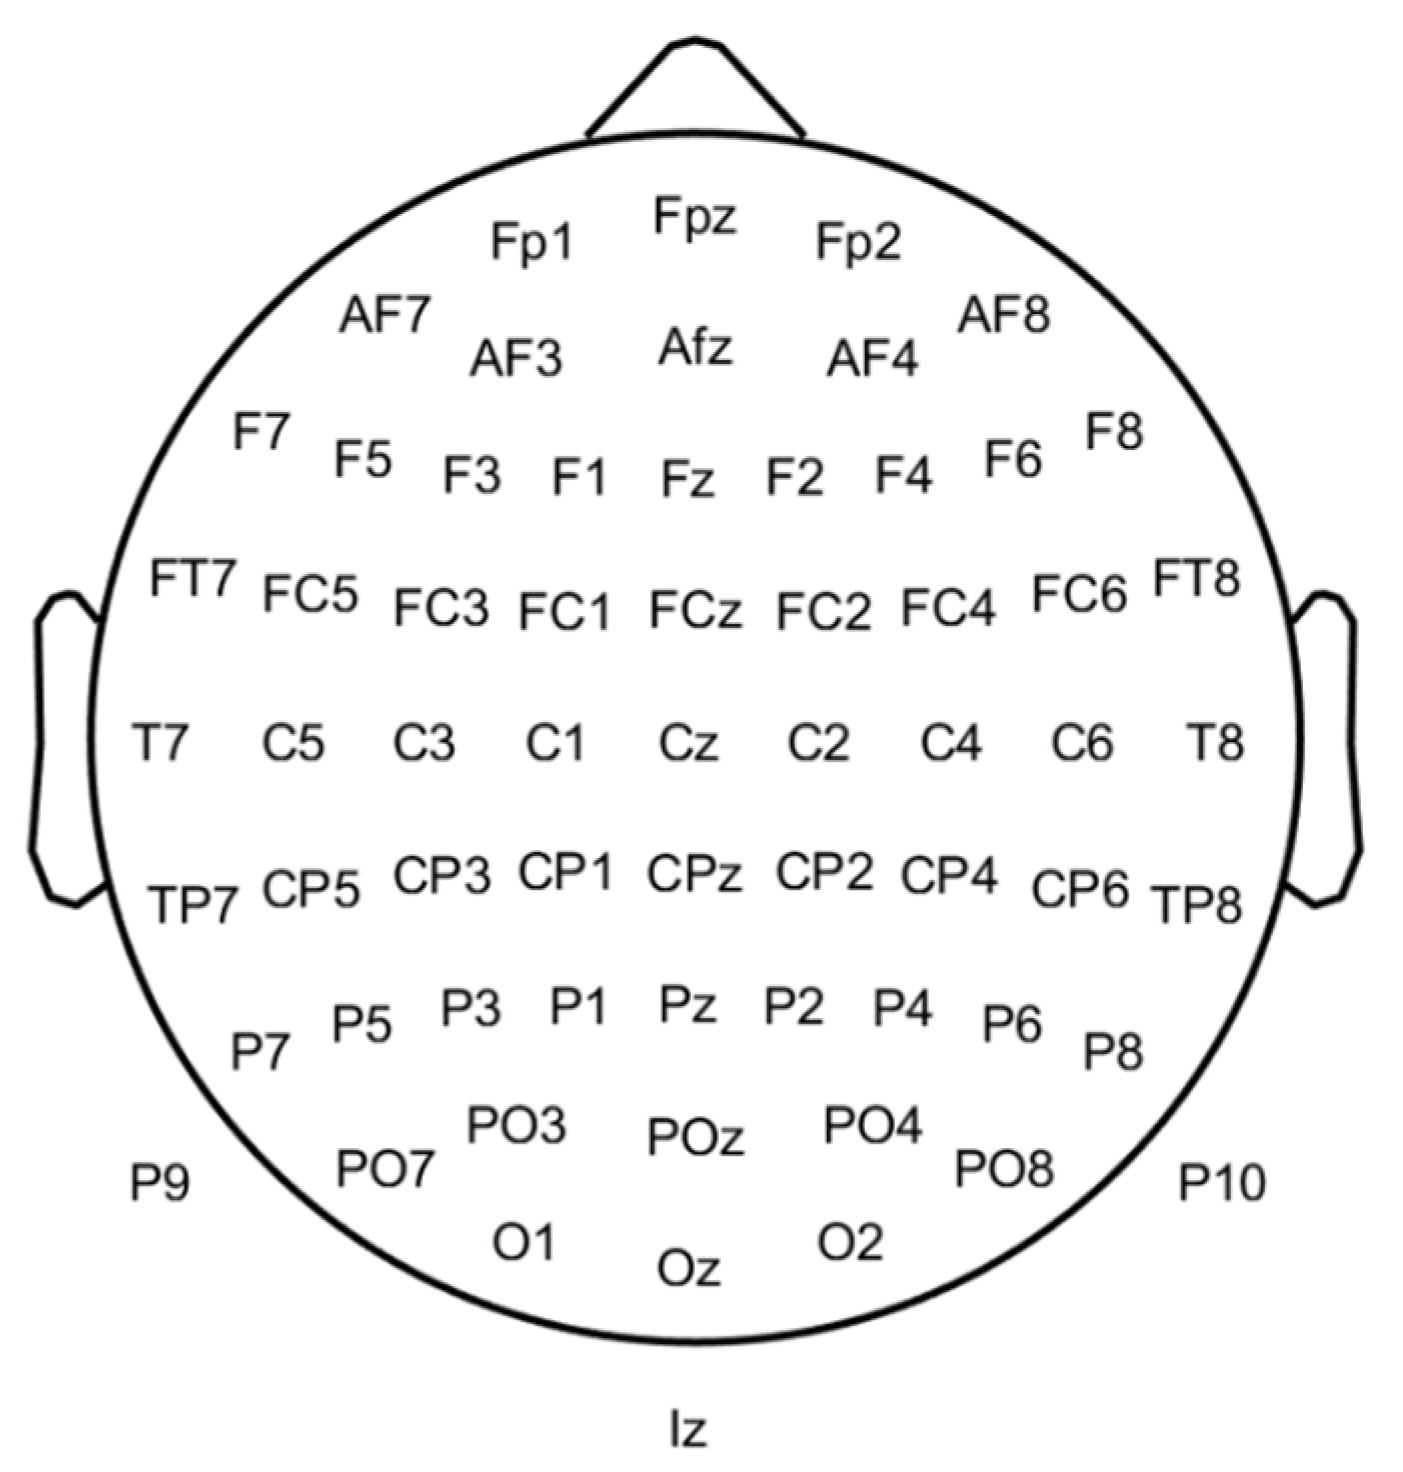
Figure 1. Depiction of the sixty-four electrodes’ layouts on a 2D representation of the scalp.
To explain the underlying abnormalities in patients diagnosed with schizophrenia, a multi-set canonical correlation analysis (MCCA) was performed by [2] to combine functional magnetic resonance imaging (fMRI), EEG, and structural magnetic resonance imaging (sMRI) parameters. In the work of Shim et al. [3], three sets of parameters were used: sensor-level parameters (124 parameters), source-level parameters (314), and a combination of both.
On the other hand, some authors researched something more specific. Bougou et al. [4] focused on the delta and theta bands (0.5–8.5 Hz) by applying a Butterworth, order 5, band-pass filter to study the connectivity. The authors calculated connectivity measures: cross-correlation (COR), quadratic magnitude coherence (COH), imaginary part of quadratic magnitude coherence (iCOH), phase-locked value (PLV), phase-locked index (PLI), p-index (RHO), transfer entropy (TE), mutual information (MI), Granger causality (GC), partial directed coherence (PDC) and directed transfer function (DTF).
Vittala et al. [5] used transcranial magnetic stimulation (TMS) combined with EEG to alter and measure the neurophysiological parameters of cortical function, including oscillatory activity, cortical inhibition, connectivity, and synchronization.
Using the nonlinear features, including complexity (Cx), Higuchi fractal dimension (HFD), and Lyapunov exponents (Lya), the authors of [6] increased the prediction of a schizophrenia classifier up to 100%. With the decomposition of the EEG into wavelets of six levels (thus creating seven sub-bands), it is also possible to diagnose subjects with schizophrenia with a high accuracy [7].
Based on the phase space dynamics (PSD) of EEG signals C, it can be confirmed that the PSD shape of the Cz channel (Figure 1) in schizophrenia is more regular than in healthy people and can be applied as a biomarker. Via graphical analysis, it is also possible to identify schizophrenia. The PSD maps of signals from the EEG to a higher dimensional space, and the features to be used are extracted with (up to) 19 channels. Generally, the PSD of EEG signals is a suitable technique for discriminating between healthy and schizophrenic groups. Furthermore, the Cz channel is better than other channels at detecting schizophrenia using the PSD of EEG signals [8].
According to Akbari et al. [8], the best accuracy (94.8%) is obtained with graphical features, namely, the summation of distances between Heron’s circular (SDHC), the summation of the shortest distance from each point relative to the 45-degree line (SH45), and the summation of the area of the triangles making successive points and the coordinate center (TACR), as obtained from 12 channels. This procedure was performed by using the phase space dynamic (PSD) of EEG signals. First, the PSD of two EEG signals was plotted on Cartesian space, and then graphical features were extracted to evaluate the chaotic behavior of PSD based on healthy and schizophrenic subjects. The PSD of EEG signals can be transferred to successive triangles. By averaging the coordinates of the corners of each triangle, the centroid coordinate of the triangle is obtained, and it is the same as the centroid of the corresponding Heron’s circle. The SDHC quantifies the variability of the PSD. It can be used to evaluate the complexity of PSD. The SH45 measures the width of the PSD shape from the bisector of the first and third trigonometric regions, and TACR measures the variation rate of the PSD shape of EEG signals [8].
Baygin et al. [9] proposed a model for the automatic detection of schizophrenia based on Collatz conjectures (Collatz conjecture is a mathematical model used in information security applications) using EEG. This model can generate features, is highly accurate, and requires little time to run, allowing it to achieve a 99.47% correct classification. This model comprises three stages. The first consists of a new feature generation with Collatz Conjecture, named the Collatz pattern. Combining the Collatz pattern and the maximum absolute pooling decomposer creates new multilevel features (low-level and high-level features). The second step involves applying the iterative neighborhood components analysis to select the clinically significant features. The last step consists of choosing features fed to the K-nearest neighbors (KNN) classifier for the automated detection of schizophrenia [9].
The hit rates for identifying schizophrenia conditions using EEG parameters range from 82.36% [4] to 100% [6]. Using EEG parameters, the authors of [9] applied a combination of techniques and KNN classifiers, achieving the classification accuracy of 99.47% and 93.58% in two datasets using 19 and 10 channels, respectively. Using various Machine Learning tools such as Support Vector Machine and the leave-one-out cross-validation training procedure, the authors of [6] correctly classified 88.24% of the cases. Random Forest classifier with Direct Transfer Function obtained a correct classification of 82.36% in the work of [4]. The authors of [8] used KNN and a generalized regression neural network (GRNN) and achieved 94.8% accuracy. The maximum accuracy was obtained with a probabilistic neural network (PNN) reaching 100%.
2. Description of EEG Features
This section describes the previously mentioned EEG feature details.
The cross-correlation (COR) corresponds to a measure of the similarity of two series as a function of the displacement of one relative to the other and the quadratic magnitude coherence (COH) between two variables, corresponding to the cross-spectral density function, which is derived from the FFT of cross-correlation normalized by their individual auto-spectral density functions. The imaginary part of the quadratic magnitude coherence (iCOH) is derived by keeping only the imaginary part of the complex numbers, which is the coherence [4].
The phase-locked value (PLV) characterizes the phase synchronization between two narrow-band signals, and the phase-locked index (PLI) is a measure of phase-lock that is zero in the case of linear mixing and nonzero when there is a consistent nonzero phase difference between the two signals. The p-index (RHO) quantifies the deviation of the cyclic relative phase distribution from the uniform distribution, approximating the probability density by the relative frequencies obtained with histograms of relative phases [4].
The transfer entropy (TE) measures the time-asymmetric transfer of information between two processes. Mutual information (MI) quantifies the amount of information that can be obtained about a random variable by observing another. Granger causality (GC) states that, for two simultaneously measured signals, one can predict the first signal better by incorporating the past information from the second signal than when only using information from the first signal. The directed transfer function (DTF) is similar to Granger causality but uses the elements of a different transfer matrix [4].
Complexity (Cx) consists of numerical information that is transformed into symbolic information after distinct words are created by decomposing symbolic sequences [6], which are encoded by the length of L(n). This feature can be defined by Equation (1):
The Higuchi fractal dimension (HFD) measures the self-similarity and irregularity of a time series. This feature is estimated using the slope of the linear fit over the log–log plot of the size and scales of the time series. The range of values is between 1 and 2. The Lyapunov exponents (Lya) show the average growing ratio of the primary distance between two neighboring points in the phase space [6]. Equation (2) can calculate this feature:
where the distance between the point at time 0 is defined by ∥δXi(0)∥ and the point at time t is defined by ∥δXi(t)∥.
The phase space dynamics (PSD) of EEG signals can be transferred to successive triangles by averaging the coordinates of corners of each triangle ((ai, ai+1),(ai+1, ai+2),(ai+2, ai+3)), by which it is possible to obtain the centroid coordinate of the triangle. This coordinate is the same as that of Heron’s circle. The summation of distances between Heron’s circle (SDHC) [8] is computed as a graphical feature and is defined by Equation (3):
The summation of the shortest distance from each point relative to the 45-degree line (SH45) quantifies the data scatter rate around the 45-degree line. The SH45 measures the width of the PSD shape from the bisector of the first and third trigonometric regions, known as a line y = x [8]. It can be described by Equation (4):
The summation of the area of the triangles making successive points and the coordinate center (TACR) measures the variation rate of the PSD shape of the EEG signal [8]. The TACR is defined by Equation (5):
3. ERP Biomarkers in Schizophrenia
The EEG activity time-locked to stimuli is denominated event-related potentials (ERPs). ERPs are commonly used to capture neural activity related to sensory processes and consist of the averaged neural activity upon the repeated presentation of the same stimulus [10].
While studying the brain’s response to stimuli, participants might elicit spontaneous and involuntary neural activity during any moment of the recording. The neural response to stimuli is highly sensitive to the subject’s attention, the presence of motor acts, and inner thoughts, introducing random segments of activity in the signal that might even overshadow the targeted response. Conversely, the neural activity evoked by that particular stimulus will always be present at the moment of its presentation. Consequently, the spontaneous and variable activity will be filtered out by averaging activity across trials with the same stimulus, whereas the signal phase-locked to stimuli onset will become evident [11].
ERPs are widely used in EEG analysis since they are relatively simple to compute. Furthermore, classifiers are rarely used. To discriminate them, more straightforward statistical methods, such as Analysis of Variance (ANOVA), are often enough and constitute the majority of the methods used for this type of EEG analysis. As a result, the results presented here for using ERPs to diagnose schizophrenia are reported from the statistically significant differences found in both the latency and amplitude of these ERPs when comparing healthy subjects and patients to the diagnosis of schizophrenia within the mentioned studies.
In many cases, the auditory task (hearing a beep) is used to measure the cognitive decline in schizophrenia with ERP waveform alteration and reduced activity in specific cortical regions in schizophrenia [12]. Figure 2 represents the main ERP biomarkers.
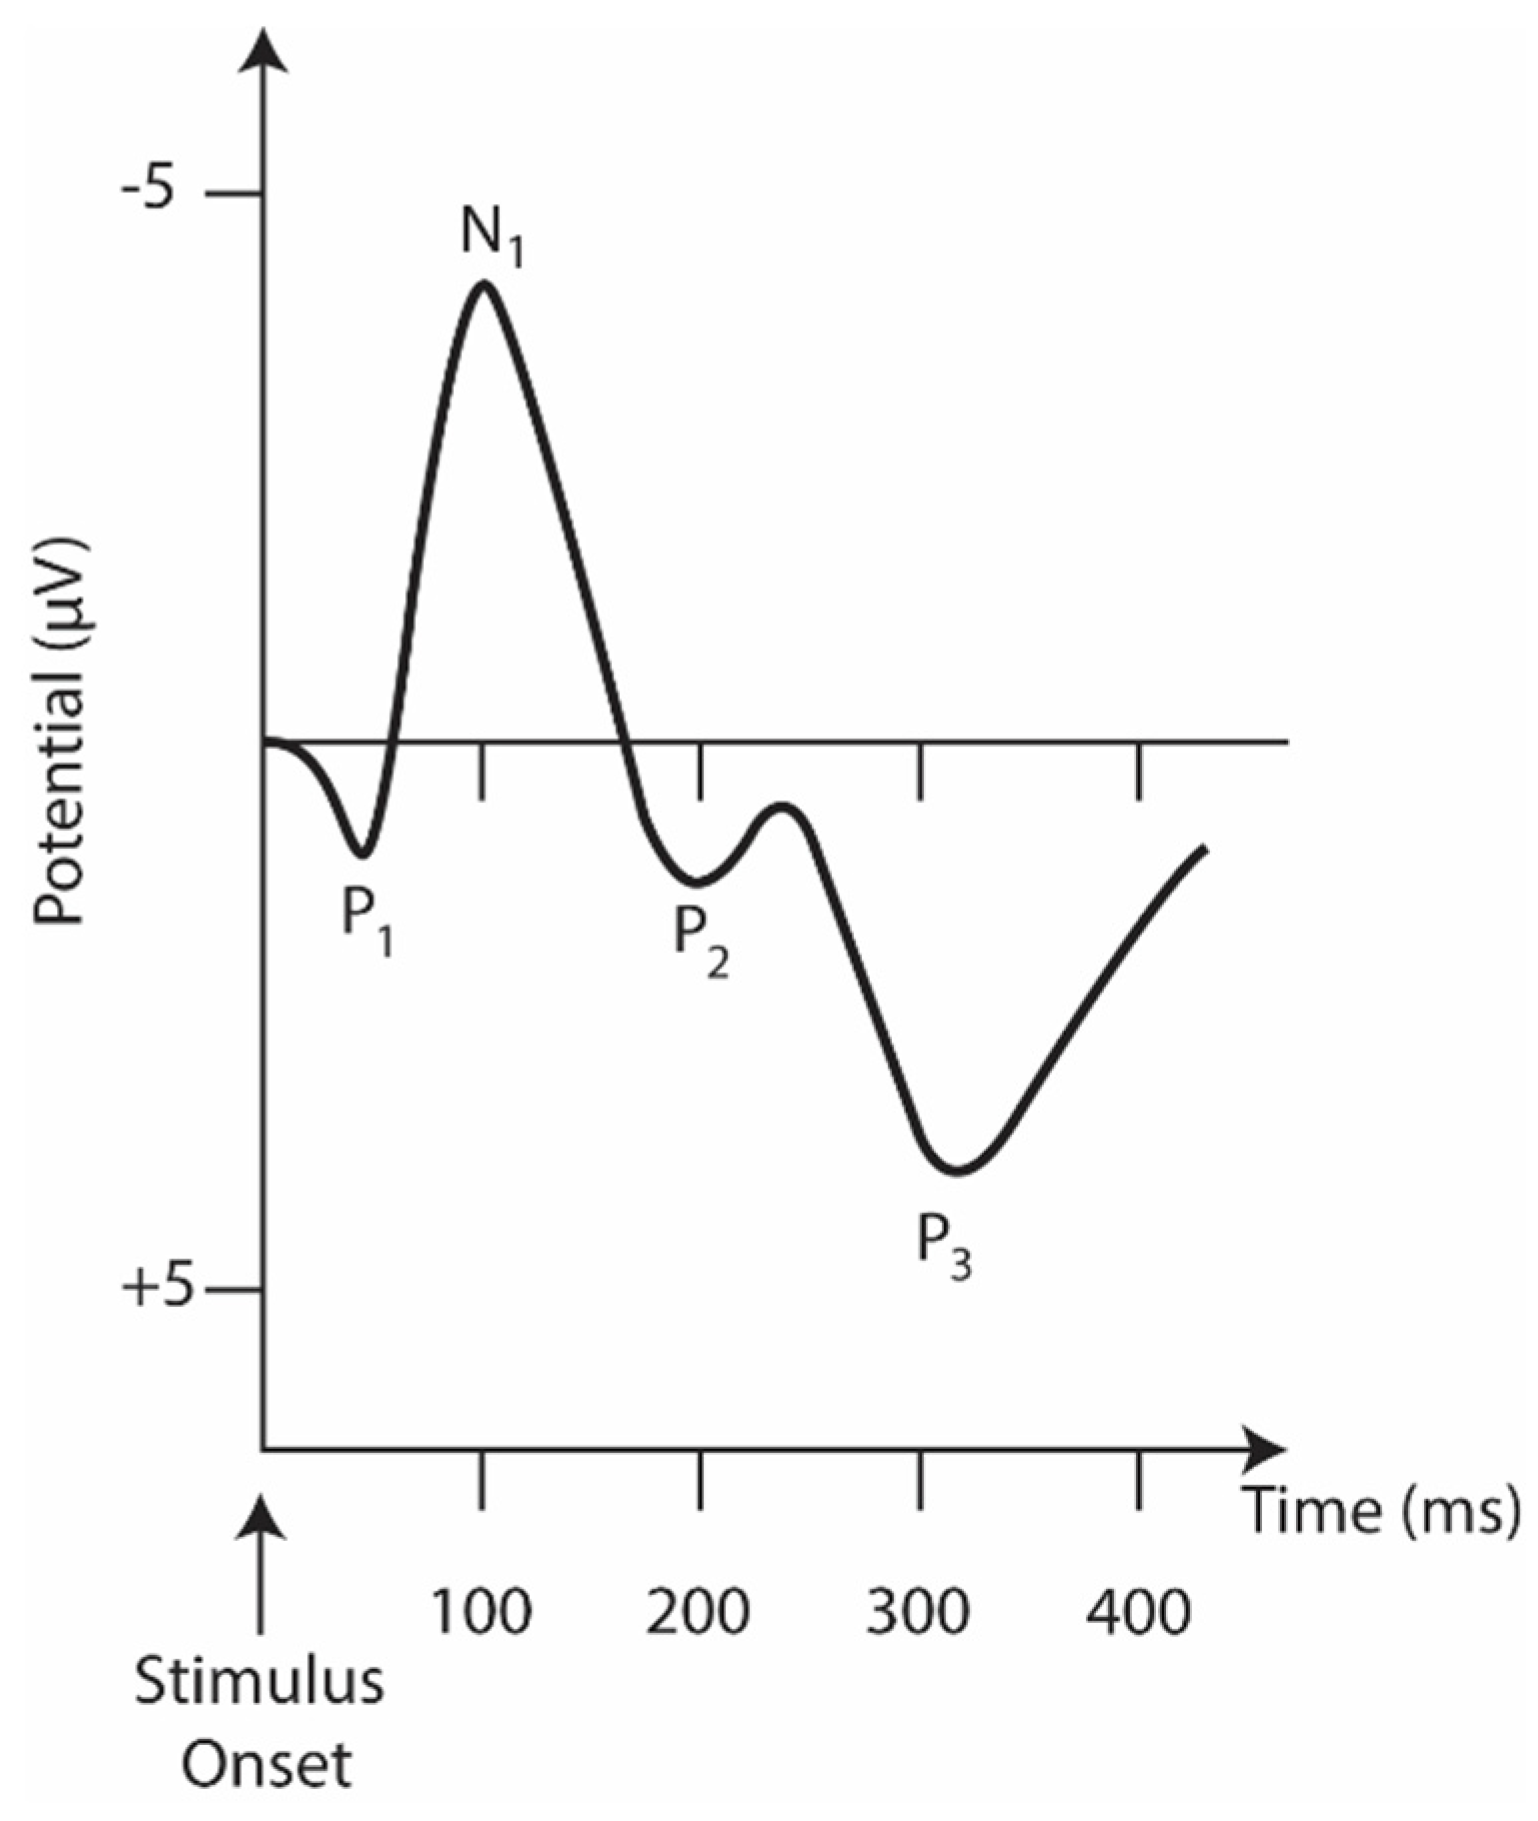
Figure 2. The idealized auditory ERP response is recorded at the head’s vertex. The y-axis is inverted where positive peaks are pointed downwards and negative peaks are pointed upwards.
Mismatch negativity (MMN) is a component of ERP or an event-related magnetic field (ERMF) that occurs in response to unexpected and rare stimuli in the surrounding environment. It is considered an important parameter for neuropsychiatric disorders and for schizophrenia, in particular [13].
The N1 component consists of a negative deflection at about 100 ms [14]. It is evident when an unexpected stimulus is presented [15]. A reduced N1 amplitude during vowel vocalization compared to passive listening and directed inner speech compared to a silent condition is seen in controls but not in patients [16][17].
Of the various ERPs (Figure 2), the components P50 (or Pa), N1, MMN, and P3 have received the most attention, as they are reliably impaired in schizophrenia and are, therefore, considered the most promising biomarker data [1].
The P50 (or Pa) is the earliest and smallest ERP component in auditory amplitude, reaching a general positive peak between 40 and 75 ms [18]. It is used to measure sensory switching using a conditioning test paradigm that involves the repeated presentation of a pair of auditory stimuli, S1 (condition) and S2 (test). The increased amplitude measurement (S2/S1) in patients is well established in the literature [19] and is related to their inability to filter the incoming flow of information and protect the brain from information overload [20]. Although its association with neuropsychological processes is still ambiguous [21], the P50 and S2 amplitude ratios have been linked to performance and attention [22]. In addition, P50 suppression impairment seems to be present in the risk phase, the prodromal phase, and the first episode [23].
The P3 component reflects information processing associated with attention and memory mechanisms [1]. For auditory stimuli, it consists of a positive peak deflection of 250–400 ms in adulthood [15]. Still, its latency and amplitude vary significantly depending on biological factors (e.g., genetics, intelligence, age, and smoking status, among others) [1]. A P3 component is triggered during oddball tasks in which multiple stimuli are presented and one of them occurs infrequently. A fair amount of research involves this ERP component as a P3 amplitude deficit, especially when evoked by auditory stimuli [24]. This is considered the most consistent and robust finding in schizophrenia [24][25][26].
Mismatch Negativity (MMN), typically generated 100 to 250 ms after stimulus onset, can be used as an objective index of sound discrimination accuracy and auditory sensory memory [1]. It is generated by the brain’s automatic response to any change in auditory stimulation that exceeds a specific threshold, roughly corresponding to the behavioral discrimination threshold [1]. Impoverished MMN production, reflected in attenuated amplitudes, is also a consistent finding in schizophrenia [27]. Interest is growing in studying MMN impairment with more complex paradigms (e.g., multiple sensory dimensions, complex sounds, and changes in stimulation patterns). These complex paradigms activate more complex brain regions as opposed to simpler deviations (e.g., pitch, duration, and intensity) that activate lower levels of the auditory system [28].
Although both ERPs share common mechanisms, MMN and P3 most likely portray different dysfunctions in schizophrenia.
Recent studies [28] indicate that MMN deficits generated during auditory tasks contribute to 18.7% of the variance in P3 deficits when both are examined. This proves that the high-level attention-dependent cognitive deficits central to schizophrenia do not originate from potentially preceding impairments at lower sensory, perceptual, or cognitive processing levels [24].
Some works used temporal, demographic, and time-frequency features of EEG. Zhang et al. [10] employed temporal features N1, N1TD, P2, P2TD (TD is time duration), and an EEG baseline as well as demographic (education and age) and temporal frequency features (power spectrum). These features were taken from an EEG-ERP with 9 electrodes: Fz, FCz, Cz, FC3, FC4, C3, C4, CP3, and CP4 (see Figure 1).
Kim et al. [29] used microstate and conventional EEG features extracted from five regions of interest (ROI): left anterior (Fp1, F7, and F3), right anterior (Fp2, F4, and F8), left posterior (T7, C3, P7, P3, and O1), right posterior (C4, T8, P4, P8, and O2), and central (Fz, Cz, and Pz) (see Figure 1). However, ERPs allow healthy and schizophrenic subjects’ discrimination based on P3, MMN, or N1 biomarkers and resting state signal complexity. Statistical measures or oscillatory power are also successful [30].
References
- Kappenman, E.S.; Luck, S.J. The Oxford Handbook of Event-Related Potential Components; Oxford University Press: Cambridge, UK, 2012; ISBN 9780199940356.
- Sui, J.; Castro, E.; He, H.; Bridwell, D.; Du, Y.; Pearlson, G.D.; Jiang, T.; Calhoun, V.D. Combination of FMRI-SMRI-EEG data improves discrimination of schizophrenia patients by ensemble feature selection. In Proceedings of the 36th Annual International Conference of the IEEE Engineering in Medicine and Biology Society EMBC 2014, Chicago, IL, USA, 26–30 August 2014; pp. 3889–3892.
- Shim, M.; Hwang, H.J.; Kim, D.W.; Lee, S.H.; Im, C.H. Machine-learning-based diagnosis of schizophrenia using combined sensor-level and source-level EEG features. Schizophr. Res. 2016, 176, 314–319.
- Bougou, V.; Mporas, I.; Schirmer, P.; Ganchev, T. Evaluation of eeg connectivity network measures based features in schizophrenia classification. In Proceedings of the International Conference on Biomedical Innovations and Applications, BIA 2019, Varna, Bulgaria, 8–9 November 2019; pp. 2019–2022.
- Vittala, A.; Murphy, N.; Maheshwari, A.; Krishnan, V. Understanding Cortical Dysfunction in Schizophrenia with TMS/EEG. Front. Neurosci. 2020, 14, 1–7.
- Goshvarpour, A.; Goshvarpour, A. Schizophrenia diagnosis using innovative EEG feature-level fusion schemes. Australas. Phys. Eng. Sci. Med. 2020, 43, 227–238.
- Sharma, M.; Acharya, U.R. Automated detection of schizophrenia using optimal wavelet-based l1 norm features extracted from single-channel EEG. Cogn. Neurodyn. 2021, 15, 661–674.
- Akbari, H.; Ghofrani, S.; Zakalvand, P.; Sadiq, M.T. Schizophrenia recognition based on the phase space dynamic of EEG signals and graphical features. Biomed. Signal Process. Control 2021, 69, 102917.
- Baygin, M.; Yaman, O.; Tuncer, T.; Dogan, S.; Barua, P.D.; Acharya, U.R. Automated accurate schizophrenia detection system using Collatz pattern technique with EEG signals. Biomed. Signal Process. Control 2021, 70, 102936.
- Zhang, L. EEG signals feature extraction and artificial neural networks classification for the diagnosis of schizophrenia. In Proceedings of the 2020 IEEE 19th International Conference on Cognitive Informatics & Cognitive Computing (ICCI*CC), Beijing, China, 26–28 September 2020; pp. 68–75.
- Lett, T.A.; Voineskos, A.N.; Kennedy, J.L.; Levine, B.; Daskalakis, Z.J. Treating working memory deficits in schizophrenia: A review of the neurobiology. Biol. Psychiatry 2014, 75, 361–370.
- Parlikar, R.; Bose, A.; Venkatasubramanian, G. Schizophrenia and corollary discharge: A neuroscientific overview and translational implications. Clin. Psychopharmacol. Neurosci. 2019, 17, 170–182.
- Harms, L.; Michie, P.T.; Näätänen, R. Criteria for determining whether mismatch responses exist in animal models: Focus on rodents. Biol. Psychol. 2016, 116, 28–35.
- Shen, C.L.; Chou, T.L.; Lai, W.S.; Hsieh, M.H.; Liu, C.C.; Liu, C.M.; Hwu, H.G. P50, N100, and P200 Auditory Sensory Gating Deficits in Schizophrenia Patients. Front. Psychiatry 2020, 11, 868.
- Sur, S.; Sinha, V. Event-related potential: An overview. Ind. Psychiatry J. 2009, 18, 70.
- Ford, J.M.; Mathalon, D.H.; Heinks, T.; Kalba, S.; Faustman, W.O.; Roth, W.T. Neurophysiological evidence of corollary discharge dysfunction in schizophrenia. Am. J. Psychiatry 2001, 158, 2069–2071.
- Ford, J.M.; Mathalon, D.H.; Kalba, S.; Whitfield, S.; Faustman, W.O.; Roth, W.T. Cortical responsiveness during inner speech in schizophrenia: An event-related potential study. Am. J. Psychiatry 2001, 158, 1914–1916.
- Khare, S.K.; Bajaj, V.; Siuly, S.; Sinha, G.R. Classification of Schizophrenia Patients through Empirical Wavelet Transformation Using Electroencephalogram Signals; IOP Publishing: Bristol, UK, 2020; ISBN 9780750332798.
- Bramon, E.; McDonald, C.; Croft, R.J.; Landau, S.; Filbey, F.; Gruzelier, J.H.; Sham, P.C.; Frangou, S.; Murray, R.M. Is the P300 wave an endophenotype for schizophrenia? A meta-analysis and a family study. Neuroimage 2005, 27, 960–968.
- Moran, Z.D.; Williams, T.J.; Bachman, P.; Nuechterlein, K.H.; Subotnik, K.L.; Yee, C.M. Spectral decomposition of P50 suppression in schizophrenia during concurrent visual processing. Schizophr. Res. 2012, 140, 237–242.
- Sánchez-morla, E.M.; Luis, J.; Aparicio, A.; García-jiménez, M.Á.; Soria, C.; Arango, C. Neuropsychological correlates of P50 sensory gating in patients with schizophrenia. Schizophr. Res. 2013, 143, 102–106.
- Toyomaki, A.; Hashimoto, N.; Kako, Y.; Tomimatsu, Y.; Koyama, T.; Kusumi, I. Different P50 sensory gating measures reflect different cognitive dysfunctions in schizophrenia. Schizophr. Res. Cogn. 2015, 2, 166–169.
- Brockhaus-Dumke, A.; Schultze-Lutter, F.; Mueller, R.; Tendolkar, I.; Bechdolf, A.; Pukrop, R.; Klosterkoetter, J.; Ruhrmann, S. Sensory Gating in Schizophrenia: P50 and N100 Gating in Antipsychotic-Free Subjects at Risk, First-Episode, and Chronic Patients. Biol. Psychiatry 2008, 64, 376–384.
- Van Der Stelt, O.; Frye, J.; Lieberman, J.A.; Belger, A. Impaired P3 Generation Reflects High-Level and Progressive Neurocognitive Dysfunction in Schizophrenia. Arch. Gen. Psychiatry 2004, 61, 237–248.
- Bramon, E.; Rabe-Hesketh, S.; Sham, P.; Murray, R.M.; Frangou, S. Meta-analysis of the P300 and P50 waveforms in schizophrenia. Schizophr. Res. 2004, 70, 315–329.
- Neuhaus, A.H.; Hahn, E.; Hahn, C.; Ta, T.M.T.; Opgen-Rhein, C.; Urbanek, C.; Dettling, M. Visual P3 amplitude modulation deficit in schizophrenia is independent of duration of illness. Schizophr. Res. 2011, 130, 210–215.
- Umbricht, D.; Krljesb, S. Mismatch negativity in schizophrenia: A meta-analysis. Schizophr. Res. 2005, 76, 1–23.
- Avissar, M.; Xie, S.; Vail, B.; Lopez-Calderon, J.; Wang, Y.; Javitt, D.C. Meta-analysis of mismatch negativity to simple versus complex deviants in schizophrenia. Schizophr. Res. 2018, 191, 25–34.
- Kim, K.; Duc, N.T.; Choi, M.; Lee, B. EEG microstate features for schizophrenia classification. PLoS ONE 2021, 16, 1–21.
- Silva, C.A.C.; Pinheiro, A.P. Advanced EEG-based learning approaches to predict schizophrenia: Promises and pitfalls. Artif. Intell. Med. 2021, 114, 102039.
More
Information
Subjects:
Engineering, Biomedical
Contributors
MDPI registered users' name will be linked to their SciProfiles pages. To register with us, please refer to https://encyclopedia.pub/register
:
View Times:
1.9K
Revisions:
2 times
(View History)
Update Date:
09 May 2023
Table of Contents


Notice
You are not a member of the advisory board for this topic. If you want to update advisory board member profile, please contact office@encyclopedia.pub.
OK
Confirm
Only members of the Encyclopedia advisory board for this topic are allowed to note entries. Would you like to become an advisory board member of the Encyclopedia?
Yes
No
${ textCharacter }/${ maxCharacter }
Submit
Cancel
Back
Comments
${ item }
|
${ item.createdUser.fullName }
${ item.createdAt }
${ item.vote }
${ item.reply }
Delete
${ reply.createdUser.fullName }
${ reply.createdAt }
${ reply.vote }
Delete
There is no reply to this comment~
${ item.replyTextCharacter }/${ item.replyMaxCharacter }
Submit
Cancel
More
No more~
There is no comment~
${ textCharacter }/${ maxCharacter }
Submit
Cancel
${ selectedItem.replyTextCharacter }/${ selectedItem.replyMaxCharacter }
Submit
Cancel
Confirm
Are you sure to Delete?
Yes
No