Your browser does not fully support modern features. Please upgrade for a smoother experience.
Submitted Successfully!
 +1 credit
Thank you for your contribution! You can also upload a video entry or images related to this topic.
For video creation, please contact our Academic Video Service.
| Version | Summary | Created by | Modification | Content Size | Created at | Operation |
|---|---|---|---|---|---|---|
| 1 | Charles Helmstetter | -- | 2788 | 2023-05-03 17:29:06 | | | |
| 2 | Rita Xu | -10 word(s) | 2778 | 2023-05-04 04:29:24 | | |
Video Upload Options
We provide professional Academic Video Service to translate complex research into visually appealing presentations. Would you like to try it?
Cite
If you have any further questions, please contact Encyclopedia Editorial Office.
Helmstetter, C.E. B, C and D in Escherichia coli. Encyclopedia. Available online: https://encyclopedia.pub/entry/43711 (accessed on 29 June 2026).
Helmstetter CE. B, C and D in Escherichia coli. Encyclopedia. Available at: https://encyclopedia.pub/entry/43711. Accessed June 29, 2026.
Helmstetter, Charles E.. "B, C and D in Escherichia coli" Encyclopedia, https://encyclopedia.pub/entry/43711 (accessed June 29, 2026).
Helmstetter, C.E. (2023, May 03). B, C and D in Escherichia coli. In Encyclopedia. https://encyclopedia.pub/entry/43711
Helmstetter, Charles E.. "B, C and D in Escherichia coli." Encyclopedia. Web. 03 May, 2023.
Copy Citation
The basic properties of the Escherichia coli duplication process can be defined by two time periods: C, the time for a round of chromosome replication, and D, the time between the end of a round of replication and cell division. Given the durations of these periods, the pattern of chromosome replication during the cell cycle can be determined for cells growing with any doubling time.
cell cycle
synchronous cells
chromosome replication
1. Introduction
Upon completion of the requirements for a PhD in biophysics at the University of Chicago in 1961, I had the honor to have the diploma handed to me by George Wells Beadle, the newly installed president of the university, recent Nobel laureate and one of the first acclaimed researchers in molecular genetics. The work of Beadle and Edward Tatum, and their demonstration of the one gene–one enzyme hypothesis [1], was a prominent topic in genetics courses at the time. Since that time, I have had the opportunity to read several essays by and about George Beadle and have, as a consequence, become interested in his approach to the study of science. As is described below, my scientific journey followed a similar path, although with a decidedly less consequential outcome. I suspect that many of us may have followed similar paths during the course of the work. However, before discussing that issue, another aspect of Beadle’s thinking about science should be mentioned. He began his contribution to Phage and the Origins of Molecular Biology [2] by writing: “I have often thought how much more interesting science would be if those who created it told how it really happened, rather than reported it logically and impersonally, as they often do in scientific papers. This is not easy, because of normal modesty and reticence, reluctance to tell the whole truth, and protective tendencies toward others”.
My primary interest in Beadle’s work concerns the story behind his long-term effort to investigate the gene–enzyme paradigm [3][4][5] due to its correspondence with the similar search for a way to determine the relationship between chromosome replication and cell division in E. coli. He and Tatum studied the fruit fly, Drosophila, in an attempt to understand the gene–enzyme relationship by searching for enzymatic reactions controlled by known genes. This continued for about five years without success. Then, one day, while listening to a lecture by Tatum, he apparently suddenly realized that the best and easiest approach was to conduct the experiments in reverse, that is, to search for genes that controlled known chemical reactions. He realized that experiments of this type could be conducted quite easily by X- or UV-irradiating Neurospora, with which he was already familiar, and then by simply selecting and characterizing those mutants that could no longer grow on a minimal medium. It only took 5 months to obtain the first set of nutritional mutants. It was not long before hundreds of mutants with requirements for specific nutrients were generated, thereby producing evidence for the “one gene–one enzyme” hypothesis. Recently, Strauss [5] suggested that the true significance of this work by Beadle and Tatum may be overlooked. They were awarded their Nobel Prize “for their discovery that genes act by regulating definite chemical events”.
2. Cell Age at the Initiation of Chromosome Replication
2.1. E. coli K-12 and B/r
The average durations of C and D, as well B, the time between cell division and the initiation of replication by the single chromosome in slow-growing cells, have been measured in numerous strains of E. coli. I have used some of these data to examine the timing of the initiation of chromosome replication as a function of generation time (τ). Although this may be an unusual method for analyzing the durations of cell cycle periods, it yields interesting information that might not be obvious otherwise. This was accomplished by calculating the “set number”, defined as the generations between the start of a round of replication and the division after the end of that round [6], given by (C + D)/τ. The set numbers were then used to determine average age at initiation (ai) by subtracting the fractional part of the set number from 1.0 [6]. Figure 1A shows a collation of calculated set numbers and average ages at the initiation of replication for several K-12 and B/r strains grown in batch and chemostat cultures at 37 °C using data for C and D determined by flow cytometry [7][8][9][10][11]. As expected, the set numbers, and thus, the ages changed continuously throughout the period of rapid growth when the generation time was less than (C + D) for all strains, and a B period appeared when it was longer than (C + D). During very slow growth, there was minimal change in age at the initiation of replication. An interesting observation is that the initiation age immediately after τ = C + D varied considerably in different strains. (C + D) increased in all strains after τ became longer than the duration of (C + D) during rapid growth, but this occurred at different rates. In some strains, it increased in correlation with τ, such that the initiation age remained close to 0 for a time before a significant B period appeared (Figure 1B, inset). Ascribing any significance to the strain differences in durations of (C + D) requires additional data. Fortunately, some early studies with strain B/r are useful in this regard.
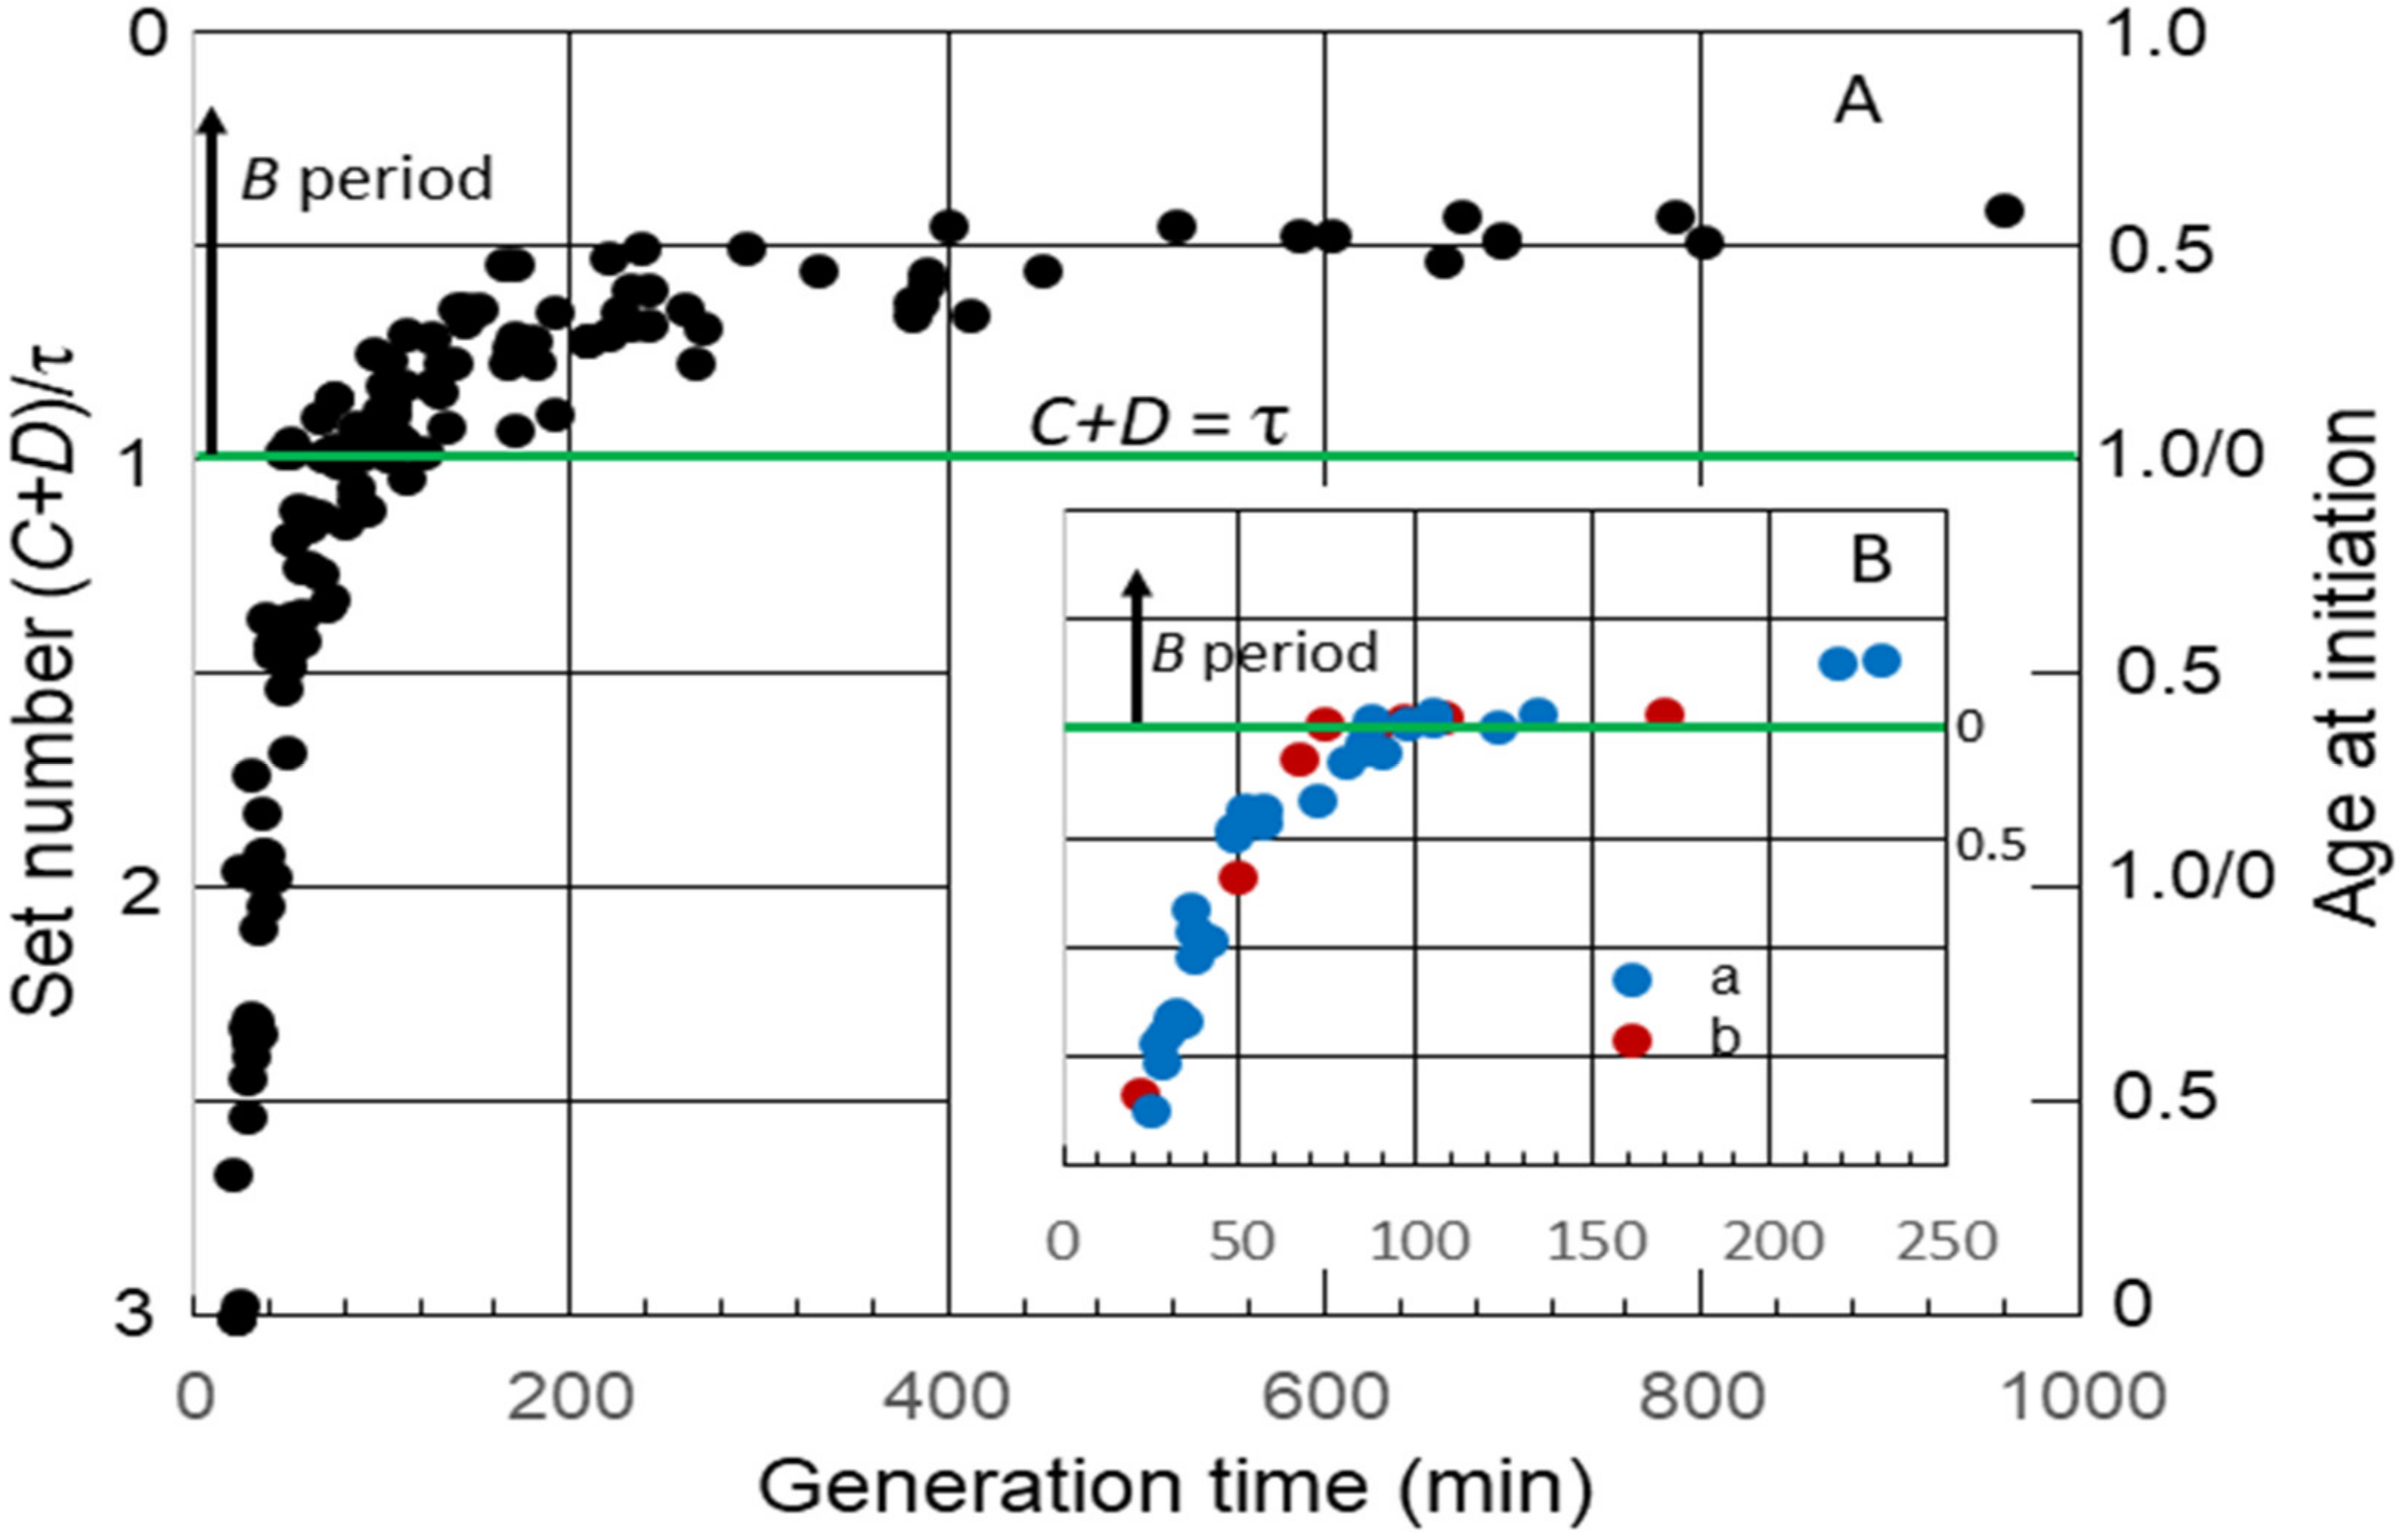
Figure 1. Set numbers and cell ages at the initiation of chromosome replication in E. coli growing with various generation times. (A) Collation of both set numbers and ages at the initiation of replication for seven strains of E. coli K-12 and three strains of B/r. The green horizontal line in this and the subsequent figures shows age at initiation of replication when C + D is equal to the generation time, i.e., the initiation of replication at division in daughter cells containing a single chromosome. At longer generation times, there is a gap between division and initiation, relating to the B period above the green line. (B) Age at the initiation of replication versus generation time for: a: K-12 NJ24 and b: K-12 GM1655.
2.2. Age at the Initiation of Chromosome Replication in E. coli B/r A, F and K
As indicated above, the baby machine technique was developed using E. coli B/r A as the experimental organism. Although researchers were eventually able to use K-12 strains in the technique [12], the original procedure functioned poorly with K-12. If I had not stumbled upon B/r A in the beginning, the technique might not have been developed, and the work might have taken an entirely different direction. For the first 15 years, all of the work was performed exclusively with B/r A, including the work Cooper and I published in 1968 [6][13][14]. Eventually two additional B/r strains were used, B/r F from Ole Maaløe via James Friesen, and B/r K from Herbert Kubitschek. To summarize some of the interesting findings reported over the years using strain B/r and to introduce the possibility that continuing investigations with this strain might prove to be enlightening.
The relationships between average ages at the initiation of chromosome replication and generation times for E. coli B/r A, F, and K observed in the experiments [15] are shown in Figure 2. B periods began to appear in strains B/r F and K when the generation time became equal to (C + D) min, or shortly thereafter. On the other hand, a B period was not detected in B/r A, at least between the generation times of 65 and 120 min. During this interval, it appeared that age at initiation remained basically constant just before cell division, at or near the end of the D period, meaning that (C + D) and τ were increasing at nearly the same rate.
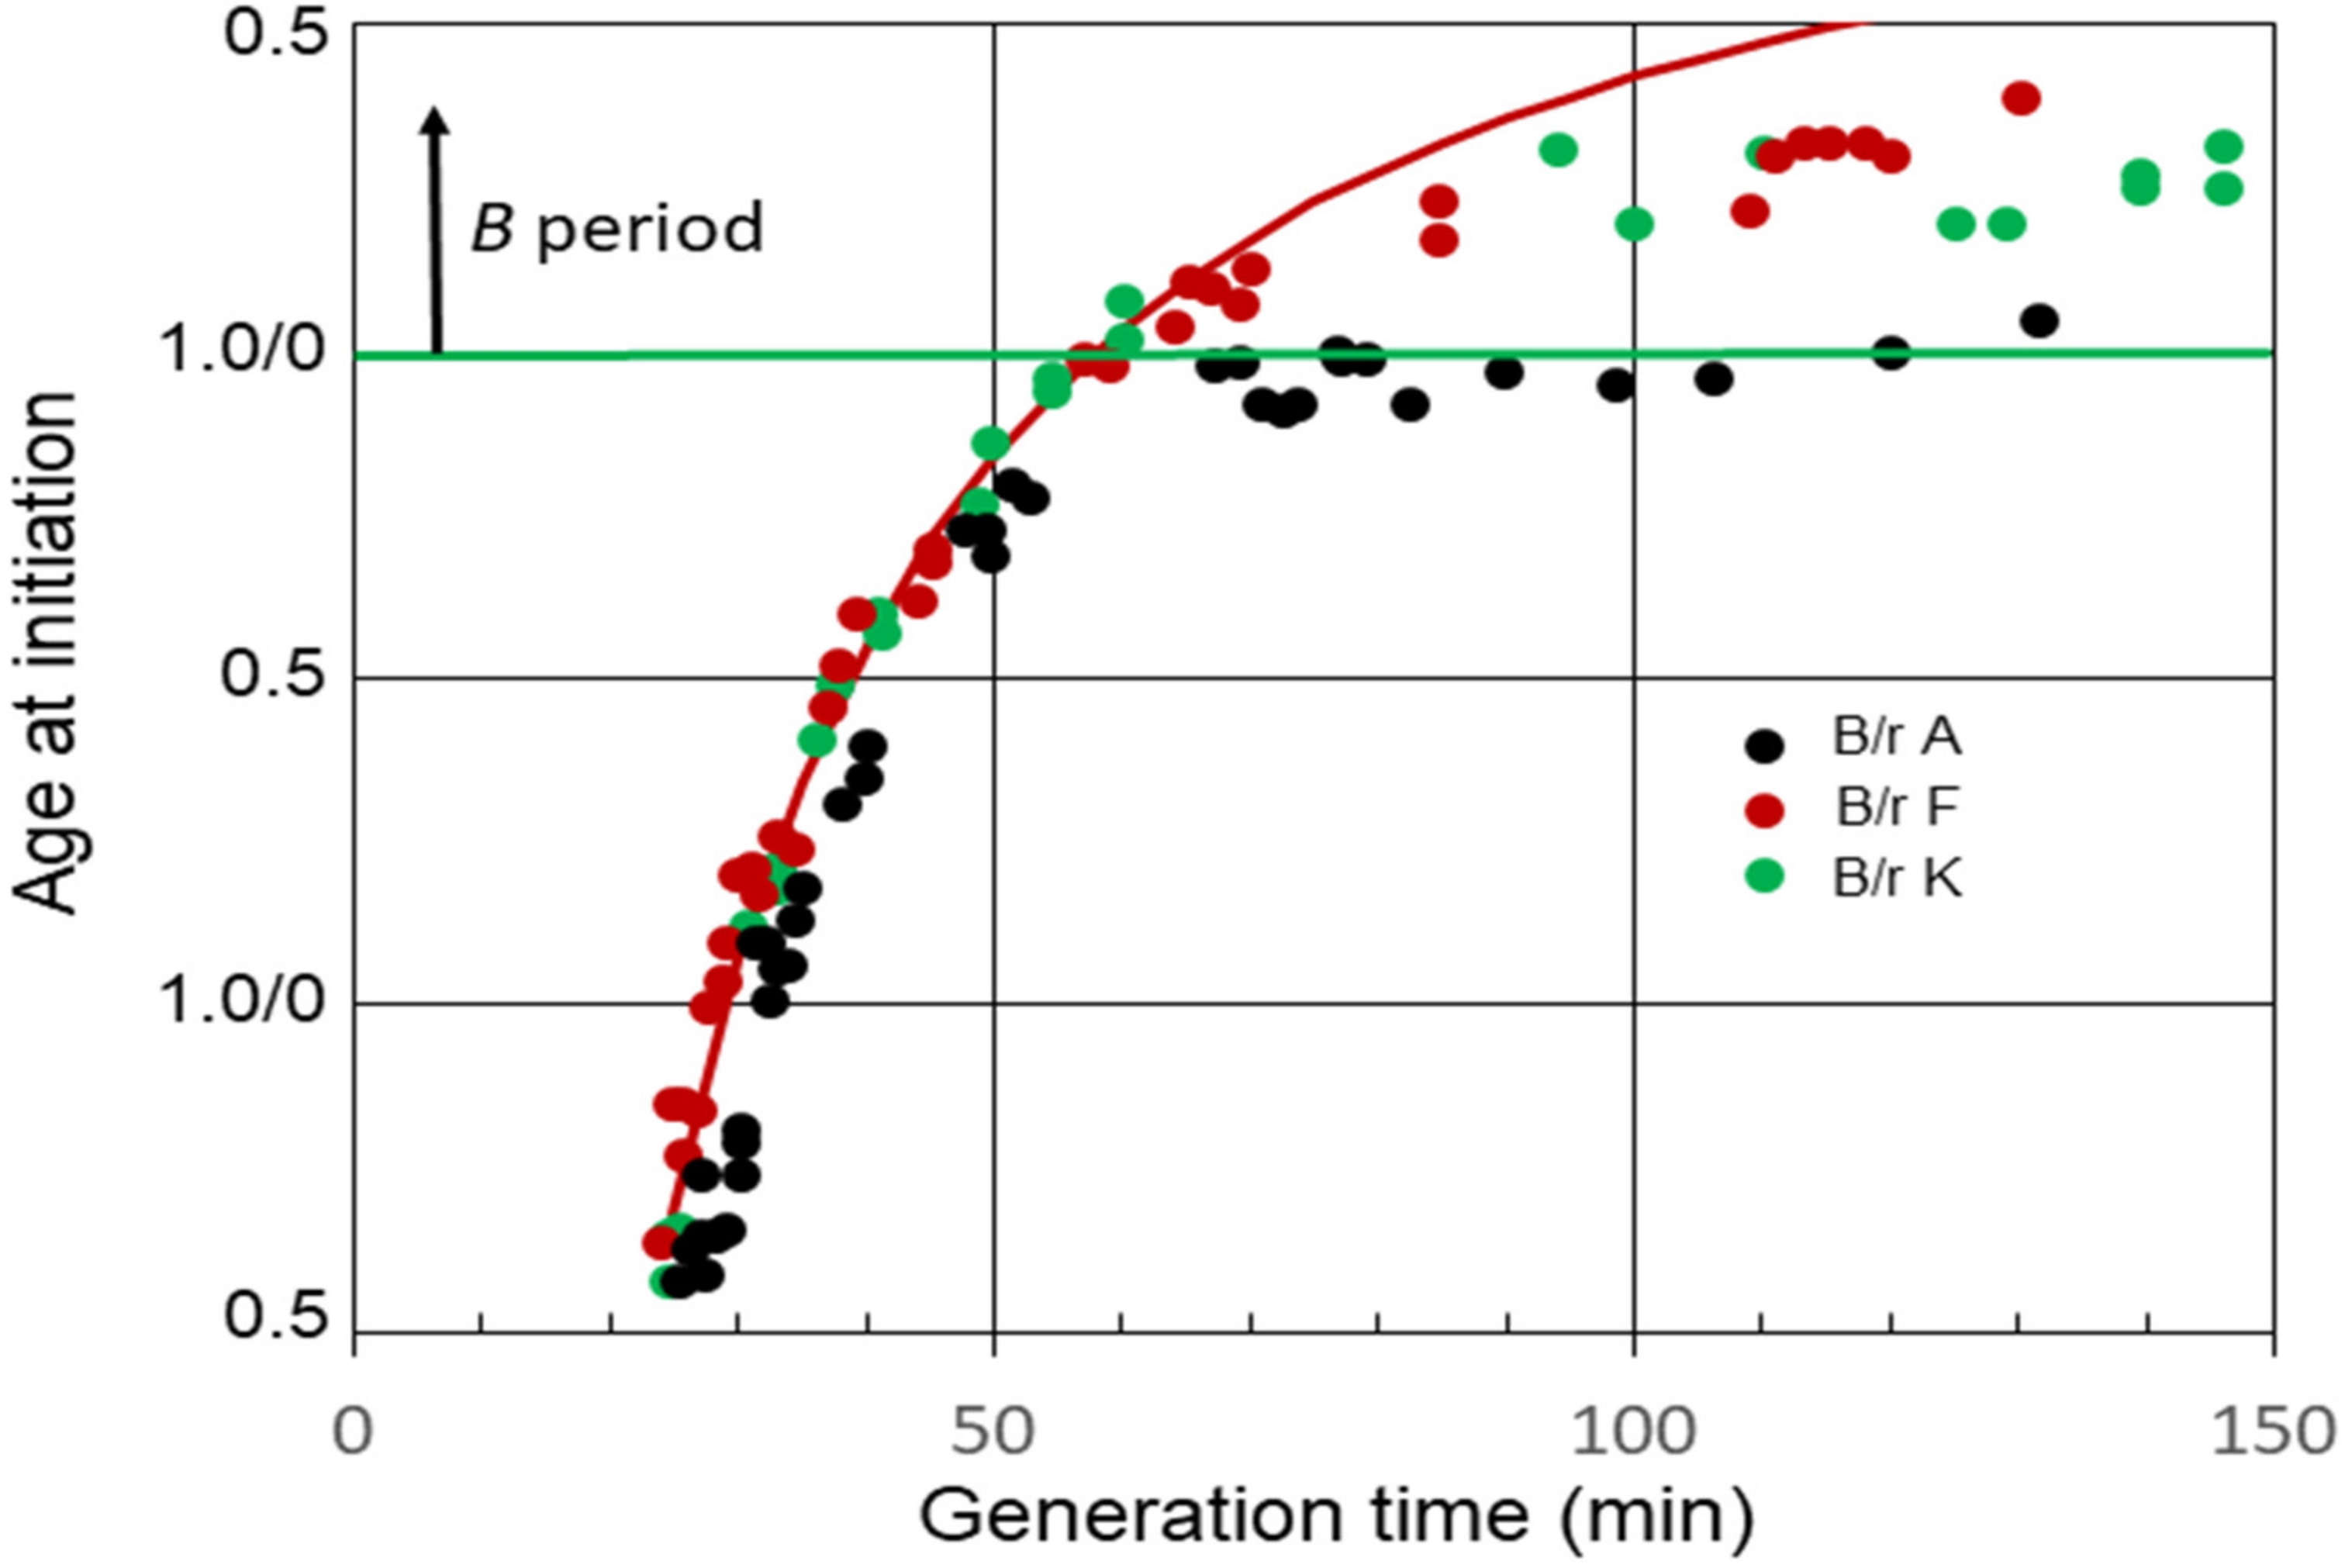
Figure 2. Cell age at the initiation of chromosome replication in E. coli B/r A, F, and K growing with various generation times. The red curve is theoretical age at the initiation of replication for B/r F, assuming (C + D) is constant and equal to 58 min.
The average C period at 37 °C was found to be 42 min during rapid growth (τ ≤ C + D) for all three strains [15]. On the other hand, the D periods differed, with the average D periods equaling 22, 16, and 14 min for B/r A, F, and K, respectively. The red curve in the figure shows the theoretical age at the initiation of replication for B/r F if (C + D) was constant at 58 min (C = 42 min; D = 16 min) at all the generation times. It is evident that the measured values for (C + D) in B/r F were constant until the generation time equaled (C + D). Thereafter, (C + D) began to increase, since the measured initiation ages lie below the curve, but it increased at a slower rate than the generation time did, unlike B/r A. In the same analysis, (C + D) also appeared to be constant in B/r A and K during rapid growth, but the generation time at which (C + D) began to increase was less certain. It is possible that (C + D) always begins to increase once the generation time is longer than the duration of (C + D) during rapid growth, but that is unclear from these data. The important point to note here is simply that B/r A differs from F and K during slow growth.
Figure 3 shows additional calculations of the average age at the initiation of replication in strain B/r A using data for C and D determined by researchers in other laboratories [7][10][16]. Calculations of the initiation age using data reported by Skarstad et al. [7] and Michelsen et al. [10] yielded values for slow-growing B/r A, which were very similar to those for F and K, as shown in Figure 2, and very different from the findings for B/r A; in other words, there was a significant early B period. However, another set of experiments performed with B/r A by Koppes et al. [16] were more consistent with the findings. As seen in Figure 3, they reported B periods in B/r A of 5 min and 3 min at generation times of 109 min and 135 min, respectively. They also found a B period of 39 min for B/r K growing with a generation time of 100 min, which is in basic agreement with the findings for this strain (Figure 2). The explanation for this odd disparity seen only with B/r A remains unknown, but it does not appear to be related to the techniques employed or the carbon sources used in the culture media since there were no consistent differences. The one consistent difference may relate to the culture media components other than carbon sources. The studies that found a small or no B period when the experiment was performed in C medium, which consists of M9 salts plus MgSO4 [15].
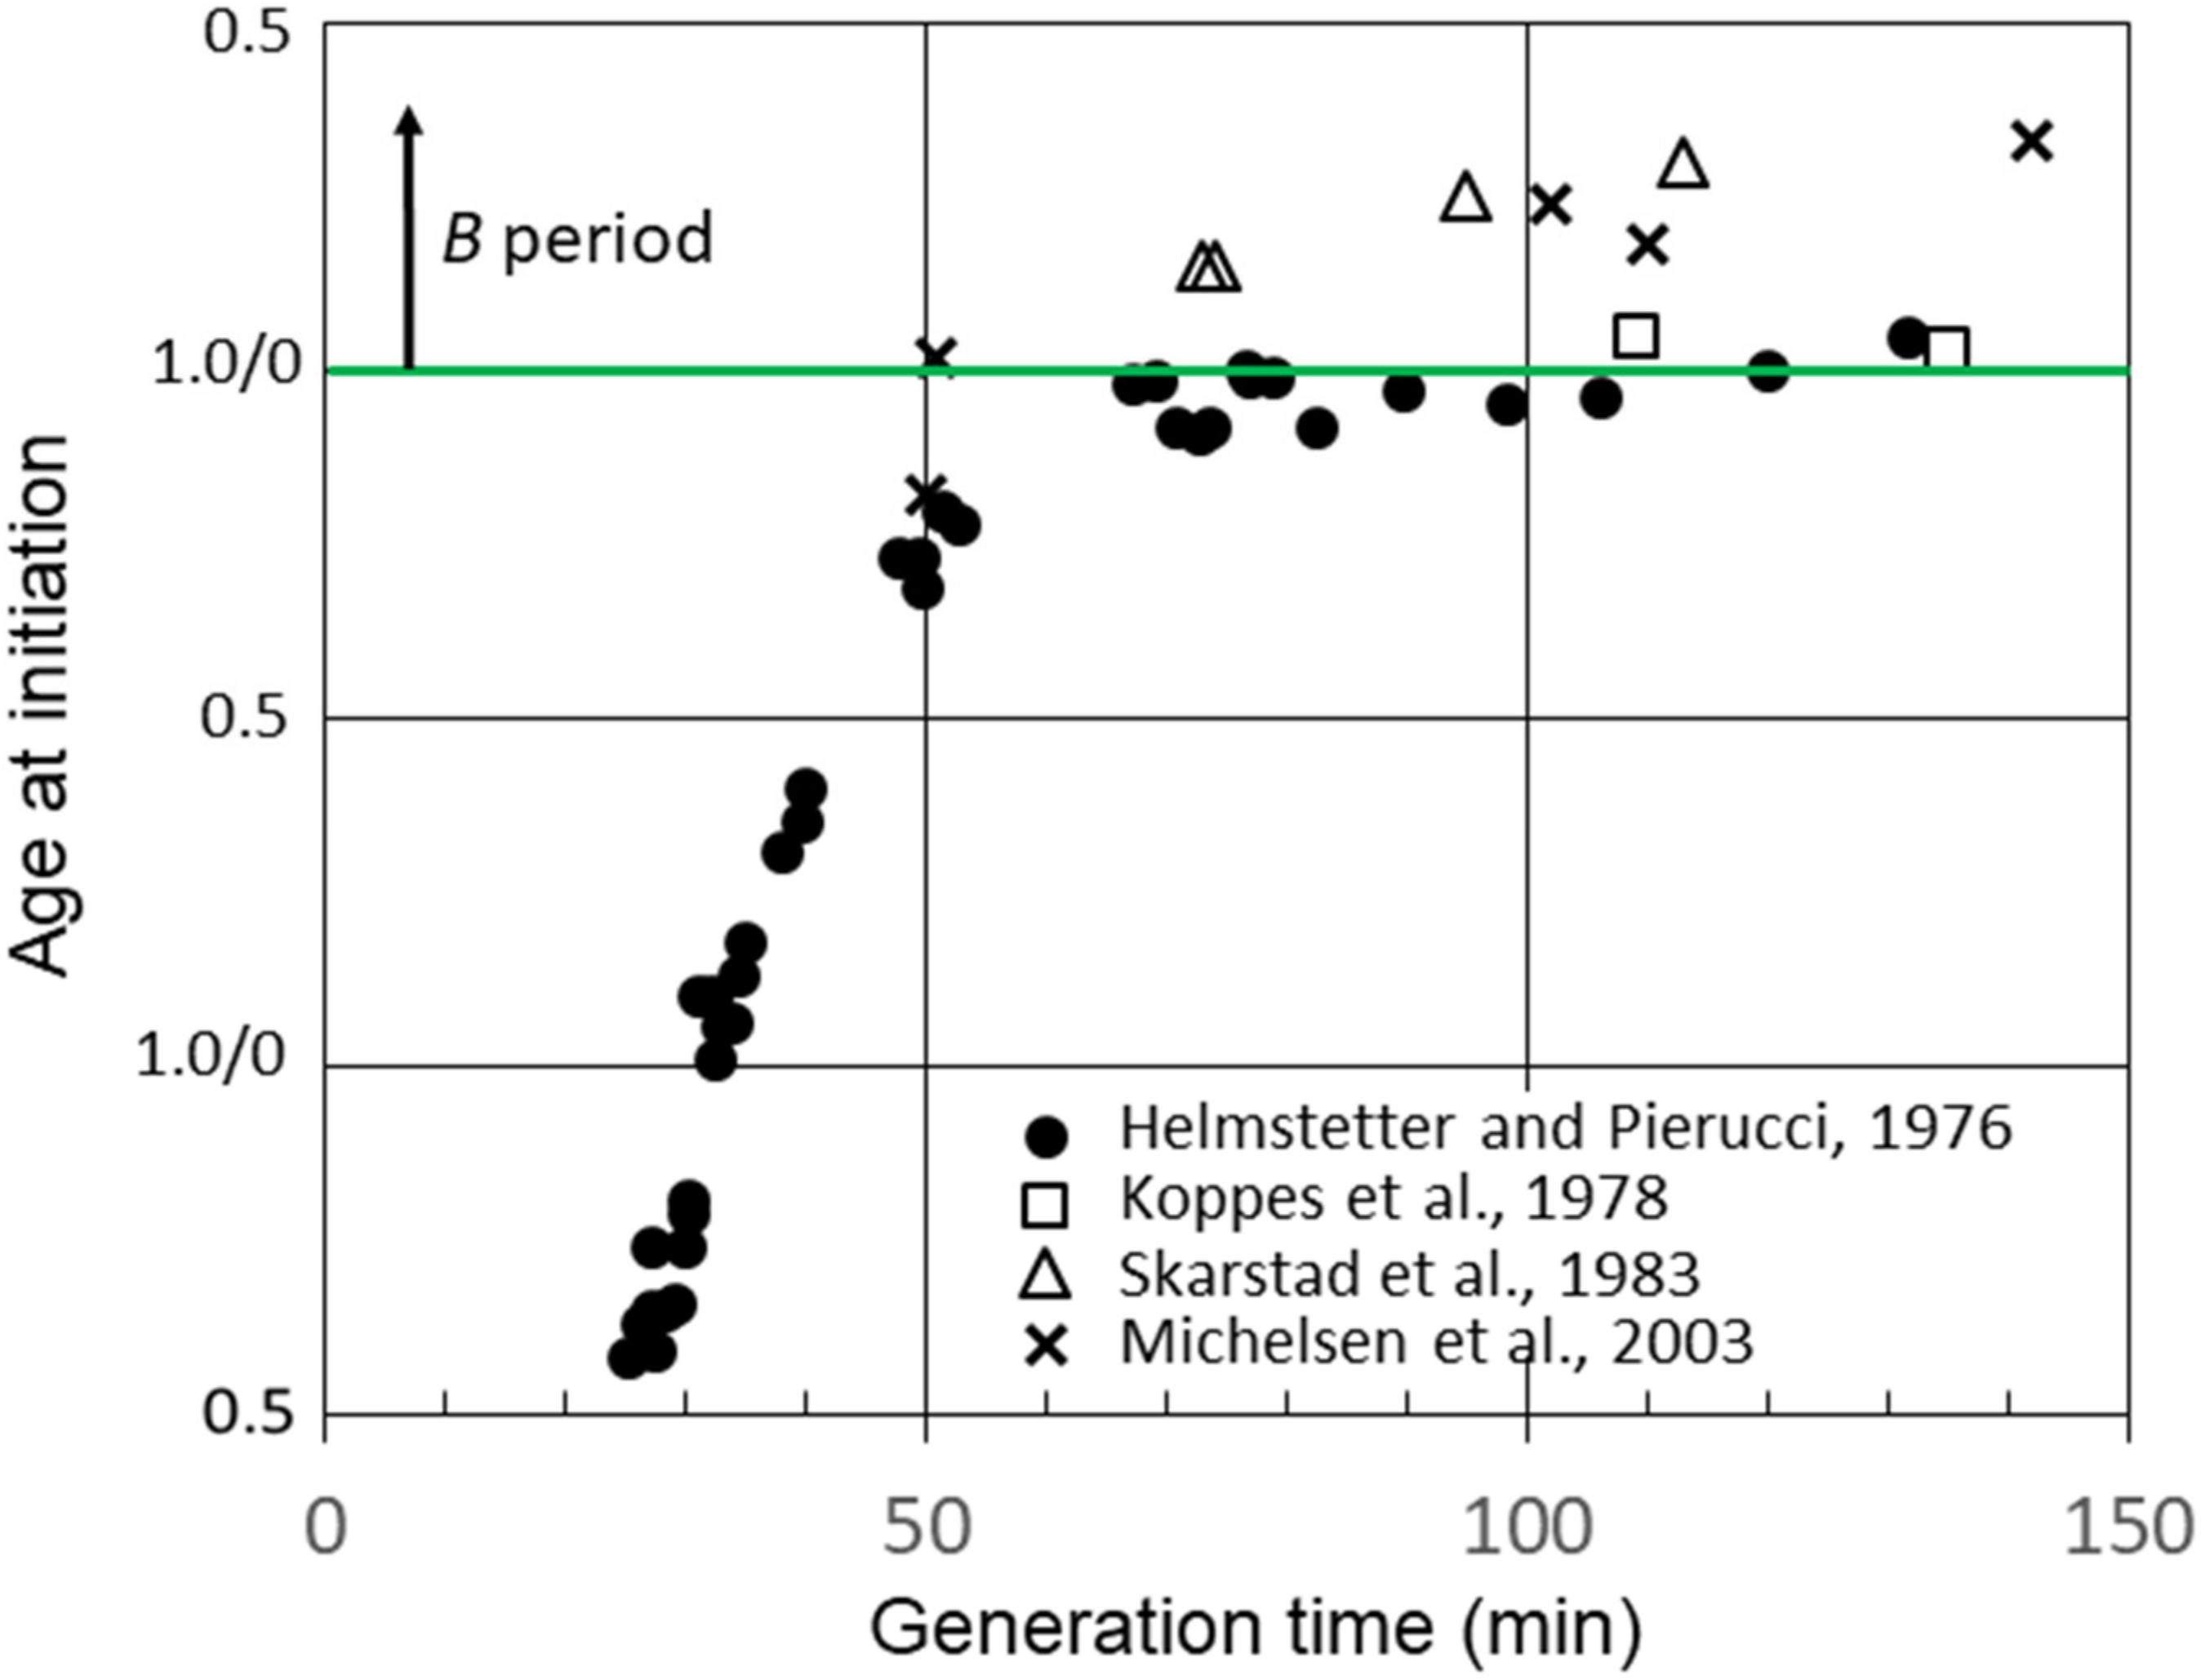
Figure 3. Cell age at the initiation of chromosome replication versus generation time for E. coli B/r A determined from measurements of B, C, and D durations in batch cultures by Helmstetter and Pierucci, Koppes et al. and Michelson et al. and in chemostat cultures by Skarstad et al.
2.3. Effects of Protein Synthesis Inhibition on Initiation of Replication
Another interesting property of E. coli B/r grown in C medium relates to the response of slow-growing cells to exposure to chloramphenicol or chloramphenicol plus rifampicin [17][18]. When the inhibitors were added to B/r A cells growing with generation times between approximately 60 and 120 min, that is, cells that normally initiated replication with two chromosomal origins during the D period, the cells continued to progress to initiation of replication. For example, when chloramphenicol was added to B/r A cells growing with a doubling time of 120 min, the cells continued to progress to initiation of replication for over 30 min (Figure 4). The triangles in the figure indicate the ages of the youngest cells that were able to continue to the initiation of replication in the presence of inhibitors. The cells that initiated replication were the only cells that divided between the two origins. However, division per se was not required since initiation of replication also takes place in the presence of penicillin [18]. This phenomenon was only observed in slow-growing cells that normally initiated during the D period with two origins. However, it was not unique to B/r A because when chloramphenicol and rifampicin were added to B/r F cells growing with a generation time of 60 min, i.e., cells that normally initiated toward the end of D [17], they also continued to initiate, but for only 10 min (Figure 4), presumably because they only divided for 10 min. If this behavior is true for all strains of E. coli, then determinations of C, as well as the average number of replication origins per cell and (C + D), in strains growing with generation times between C min and (C + D) min obtained by measuring the extent of DNA replication in the presence of rifampicin or chloramphenicol could yield erroneously large values. This would be especially true for cells growing with generation times slightly shorter than (C + D).
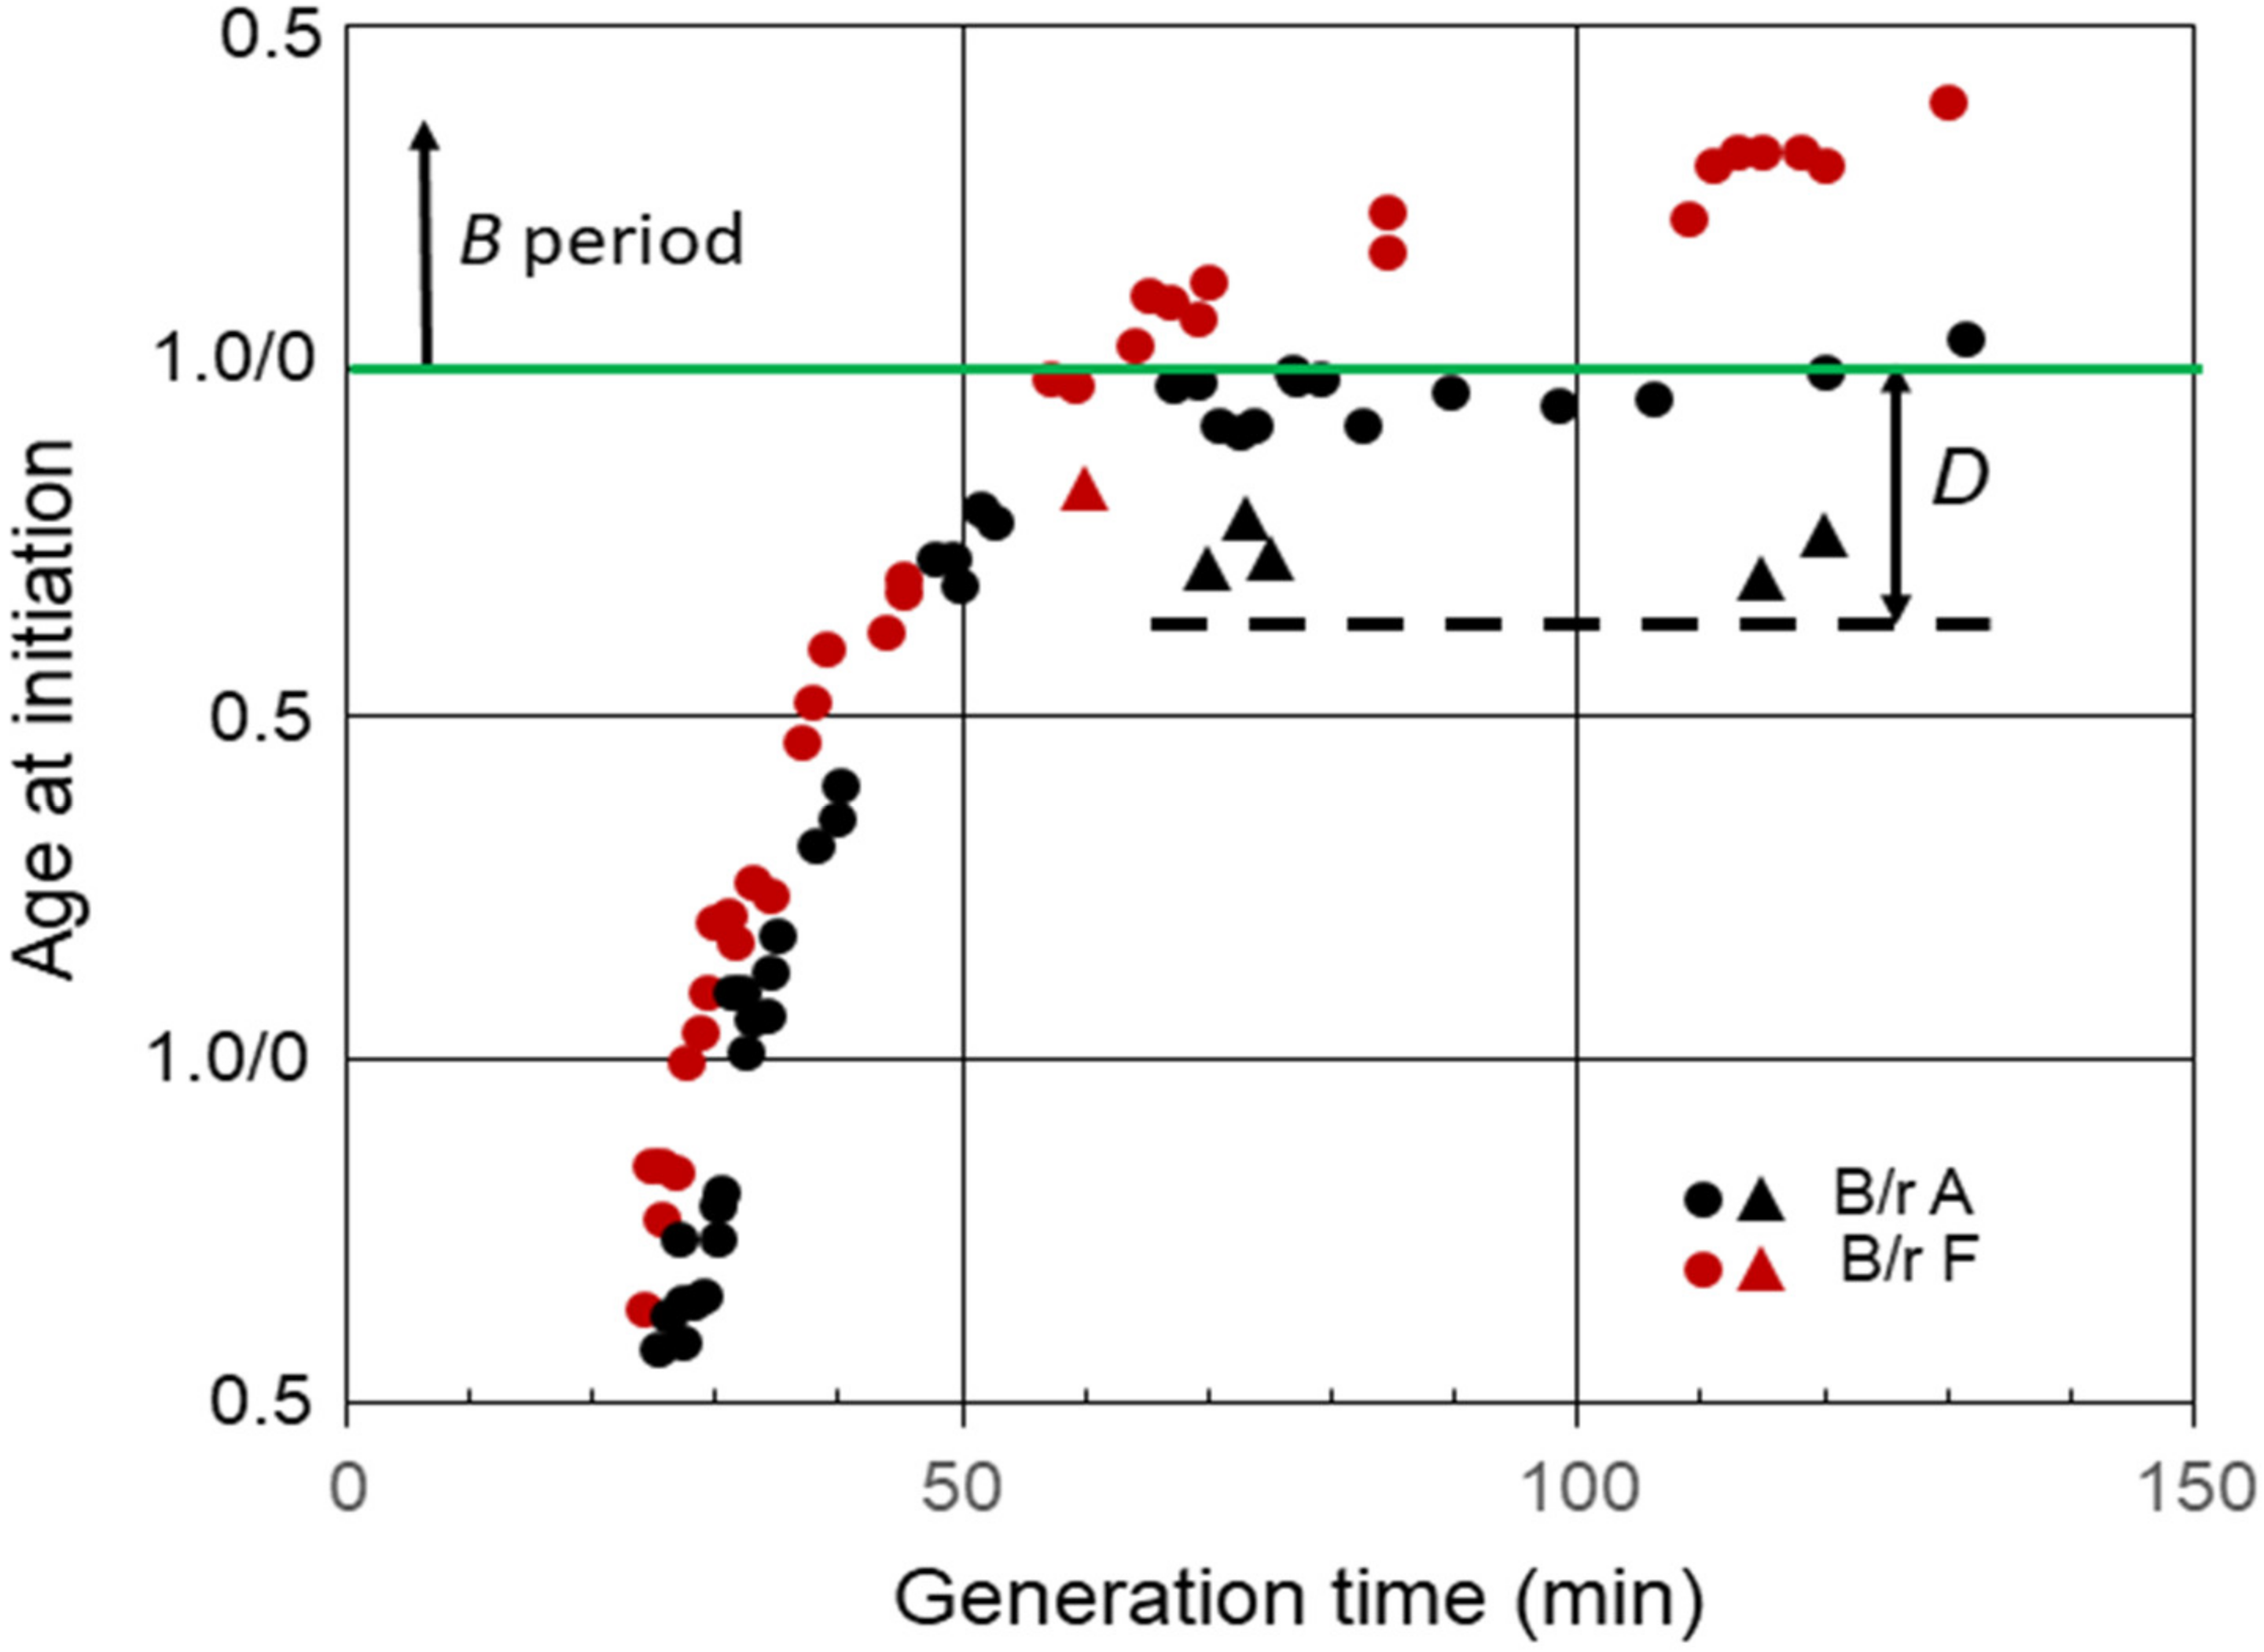
Figure 4. Effect inhibition of RNA and protein synthesis on the initiation of replication in slow-growing B/r A and F. The triangles indicate the ages of the youngest cells that were capable of progressing to initiation of replication in the presence of chloramphenicol or rifampicin plus chloramphenicol. The dashed line shows the approximate cell age at the start of the D period during slow growth of B/r A.
2.4. Relationship between Durations of C and D
It is well known that the average C period has been found to be constant in E. coli growing with generation times less than 60–70 min at 37 °C [10]. In E. coli B/r, the average duration of (C + D) has also been found to be indistinguishable from the constant during rapid growth [15], and that may also be true for some K-12 strains [11]. As a consequence, the average ratios of C/D during rapid growth of B/r A, F, and K are 1.9, 2.6, and 3.0, respectively [15]. To examine whether this relationship between C and D might continue during slow growth, the measured values for D during the slow growth of three strains (29) were multiplied by their respective ratios during rapid growth and compared to C, as shown in Figure 5. Since the values for D × (C/D) appear to superimpose on the values for C in B/r A and K during slow growth, the ratios C/D seem to be invariant at all growth rates examined in these strains and probably in B/r F as well.
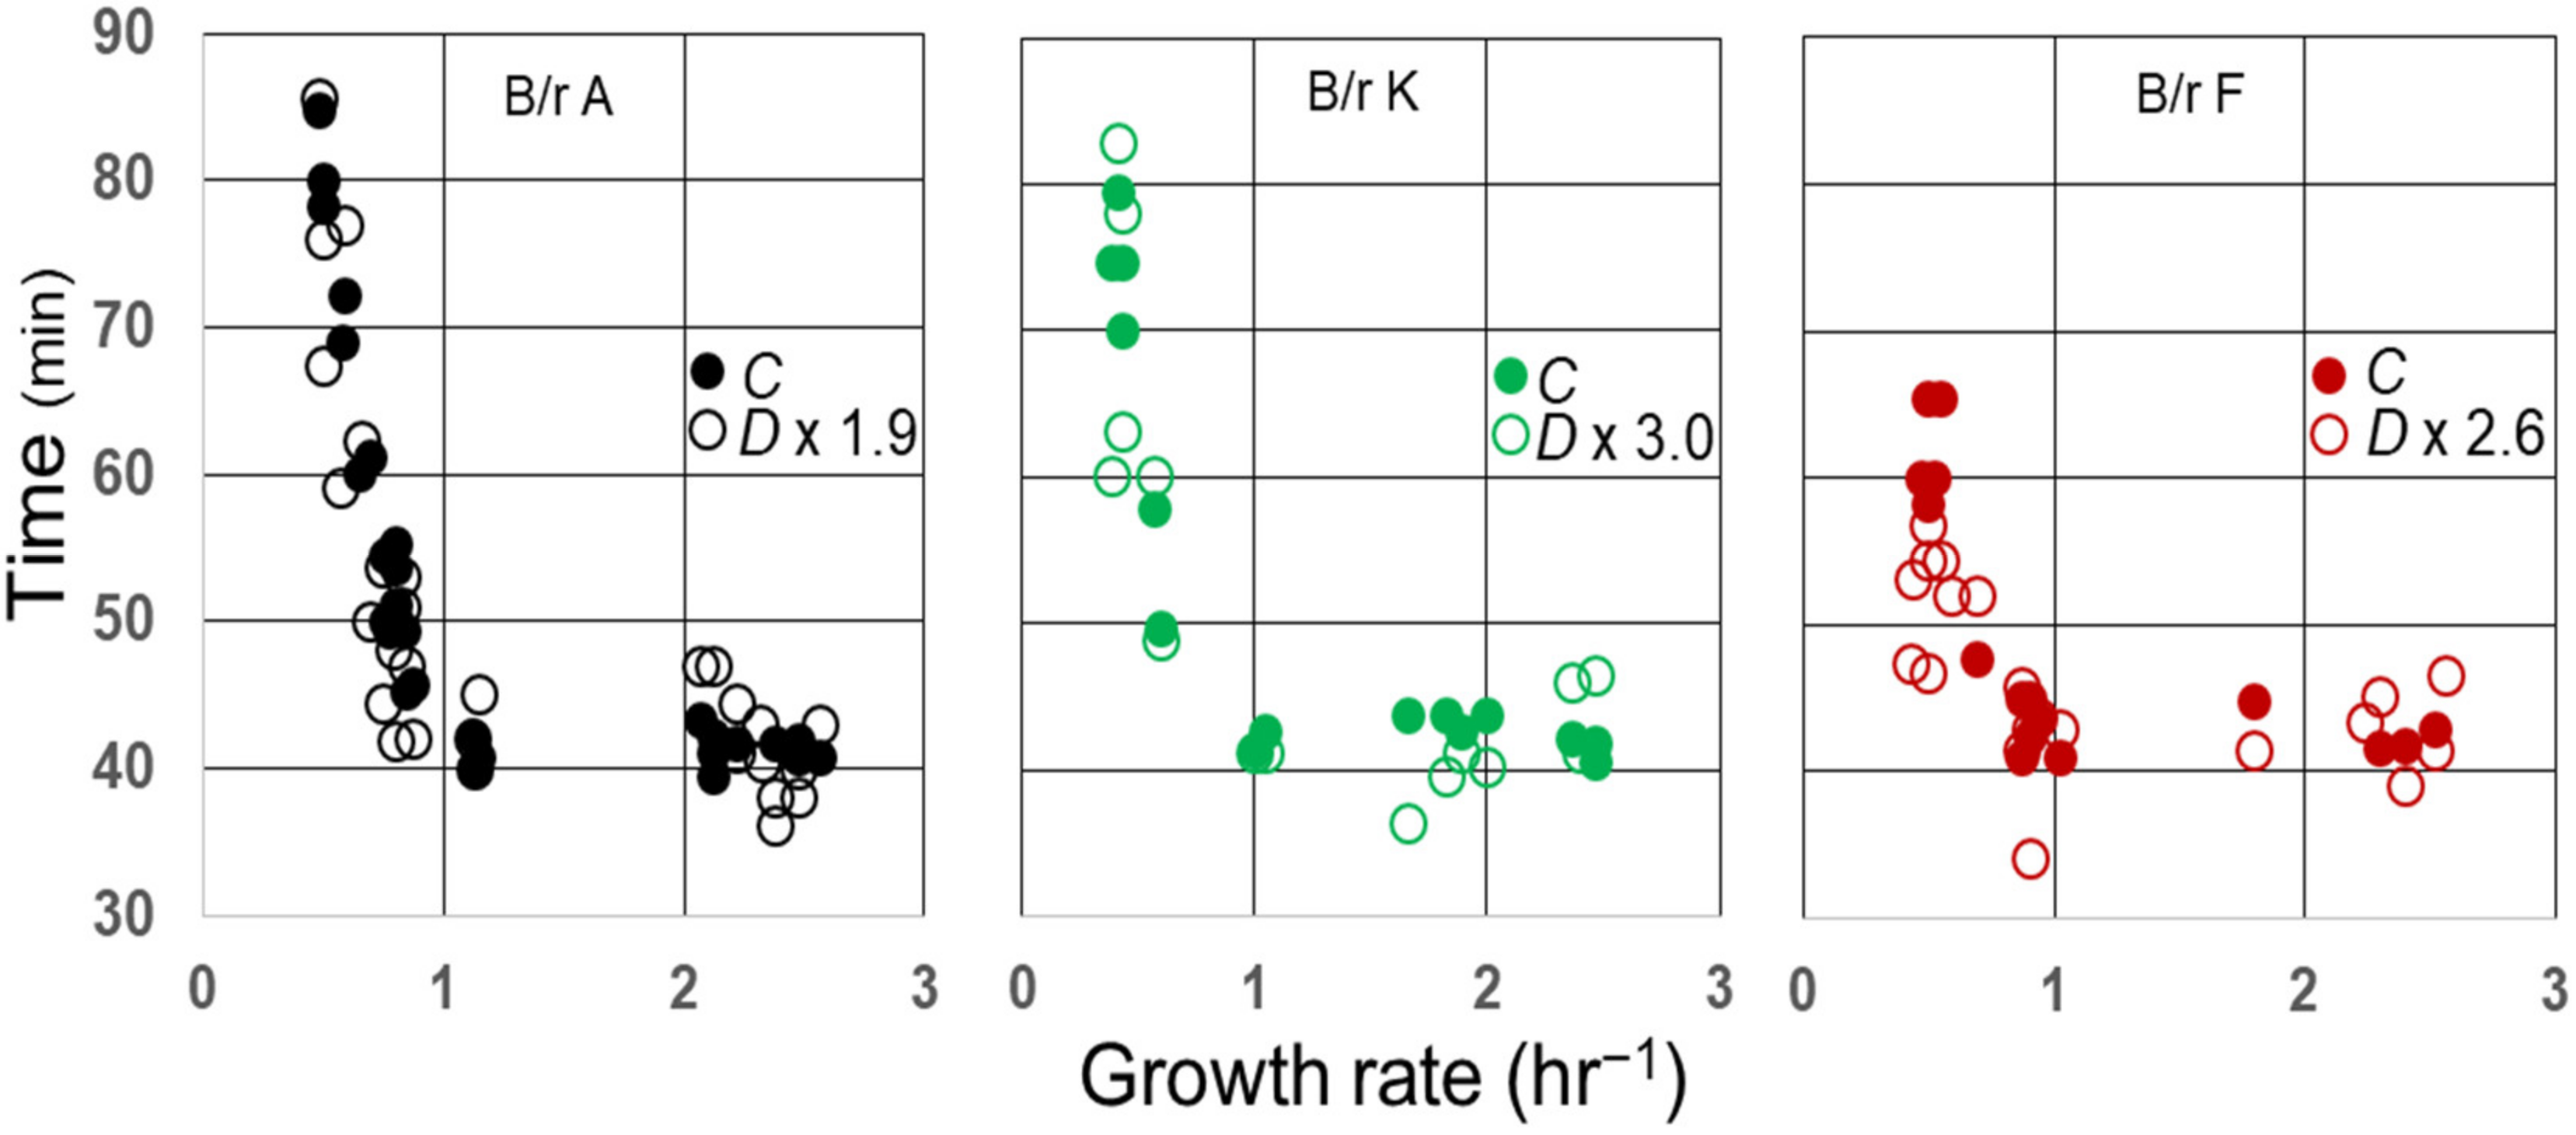
Figure 5. Correlation between C and D in E. coli B/r as a function of growth rate. Measurements of C and D and the average C/D ratios during rapid growth [τ ≤ (C + D)] were taken from Helmstetter and Pierucci and used to plot C (closed circles) and D × C/D (open circles) versus growth rate.
2.5. Relative Sizes of B/r A, K, and F
A final interesting aspect of the B/r strains relates to their sizes and shapes. Woldringh et al. [19] have shown that the shapes of newborn B/r A and K cells grown in C medium are very similar during rapid growth, but they diverge considerably in shape during slow growth. At slower growth rates, B/r A becomes more spherical, whereas B/r K maintains a rod-like shape. However, newborn cell volumes calculated using cell dimensions were found to be similar for all three B/r strains when they were grown at the same rate. Referring back Figure 2, since in C medium B/r A initiates replication at an earlier age than B/r F or K do at all growth rates, if newborn cells have similar volumes, the cell volume per chromosomal origin at the initiation of replication must be smaller in A than those in F or K. Indeed, that is what has been reported [16], and it can be found using known values of (C +D) to calculate cell volume at the time of the initiation of replication from the cell dimension measurements. Perhaps the difference in initiation volumes is related to the different shapes of strains during slow growth. However, that cannot explain the differing initiation volumes during rapid growth. When B/r A and K were grown rapidly in C medium at a rate of about 2.5 doublings/hr, the newborn cells were very similar in shape [19]. Thus, at this rapid growth rate, the newborn cell volumes, cell shapes, C period durations (42 min), and times for cell constriction (T ≈ 10 min [19]) were found to be essentially the same. The one consistent difference is in the D duration, along with a concomitant difference in initiation age. These findings raise questions regarding the relationship between initiation timing and D period duration.
References
- Beadle, G.W.; Tatum, E.L. Genetic Control of Biochemical Reactions in Neurospora. Proc. Natl. Acad. Sci. USA 1942, 27, 499–506.
- Beadle, G.W. Biochemical Genetics: Some Recollections. In Phage and the Origins of Molecular Biology; Cairns, J., Stent, G.S., Watson, J.D., Eds.; Cold Spring Harbor Laboratory of Quantitative Biology: Cold Spring Harbor, NY, USA, 1966; pp. 23–32.
- Beadle, G.W. Recollections. Annu. Rev. Biochem. 1974, 43, 1–14.
- Singer, M.; Berg, P. George Beadle: From Genes to Enzymes. Nat. Rev. Gen. 2004, 5, 949–954.
- Strauss, B.S. Biochemical Genetics and Molecular Biology: The Contributions of George Beadle and Edward Tatum. Genetics 2016, 293, 13–20.
- Helmstetter, C.E.; Cooper, S.; Pierucci, O.; Revelas, E. On the Bacterial Life Sequence. Cold Spring Harbor Symp. Quant. Biol. 1968, 33, 809–822.
- Skarstad, K.; Steen, H.B.; Boye, E. Cell Cycle Parameters of Slowly Growing Escherichia coli B/r Studied by Flow Cytometry. J. Bacteriol. 1983, 154, 656–662.
- Skarstad, K.; Steen, H.B.; Boye, E. Escherichia coli DNA Distributions measured by Flow Cytometry and Compared with Theoretical Computer Simulations. J. Bacteriol. 1985, 163, 661–668.
- Allman, R.; Schjerven, T.; Boye, E. Cell Cycle Parameters of Escherichia coli K-12. J. Bacteriol. 1991, 173, 7970–7974.
- Michelsen, O.; de Mattos, M.J.T.; Jensen, P.R.; Hansen, F.G. Precise Determination of C and D Periods by Flow Cytometry in Escherichia coli K-12 and B/r. Microbiology 2003, 149, 1001–1010.
- Zheng, H.; Bai, Y.; Jiang, M.; Tokuyasu, T.A.; Huang, X.; Zhong, F.; Wu, Y.; Fu, C.; Kleckner, N.; Hwa, T.; et al. General Quantitative Relations Linking Cell Growth and the Cell Cycle in Escherichia coli. Nature Microbiol. 2020, 5, 995–1001.
- Helmstetter, C.E.; Eenhuis, C.; Theisen, P.; Grimwade, J.; Leonard, A.C. Improved Bacterial Baby Machine: Application to Escherichia coli K-12. J. Bacteriol. 1992, 174, 3445–3449.
- Helmstetter, C.E.; Cooper, S. DNA Synthesis During the Division Cycle of Rapidly Growing Escherichia coli B/r. J. Mol. Biol. 1968, 31, 507–518.
- Cooper, S.; Helmstetter, C.E. Chromosome Replication and the Division Cycle of Escherichia coli B/r. J. Mol. Biol. 1968, 31, 519–540.
- Helmstetter, C.E.; Pierucci, O. DNA Synthesis during the Division Cycle of Three Substrains of Escherichia coli B/r. J. Mol. Biol. 1976, 102, 477–486.
- Koppes, L.J.H.; Woldringh, C.L.; Nanninga, N. Size Variations and Correlation of Different Cell Cycle Events in Slow-Growing Escherichia coli. J. Bacteriol. 1978, 134, 423–433.
- Helmstetter, C.E. Initiation of Chromosome Replication in Escherichia coli I. Requirements for RNA and Protein Synthesis at Different Growth Rates. J. Mol. Biol. 1974, 84, 1–19.
- Helmstetter, C.E. Initiation of Chromosome Replication in Escherichia coli II. Analysis of the Control Mechanism. J. Mol. Biol. 1974, 84, 21–36.
- Woldringh, C.L.; de Jong, M.A.; van den Berg, W.; Koppes, L. Morphological Analysis of the Division Cycle of Two Escherichia coli Substrains During Slow Growth. J. Bacteriol. 1977, 131, 270–279.
More
Information
Subjects:
Microbiology
Contributor
MDPI registered users' name will be linked to their SciProfiles pages. To register with us, please refer to https://encyclopedia.pub/register
:
View Times:
820
Revisions:
2 times
(View History)
Update Date:
04 May 2023
Table of Contents


Notice
You are not a member of the advisory board for this topic. If you want to update advisory board member profile, please contact office@encyclopedia.pub.
OK
Confirm
Only members of the Encyclopedia advisory board for this topic are allowed to note entries. Would you like to become an advisory board member of the Encyclopedia?
Yes
No
${ textCharacter }/${ maxCharacter }
Submit
Cancel
Back
Comments
${ item }
|
${ item.createdUser.fullName }
${ item.createdAt }
${ item.vote }
${ item.reply }
Delete
${ reply.createdUser.fullName }
${ reply.createdAt }
${ reply.vote }
Delete
There is no reply to this comment~
${ item.replyTextCharacter }/${ item.replyMaxCharacter }
Submit
Cancel
More
No more~
There is no comment~
${ textCharacter }/${ maxCharacter }
Submit
Cancel
${ selectedItem.replyTextCharacter }/${ selectedItem.replyMaxCharacter }
Submit
Cancel
Confirm
Are you sure to Delete?
Yes
No