Your browser does not fully support modern features. Please upgrade for a smoother experience.
Submitted Successfully!
 +1 credit
Thank you for your contribution! You can also upload a video entry or images related to this topic.
For video creation, please contact our Academic Video Service.
| Version | Summary | Created by | Modification | Content Size | Created at | Operation |
|---|---|---|---|---|---|---|
| 1 | Tian Hao Ye | -- | 3522 | 2023-04-22 09:49:51 | | | |
| 2 | Jason Zhu | + 101 word(s) | 3624 | 2023-04-23 03:48:03 | | |
Video Upload Options
We provide professional Academic Video Service to translate complex research into visually appealing presentations. Would you like to try it?
Cite
If you have any further questions, please contact Encyclopedia Editorial Office.
Ye, T.H.; Wang, G.; Wang, C. Spatial-Temporal Distribution Patterns of Major Mine Debris Flows in China. Encyclopedia. Available online: https://encyclopedia.pub/entry/43339 (accessed on 26 July 2026).
Ye TH, Wang G, Wang C. Spatial-Temporal Distribution Patterns of Major Mine Debris Flows in China. Encyclopedia. Available at: https://encyclopedia.pub/entry/43339. Accessed July 26, 2026.
Ye, Tian Hao, Guangjin Wang, Chunlai Wang. "Spatial-Temporal Distribution Patterns of Major Mine Debris Flows in China" Encyclopedia, https://encyclopedia.pub/entry/43339 (accessed July 26, 2026).
Ye, T.H., Wang, G., & Wang, C. (2023, April 22). Spatial-Temporal Distribution Patterns of Major Mine Debris Flows in China. In Encyclopedia. https://encyclopedia.pub/entry/43339
Ye, Tian Hao, et al. "Spatial-Temporal Distribution Patterns of Major Mine Debris Flows in China." Encyclopedia. Web. 22 April, 2023.
Copy Citation
From 1954 to 2019, the number of major mine debris flow disasters first increased and then decreased. The proportion of mine debris flow disasters to the total number of debris flow disasters also showed a trend of first increasing and then decreasing, with the southwestern region being the area of high occurrence of mine debris flow, and the geoenvironmental areas of middle and low hills and middle and high mountains being the topographic areas of high occurrence of mine debris flow. More than 90% of the major mine debris flow disasters occurred from May to September, with the largest number of disasters occurring in July.
mine debris flow
spatial-temporal distribution
variation patterns
1.Introduction
As a major mining country, China is rich in mineral resources. According to the 2022 China Mineral Resources Report, 173 types of minerals have been discovered in China, and the production and consumption of various types of minerals in the mining industry are among the highest in the world. The large-scale exploration, development, and utilization of mineral resources, while constantly meeting market demand and enriching people’s material lives, are also profoundly changing the ecology and natural environment of mining areas, causing many environmental problems.
Mine debris flow is a special debris flow formed by the influence of human mineral resources development activities. Additionally, because it is the most important source of soil and stone waste generated by mining, it is also known as slag-type debris flow. As people unreasonably and irregularly pile and discharge a large amount of waste rock and soil generated in the mining process, the slope ratio of the ditch bed where the dump is located increases, the topographic height difference produces potential energy accumulation, thus enhancing the erosion capacity of fluid scouring. On the other hand, due to the continuation of the mining process and the replenishing of sufficient raw materials for the repeated occurrence of mine debris flow, making mine debris flow has a high frequency of occurrence, serious pollution, strong destructive force, and other characteristics. In particular, the major mine debris flows that cause more than 10 deaths or direct economic losses of more than 50 million yuan pose a serious threat to natural environmental protection, the safety of people’s lives, and social harmony and stability [1].
However, in recent years, there has been a lack of analysis of the distribution patterns of major mine debris flow disasters that have occurred in large numbers and caused serious casualties and property damage nationwide. The analysis and summary of the spatial and temporal distribution patterns of major mine debris flows nationwide are important for preventing and reducing the occurrence and development of mine debris flows, providing a guarantee for national ecological safety, and enriching the research results on debris flows [2].
2. Status of Research on Mine Debris Flow
2.1. Status of International Mine Debris Flow Research
With the growth in the number and scale of mines worldwide, the risk of geological hazards arising from the mineral extraction process have received increasing attention, and in developing countries, there is a tendency for mine geological hazards to be exacerbated by outdated mine waste rock disposal management systems [3][4][5][6]. Some scholars have argued that despite the large number of open pit mines with unique and large topographic features such as drainage dumps and tailings ponds, it may be difficult to identify the impacts from human mining activities at smaller spatial and temporal scales from natural processes [7][8]. In this regard, the interactions and synergistic effects of direct and indirect impacts of human mining activities, topographic factors, ecological factors and climatic factors at different spatial and temporal scales are quite complex [9][10]. By altering the topography as well as the ecosystem, mining activities not only increase the frequency of low-intensity accidents, but also induce catastrophic accidents in some environments [11]. Although the occurrence of some mine debris flow accidents is mainly associated with natural forces, such as heavy rainfall, the anthropogenic alteration of the mine environment—especially the large amount of loose solids generated by mining activities—may have exacerbated the scale and impact of the hazard.
Based on this, many researchers [12][13][14][15][16] believe that studies on the spatial and temporal distribution patterns of accident sites, such as open pits, dumps, and tailings ponds where geological hazards occur, can help determine their intrinsic correlation with natural factors such as climate and topography. Increasingly, research institutions are recognizing the geohazard risks posed by mines and are attempting to assess the distribution of mine sites and mine spoil disposal volumes on a national scale. In South Africa, it is estimated that 1100 mines produce 72.3% of the country’s total mine spoil while occupying 25 km2 of land for tailings pond construction [17]. In Australia, more than 80,000 abandoned mines are recorded, posing a considerable threat to the surrounding area [18], in addition to more than 1750 tonnes of mine spoil from operating mines each year [19].
2.2. Progress of Mine Debris Flow Research in China
Research on mine debris flows in China started in the 1950s. Wang et al. [20] started early to evaluate the prediction of debris flows in mines through three aspects: storm intensity, solid material sources and topographic conditions, and established a qualitative prediction system for mine debris flows. Xie [21] gave the first systematic overview of the application of fractal theory in geotechnics, providing a powerful new tool for the study of debris flow problems. Xu et al. [22][23] gave a more comprehensive discussion on the conditions and characteristics of mine debris flow formation, focusing on the analysis of mine debris flow and its distribution characteristics in Northwest China, and classified mine geological problems according to their occurrence in time, space, geological environment background, resulting outcomes, and recoverable degree in order to promote research on mine geological environment management.
Many researchers have studied the distribution characteristics of mine geological hazards [24][25][26], and concluded that mine debris flow, as one of the common types of mine geological hazards, has the characteristic of being extremely destructive and a serious threat to normal production and human ecological environment in mining areas. Therefore, the distribution pattern was analyzed from both temporal and spatial perspectives, and it was concluded that major mine geological hazards are the main cause of human casualties and property losses, and should be focused on in future studies.
3. Analysis of the Time Variation Pattern of Mine Debris Flow
3.1. Intra-Year Variation Pattern of Mine Debris Flow
The distribution of major mine debris flow disasters in each month from 1954 to 2019 were collated to obtain Figure 1. Statistics show that most of the major mine debris flow disasters in China occur from May to September, with the number of occurrences accounting for more than 90.1% of the total number of 12 months. The frequency of occurrence is higher from June to August, and the largest number of disasters occurs in July, accounting for 29.6% of the total. Major mine debris flows rarely occur from January to March and December. The fitted trend lines show that the distribution of disaster occurrence periods are concentrated between July and August. Considering that China is mainly influenced by continental monsoon climate, with warm and humid summer winds blowing from the east and south oceans from April to September every year, rainfall is mostly concentrated in summer. The trend of precipitation in each month overlaps highly with the trend of major mine debris flow disasters. The historical monthly precipitation totals are low during the low frequency of major mine debris flow in January to March and December, while the total amount of precipitation is at a high level during the high frequency of major mine debris flow in May to September, which confirms that the intra-year distribution trend of major mine debris flow disasters is largely influenced by the precipitation factor during the flood season (China’s flood season is from May 1 to October 20 each year).

Figure 1. Distribution of major mine debris flows by month over the years.
3.2. Interannual Variation Pattern of Mine Debris Flow
The trends in the number of major debris flow disasters and the number of major mine debris flow disasters occurring over a long period of time, obtained based on the collected data, are shown in Figure 2. The percentage of the number of mine debris flow in the total number of debris flow occurrences in each period is also shown in the figure.
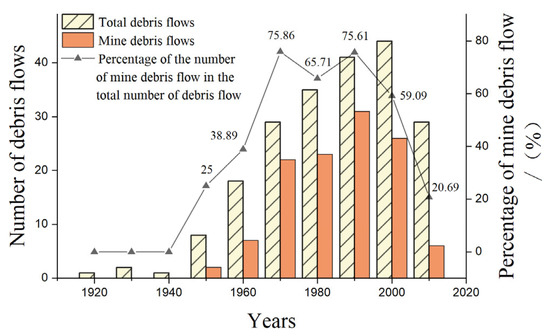
Figure 2. Trends in the number of major debris flow/mine debris flow disasters over a wide span of time.
As can be seen from Figure 2, the number of major debris flow disasters and the number of major mine debris flow disasters in China show a trend of first increasing and then decreasing, while the proportion of mine debris flow in the total number of debris flow disasters also shows a trend of first increasing and then decreasing. The number of major mine debris flows gradually increased after 1950, with the peak number of major mine debris flows occurring between 1990 and 1999, and an average of 2.85 accidents per year between 1990 and 2010, during which the mining industry in China flourished, the number of mines increased steeply, the safety system construction was not perfect, and the ecological environment was seriously damaged, leading to the frequent occurrence of mine debris flows. After 2010, with the attention of the Chinese government, the number of major mine debris flow disasters turned and started to decrease. From 2016 to 2020 alone, more than 19,000 non-coal mines and tailings dumps were rectified and closed nationwide, reducing the risk of mines providing raw materials to debris flows from the root, and playing a positive role in the reduction of major mine debris flow accidents.
4. Analysis of the Spatial Distribution Pattern of Mine Debris Flow
4.1. Mine Debris Flow Distribution Pattern by Province
Analyzing the spatial distribution pattern of mine debris flow hazards is the basis for analyzing and assessing their causes and influencing factors, and thus, predicting their development trends. Based on the statistical data from 1954 to 2019, the national percentage of major mine debris flow disasters in different provinces obtained by collation is shown in Figure 3.
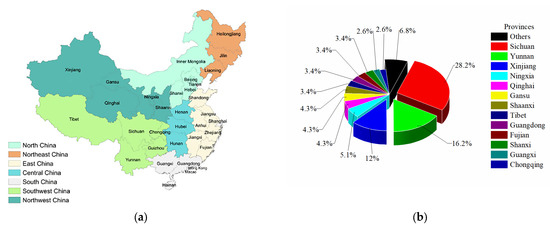
Figure 3. (a) Geographic Divisions of China (Mainland China and Hainan Province only); (b) National percentage of major mine debris flow in China by province.
Combined with the major mine debris flows analyzed in the geographic divisions of China (Figure 3a), the number of major mine debris flow occurrences in North China accounted for 3.4% of the national proportion; the overall number of accidents in Northeast China was low, accounting for 0.8% of the country; the number of major mine debris flow occurrences in mines in East China, South China, and Central China were also low, at 6.0, 6.0 and 2.6%, respectively; the number of mine debris flows in Southwest China was significantly higher than other regions, with 51.3% of the national percentage of the first; and Northwest China is second only to southwest China, with a high percentage of major mine debris flows, reaching 29.9%. As can be seen from Figure 3b, in terms of the number of occurrences, the number of major mine debris flows occurring in Sichuan accounted for 28.2% of the total statistics, the highest in the country, accounting for the second, third, and fourth places were Yunnan 16.2%, Xinjiang 12.0%, and Ningxia 5.1%. According to data released by the National Bureau of Statistics of China, the distribution of mine debris flow-prone areas and regional debris flow is basically the same, with debris flow-prone areas providing environmental conditions for the occurrence of mine debris flow, while the development of mineral resources has exacerbated the occurrence and hazards of regional debris flow. For example, the Yanjinggou watershed in Mianning County, Sichuan Province, was originally an area prone to flash floods and debris flows, and the accumulation of mining slag in the area of Lugu iron ore mine provided a large number of material sources for the occurrence of debris flow—and mine debris flow occurred many times in history. It is therefore particularly important to select areas with a high incidence of debris flow to carry out mine debris flow investigation and evaluation.
4.2. Mine Debris Flow Distribution Pattern by Geological Environment Zone
As a geological hazard specific to mining areas, mine debris flow, like natural debris flow, requires specific topography as a basic condition, so mountainous areas with high and steep terrain, gullies and valleys, rich in unconsolidated soil, and highly weathered rocks are prone to mine debris flow. On the other hand, various metallic and non-metallic minerals are mostly produced in mountainous areas, and mining activities destroy the geological environment of mining areas and pile up large amounts of mine waste rock and slag, which intensify the occurrence, development, and hazards of mine geological hazards, making mine debris flows one of the most common and costly geological hazards in many mountainous areas. Combined with the collected data on the distribution of major mine debris flow, the distribution map of major mine debris flow was drawn using the China Mine Geological Environment Background Zoning Map [27] as the base map (Figure 4).
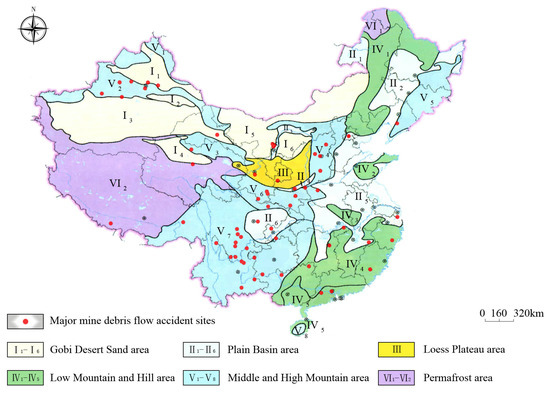
Figure 4. Distribution map of major mine debris flow disasters (Mainland China and Hainan Province only).
According to the definition, “hills” refers to the terrain with certain undulations between 200 and 500 m above sea level; “low mountains” refers to the mountains between 500 and 1000 m above sea level; “middle mountains” refers to the mountains between 1000 and 3500 m above sea level; and “high mountains” refers to the mountains between 3500 and 5000 m above sea level. The figure analysis shows that in terms of different geological environment areas, the most frequent occurrence of major mine debris flow disasters is in the middle and high mountain areas, followed by the low mountain and hilly areas, less frequently in the plain basin areas and permafrost areas, and rarely in the Gobi Desert and Loess Plateau areas. The frequency of debris flow is also relatively high in the geological environment of middle and high mountains and low mountain and hills where the intensity of activities of mining mineral resources are high. These areas are crisscrossed by mountains and valleys, with a humid climate and abundant rainfall, and affected by the scale and intensity of mining development, some valleys with a more stable environment have been transformed into debris flow-prone areas, and the occurrence and hazards of debris flow are intensifying in some debris flow gullies that were originally conducive to the formation of debris flow. According to statistics, the low mountain hilly geological environment within the Shizhuyuan non-ferrous metal mining area in Chenzhou City, Hunan Province and the Shipingchuan molybdenum mining area in Qingtian County, Lishui City, Zhejiang Province, etc., as well as the middle and high mountain geological environment within the The Dongchuan copper Yinmin mining area and Gejiu tin mining area in Yunnan province and the Mianning Lugu iron ore mine in Sichuan province, etc. has historically occurred in major mine debris flow disasters, causing a large number of casualties and property damage. It is worth noting that major mine debris flows have also occurred in permafrost areas due to the long-term over-wet condition (natural moisture content of 30% or more) of the soil. At the same time, major mine debris flows frequently occur on the eastern edge of the Qinghai-Tibet Plateau at the junction of the first and second terrains of the three major terrains in China, where high mountainous terrain is widely distributed and strong geological and tectonic movements exist, providing rich conditions for the generation and development of major mine debris flows. In contrast, major mine debris flow disasters are rare in areas with flatter topography or semi-arid climatic conditions, such as the majority of China’s first terrace, the Tarim Basin, and the northeast.
5. Regional Comprehensive Evaluation of Mine Debris Flow Distribution
The analysis of the distribution pattern of major mine debris flow, the clarification of the key areas of mine debris flow disaster prevention, and the formulation of localized counter measures for mine debris flow prevention and control on a national scale can help improve the economy, accuracy and effectiveness of prevention and control measures, and provide great benefits for China’s disaster prevention and mitigation work. Combined with the previous summary of the law of temporal change and spatial distribution of mine debris flow, the influencing factors of the distribution of major mine debris flow are extracted and combined with the AHP hierarchical analysis method to make a regional comprehensive evaluation of the possibility of mine debris flow occurrence.
5.1. Selection of Impact Factors and Determination of Their Weights
Influencing factors mainly come from two aspects, natural environmental factors include: ① topography and geomorphology: landform types and distribution, elevation, gully bed ratio and shape, slope, gully density; ② Geological conditions: rock formations, geological structure, stratigraphy, regional mineral profile, tectonic movements, lithologic characters; ③ meteorology and hydrology: surface runoff, watershed area, unit rainfall, frequency and intensity of heavy rainfall; and ④ vegetation cover. Anthropogenic factors include: intensity of mining activities, changes in ground structure, unreasonable piling and discharging of mining waste, stability of structures, ecological impact, input of prevention, and control measures.
Many factors are interrelated and work together to make the spatial and temporal distribution of major mine debris flows complex and variable. In order to explore their intrinsic links, the geological environment, tectonic conditions, multi-year average daily maximum precipitation, vegetation cover, and human factors of major mine debris flow occurrence were selected as evaluation factors based on the collected data combined with the relevant literature [28][29][30]. The AHP hierarchical analysis was applied to compare the importance of the factors in the hierarchical model using the “1–9 Scale Method”; moreover, psychological experiments have shown that this method can reflect the ability of most people to discriminate between different things of the same attributes and is widely known and applied.
The results of the AHP hierarchical analysis based on the judgment matrix are listed in Table 1. The detailed calculation process is as follows:
-
The judgment matrix is normalized by column vector to obtain the new matrix.
-
The new matrix is summed by rows to obtain the column vector ω, which is the eigenvector of the judgment matrix.
-
The column vector changes to the weight vector W after normalization, i.e., the vector composed of the weight values Wi.
Table 1. AHP Hierarchical analysis results.
| Item | Eigenvector (ω) | Weighting Value (Wi) | Maximum Eigenroot (λmax) | CI |
|---|---|---|---|---|
| Geological environment | 0.672 | 13.435% | 5.243 | 0.061 |
| Tectonic conditions | 0.339 | 6.778% | ||
| Multi-year average daily maximum precipitation | 2.514 | 50.282% | ||
| Vegetation cover | 0.174 | 3.482% | ||
| Anthropogenic factors | 1.301 | 26.023% |
From Table 1, it can be seen that a fifth order judgment matrix was constructed for a total of five items: geological environment, tectonic conditions, multi-year average daily maximum precipitation, vegetation cover, and anthropogenic factors. The eigenvector were ω (0.672, 0.339, 2.514, 0.174, 1.301)T. For better understanding and operation, the weighting factors are defined as total 100% in this method (i.e., normalization), and the corresponding weight values Wi of the five items are: 13.435, 6.778, 50.282, 3.482 and 26.023%.
Consistency testing of the judgment matrix is required to obtain each weight value using the AHP hierarchical analysis:
-
Combined with the eigenvector ω, the maximum eigenroot λmax = 5.243 can be calculated.
-
Then, the CI = 0.061 is calculated using the maximum eigenroot value.
-
The query obtains the average random consistency index RI = 1.120 for the fifth order judgment matrix.
5.2. Comprehensive Evaluation Model
The evaluation factors are graded and assigned a score Fi according to the proportion of significant mine debris flow occurring in different spatial and temporal conditions to the total statistics combined with the qualitative analysis of the impact degree to achieve quantification (Table 2). The evaluation of mine debris flow distribution area is calculated by multi-factor composite index method, and the composite index F is the comprehensive quantitative value of mine debris flow distribution area evaluation, and the threshold value is set according to the size of F to grade the mine debris flow distribution area. The comprehensive index of mine debris flow distribution area evaluation is obtained by the weighted superposition calculation of each evaluation factor, and its calculation model is:

F—comprehensive index of regional evaluation.
Wi—the weight value of each evaluation factor, obtained from Table 1.
Fi—the quantitative value of the score of each evaluation factor, obtained from Table 2.
Table 2. Rating factor assignment.
| Fi | 0 | 3 | 7 | 10 |
|---|---|---|---|---|
| Geological environment | middle and high mountain areas | low mountain and hilly areas | plain basin areas and permafrost areas | Gobi Desert sand areas and Loess Plateau areas |
| Tectonic conditions | high degree of tectonic development, many loose deposits, high intensity of neotectonic activity | high degree of tectonic development, many loose deposits, low intensity of neotectonic activity | medium degree of tectonic development, few loose deposits | low degree of tectonic development, few loose deposits |
| Multi-year average daily maximum precipitation | 100–200 mm | 50–100 >200 mm |
<50 mm | - |
| Vegetation cover | <10% | 10–30% | 30–60% | >60% |
| Anthropogenic factors | high intensity of mining activities, the existence of unreasonable pile and row, engineering instability | high intensity of mining activities with impact on environment and geotechnical stability | medium intensity of mining activities, high engineering stability | low intensity of mining activities, high engineering stability, with prevention and control works |
The model calculates the evaluation score of major mine debris flow area (Figure 2) and divides the grade according to the selected threshold value of the score: F ≥ 8: the geological environment of mines in this area is difficult to the formation of debris flow, gentle terrain, no geological hazards, few loose piles, no hydrodynamic conditions, high vegetation coverage, low intensity of mining activities, prevention and control projects. 8 > F ≥ 6: The geological environment of mines in this area is unfavorable to the formation of debris flow, less undulating terrain, less destructive geological hazards, fewer loose piles, not rich in hydrodynamic conditions, high vegetation coverage, and less hazards caused by mining development activities. 6 > F ≥ 3: the mining geological environment in this area is more favorable to the formation of debris flow, more undulating terrain, more geological hazards, more loose piles, more abundant hydrodynamic conditions, less vegetation cover, and frequent mining development activities. F < 3: The geological environment of the mine in this area is very favorable to the formation of debris flow, steep terrain, frequent geological hazards, more loose piles, rich hydrodynamic conditions, low vegetation cover, high intensity of mining development activities, presence of unreasonable piles and drains, and poor engineering stability.
References
- Hu, H.; Peng, L.; Wang, G.J.; Liu, W.L.; Zhou, H.M.; You, G.M.; Guo, L.J. Influence of Tailings Dam Failure under Heavy Rainfall Flood. Nonferrous Met. Eng. 2022, 12, 132–138+147.
- Chen, T.F.; Cui, P.; Liu, S.H.; Hou, L.G. Anthropogenic Debris Flow disasters and Mitigation Countermeasures in mineral resoures exploitation in China. J. Eng. Geol. 2005, 13, 179–182.
- Lindahl, J. Environmental impacts of mining in Zambia. Towards better environmental management and sustainable exploitation of mineral resources. Geol. Surv. Swed. 2014, 27, 27.
- Ruyters, S.; Mertens, J.; Vassilieva, E. The red mud accident in Ajka (Hungary): Plant toxicity and trace metal bioavailability in red mud contaminated soil. Environ. Sci. Technol. 2011, 45, 1616–1622.
- Carmo, F.F.D.; Kamino, L.H.Y.; Junior, R.T. Fundão tailings dam failures:the environment tragedy of the largest technological disaster of Brazilian mining in global context. Perspect. Ecol. Conserv. 2017, 15, 145–151.
- Lyu, Z.J.; Chai, J.R.; Xu, Z.G. A Comprehensive Review on Reasons for Tailings Dam Failures Based on Case History. Adv. Civ. Eng. 2019, 2019, 4159306.
- Tarolli, P.; Sofia, G. Human topographic signatures and derived geomorphic processes across landscapes. Geomorphology 2016, 255, 140–161.
- Fuller, I.C.; Macklin, M.G.; Richardson, J.M. The geography of the Anthropocene in New Zealand: Differential river catchment response to human impact. Geogr. Res. 2015, 53, 255–269.
- Herrera, G.; Tomas, R.; Vincente, F. Mapping ground movements in open pit mining areas using differential SAR interferometry. Int. J. Rock Mech. Min. Sci. 2010, 47, 1114–1125.
- Mossa, J.; James, L.A. Impacts of mining on geomorphic systems. Treatise Geomorph. 2013, 13, 74–95.
- Ellis, E.C. Anthropogenic transformation of the terrestrial biosphere. Phys. Eng. Sci. 2011, 369, 1010–1035.
- Dacal, M.; Bradford, M.A.; Plaza, C. Soil microbial respiration adapts to ambient temperature in global drylands. Nat. Ecol. Evol. 2019, 3, 232–238.
- Guernic, L.A.; Sanchez, W.; Bado, N.A. In situ effects of metal contamination from former uranium mining sites on the health of the three-spined stickleback (Gasterosteus aculeatus, L.). Ecotoxicology 2016, 25, 1234–1259.
- Sonter, L.J.; Dade, M.C.; Wastson, J.E.M. Renewable energy production will exacerbate mining threats to biodiversity. Nat. Commun. 2020, 11, 4174.
- Van, D.E.A.; Baker, A.J.M.; Reeves, R.D. Agromining: Farming for metals in the future. Environ. Sci. Technol. 2015, 49, 4773–4780.
- Vriens, B.; Peterson, H.; Laurenzi, L. Long-term monitoring of waste-rock weathering at the Antamina mine, Peru. Chemosphere 2019, 215, 858–869.
- Maboeta, M.S.; Van, R.L. Bioconversion of sewage sludge and industrially produced woodchips. Water Air Soil Pollut. 2003, 150, 219–233.
- Werner, T.T.; Bach, P.M.; Yellishetty, M. A Geospatial Database for Effective Mine Rehabilitation in Australia. Minerals 2020, 10, 745.
- Lottermoser, B.G. Mine wastes. In Characterization, Treatment and Environmental Impacts; Springer: Berlin/Heidelberg, Germany, 2010; pp. 153–181.
- Wang, Y.; Zeng, W.; Zhao, L.H. Mine Debris Flow Prediction Methodology—Example of Mine A Analysis. Site Investig. Sci. Technol. 1985, 5, 11–15.
- Xie, H.P. Fractal Geometry and Its Application to Rock and Soil Materials. Chin. J. Geotech. Eng. 1992, 14, 14–24.
- Xu, Y.N.; He, F.; Zhang, J.H.; Chen, H.Q.; Xu, D.Y.; Yang, M.; Qiao, Y.J. Characteristics and Strategy for Prevention and Reduction of Mine Debris Flow. Mt. Res. 2010, 28, 463–469.
- Xu, Y.N.; Zhang, J.H.; He, F.; Liu, R.P.; Chen, H.Q.; Qiao, G.; Ke, H. Investigation and Preventive Research of Mine Geological Environment in Northwest China. Northwestern Geol. 2022, 55, 129–139.
- Bai, Y.D. Study on the development and distribution law of typical geological hazards in mines. World Nonferrous Met. 2021, 22, 116–117.
- Wang, G.J.; Zhao, B.; Wu, B.S.; Wang, M.L.; Liu, W.L.; Zhou, H.M.; Zhang, C.; Wang, Y.S.; Han, Y.B. Research on the Macro-Mesoscopic Response Mechanism of Multisphere Approximated Heteromorphic Tailing Particles. Lithosphere 2022, 2022, 1977890.
- Wang, G.J.; Zhao, B.; Wu, B.S.; Zhang, C.; Liu, W.L. Intelligent prediction of slope stability based on visual exploratory data analysis of 77 in situ cases. Int. J. Min. Sci. Technol. 2023, 33, 47–59.
- He, F.; Xu, Y.N.; Qiao, G.; Liu, R.P. Regional distribution characteristics of mine environmental geological problems in China. Geol. China 2010, 37, 1520–1529.
- Wen, G.J.; Deng, W.J.; Yang, L.; Peng, H.Y.; Xie, X.T. Based on the AHP of potentiality degree assessment of mine debris flow in mountainous area of Chongqing. Chin. J. Geol. Hazard Control 2017, 28, 92–96.
- Li, C.X.; Ma, Y.; He, Y.X. Sensitivity analysis of debris flow to environmental factors: A case of Longxi River basin in Dujiangyan, Sichuan Province. Chin. J. Geol. Hazard Control 2020, 31, 32–39.
- Lyu, X.B.; You, Y.; Li, D.L. Characteristics and Mitigation Measures of Banzi Gully Debris Flow on August 20th, 2019, in Wenchuan County, Sichuan. J. Disaster Prev. Mitig. Eng. 2022, 42, 12–23.
More
Information
Subjects:
Area Studies
Contributors
MDPI registered users' name will be linked to their SciProfiles pages. To register with us, please refer to https://encyclopedia.pub/register
:
View Times:
689
Revisions:
2 times
(View History)
Update Date:
27 Apr 2023
Table of Contents


Notice
You are not a member of the advisory board for this topic. If you want to update advisory board member profile, please contact office@encyclopedia.pub.
OK
Confirm
Only members of the Encyclopedia advisory board for this topic are allowed to note entries. Would you like to become an advisory board member of the Encyclopedia?
Yes
No
${ textCharacter }/${ maxCharacter }
Submit
Cancel
Back
Comments
${ item }
|
${ item.createdUser.fullName }
${ item.createdAt }
${ item.vote }
${ item.reply }
Delete
${ reply.createdUser.fullName }
${ reply.createdAt }
${ reply.vote }
Delete
There is no reply to this comment~
${ item.replyTextCharacter }/${ item.replyMaxCharacter }
Submit
Cancel
More
No more~
There is no comment~
${ textCharacter }/${ maxCharacter }
Submit
Cancel
${ selectedItem.replyTextCharacter }/${ selectedItem.replyMaxCharacter }
Submit
Cancel
Confirm
Are you sure to Delete?
Yes
No