Your browser does not fully support modern features. Please upgrade for a smoother experience.
Submitted Successfully!
 +1 credit
Thank you for your contribution! You can also upload a video entry or images related to this topic.
For video creation, please contact our Academic Video Service.
| Version | Summary | Created by | Modification | Content Size | Created at | Operation |
|---|---|---|---|---|---|---|
| 1 | Konstantin Boris Yenkoyan | -- | 2062 | 2023-04-16 20:34:32 | | | |
| 2 | Lindsay Dong | -22 word(s) | 2040 | 2023-04-17 02:42:01 | | |
Video Upload Options
We provide professional Academic Video Service to translate complex research into visually appealing presentations. Would you like to try it?
Cite
If you have any further questions, please contact Encyclopedia Editorial Office.
Shevlyakov, A.D.; Kolesnikova, T.O.; De Abreu, M.S.; Petersen, E.V.; Yenkoyan, K.B.; Demin, K.A.; Kalueff, A.V. Common Network of Molecular Pathways of Epilepsy. Encyclopedia. Available online: https://encyclopedia.pub/entry/43092 (accessed on 28 July 2026).
Shevlyakov AD, Kolesnikova TO, De Abreu MS, Petersen EV, Yenkoyan KB, Demin KA, et al. Common Network of Molecular Pathways of Epilepsy. Encyclopedia. Available at: https://encyclopedia.pub/entry/43092. Accessed July 28, 2026.
Shevlyakov, Anton D., Tatiana O. Kolesnikova, Murilo S. De Abreu, Elena V. Petersen, Konstantin B. Yenkoyan, Konstantin A. Demin, Allan V. Kalueff. "Common Network of Molecular Pathways of Epilepsy" Encyclopedia, https://encyclopedia.pub/entry/43092 (accessed July 28, 2026).
Shevlyakov, A.D., Kolesnikova, T.O., De Abreu, M.S., Petersen, E.V., Yenkoyan, K.B., Demin, K.A., & Kalueff, A.V. (2023, April 16). Common Network of Molecular Pathways of Epilepsy. In Encyclopedia. https://encyclopedia.pub/entry/43092
Shevlyakov, Anton D., et al. "Common Network of Molecular Pathways of Epilepsy." Encyclopedia. Web. 16 April, 2023.
Copy Citation
Epilepsy is a highly prevalent, severely debilitating neurological disorder characterized by seizures and neuronal hyperactivity due to an imbalanced neurotransmission. As genetic factors play a key role in epilepsy and its treatment, various genetic and genomic technologies continue to dissect the genetic causes of this disorder.
epilepsy
molecular network
in silico modeling
1. Introduction
Epilepsy is a widespread, severely debilitating and complex neurological disorder characterized by central nervous system (CNS) hyperactivity, epileptic seizures and a general imbalance of excitatory and inhibitory neurotransmission. Caused by multiple external and internal factors that range from genetic mutations to infections, birth defects, stroke, and traumatic brain injuries [1], epilepsy is highly prevalent globally, with nearly 70 million people affected worldwide [2]. Furthermore, despite recent progress in antiepileptic drug development, their efficacy remains low due to various treatment-resistant types of epilepsy and multiple reported side effects (e.g., memory loss, neurotoxicity, suicides and even mortality) [3].
Genetic factors play an important role in the pathogenesis of epilepsy and modulating its sensitivity to antiepileptic therapy [1][4]. The application of genetic and genomic technologies has tremendously facilitated the discovery of genetic causes of epilepsy. For example, genome-wide association studies (GWAS) have identified multiple genes as risks of developing epilepsy, linking specific low-level somatic mutations to intractable epilepsy [5][6][7][8].


2. Generation of a Global Molecular Network for Epilepsy
To generate a comprehensive network of molecular interactions, s analyzed multiple established human epilepsy-related genes identified previously [5] and also added new relevant information with searches performed on the Online Mendelian Inheritance in Man database (OMIM, www.omim.org/, accessed on 22 November 2022), using “epilepsy/epilepsy encephalopathy/epileptic” as search terms. s then used several publicly available genetic resources, including the Gene Cards database (www.genecards.org/, accessed on 22 November 2022) and searching publications since 1996 relevant to clinical epilepsy (search terms “epilepsy/epileptic” + gene name) in PubMed database (www.ncbi.nlm.nih.gov/pubmed/, accessed on 22 November 2022), collectively yielding a comprehensive list of 623 candidate epilepsy-linked genes whose associated phenotypes show high variability in epilepsy and other clinical manifestations. The analyses excluded several genes described as “functional categories of the neurodevelopment-associated epilepsy genes” [5], but not reconfirmed as associated with epilepsy in PubMed and OMIM databases. Using the generated list of putative epilepsy-associated genes, scholars next constructed their global molecular interaction network (based on known protein-protein interactions, PPIs) in order to identify potential key interactors that can contribute to epilepsy pathogenesis.
Finally, clustering these molecular networks based on known molecular interactions between the protein products of identified genes allowed us to identify critical molecular pathways associated with epilepsy. For this, scholars used the search tool for the retrieval of interacting genes/protein database (STRING version 11.5; available online: www.string-db.org, accessed on 22 November 2022) with medium confidence interval (0.40) selected for building the molecular network. To link all main clusters and identify novel potential epilepsy-associated genes, scholars added the number of interactors (20 interactors for the “1st shell” and 60 for the “2nd shell”) to the network settings, chosen here to ensure sufficient interconnectedness between the main clusters within the overall PPI network.
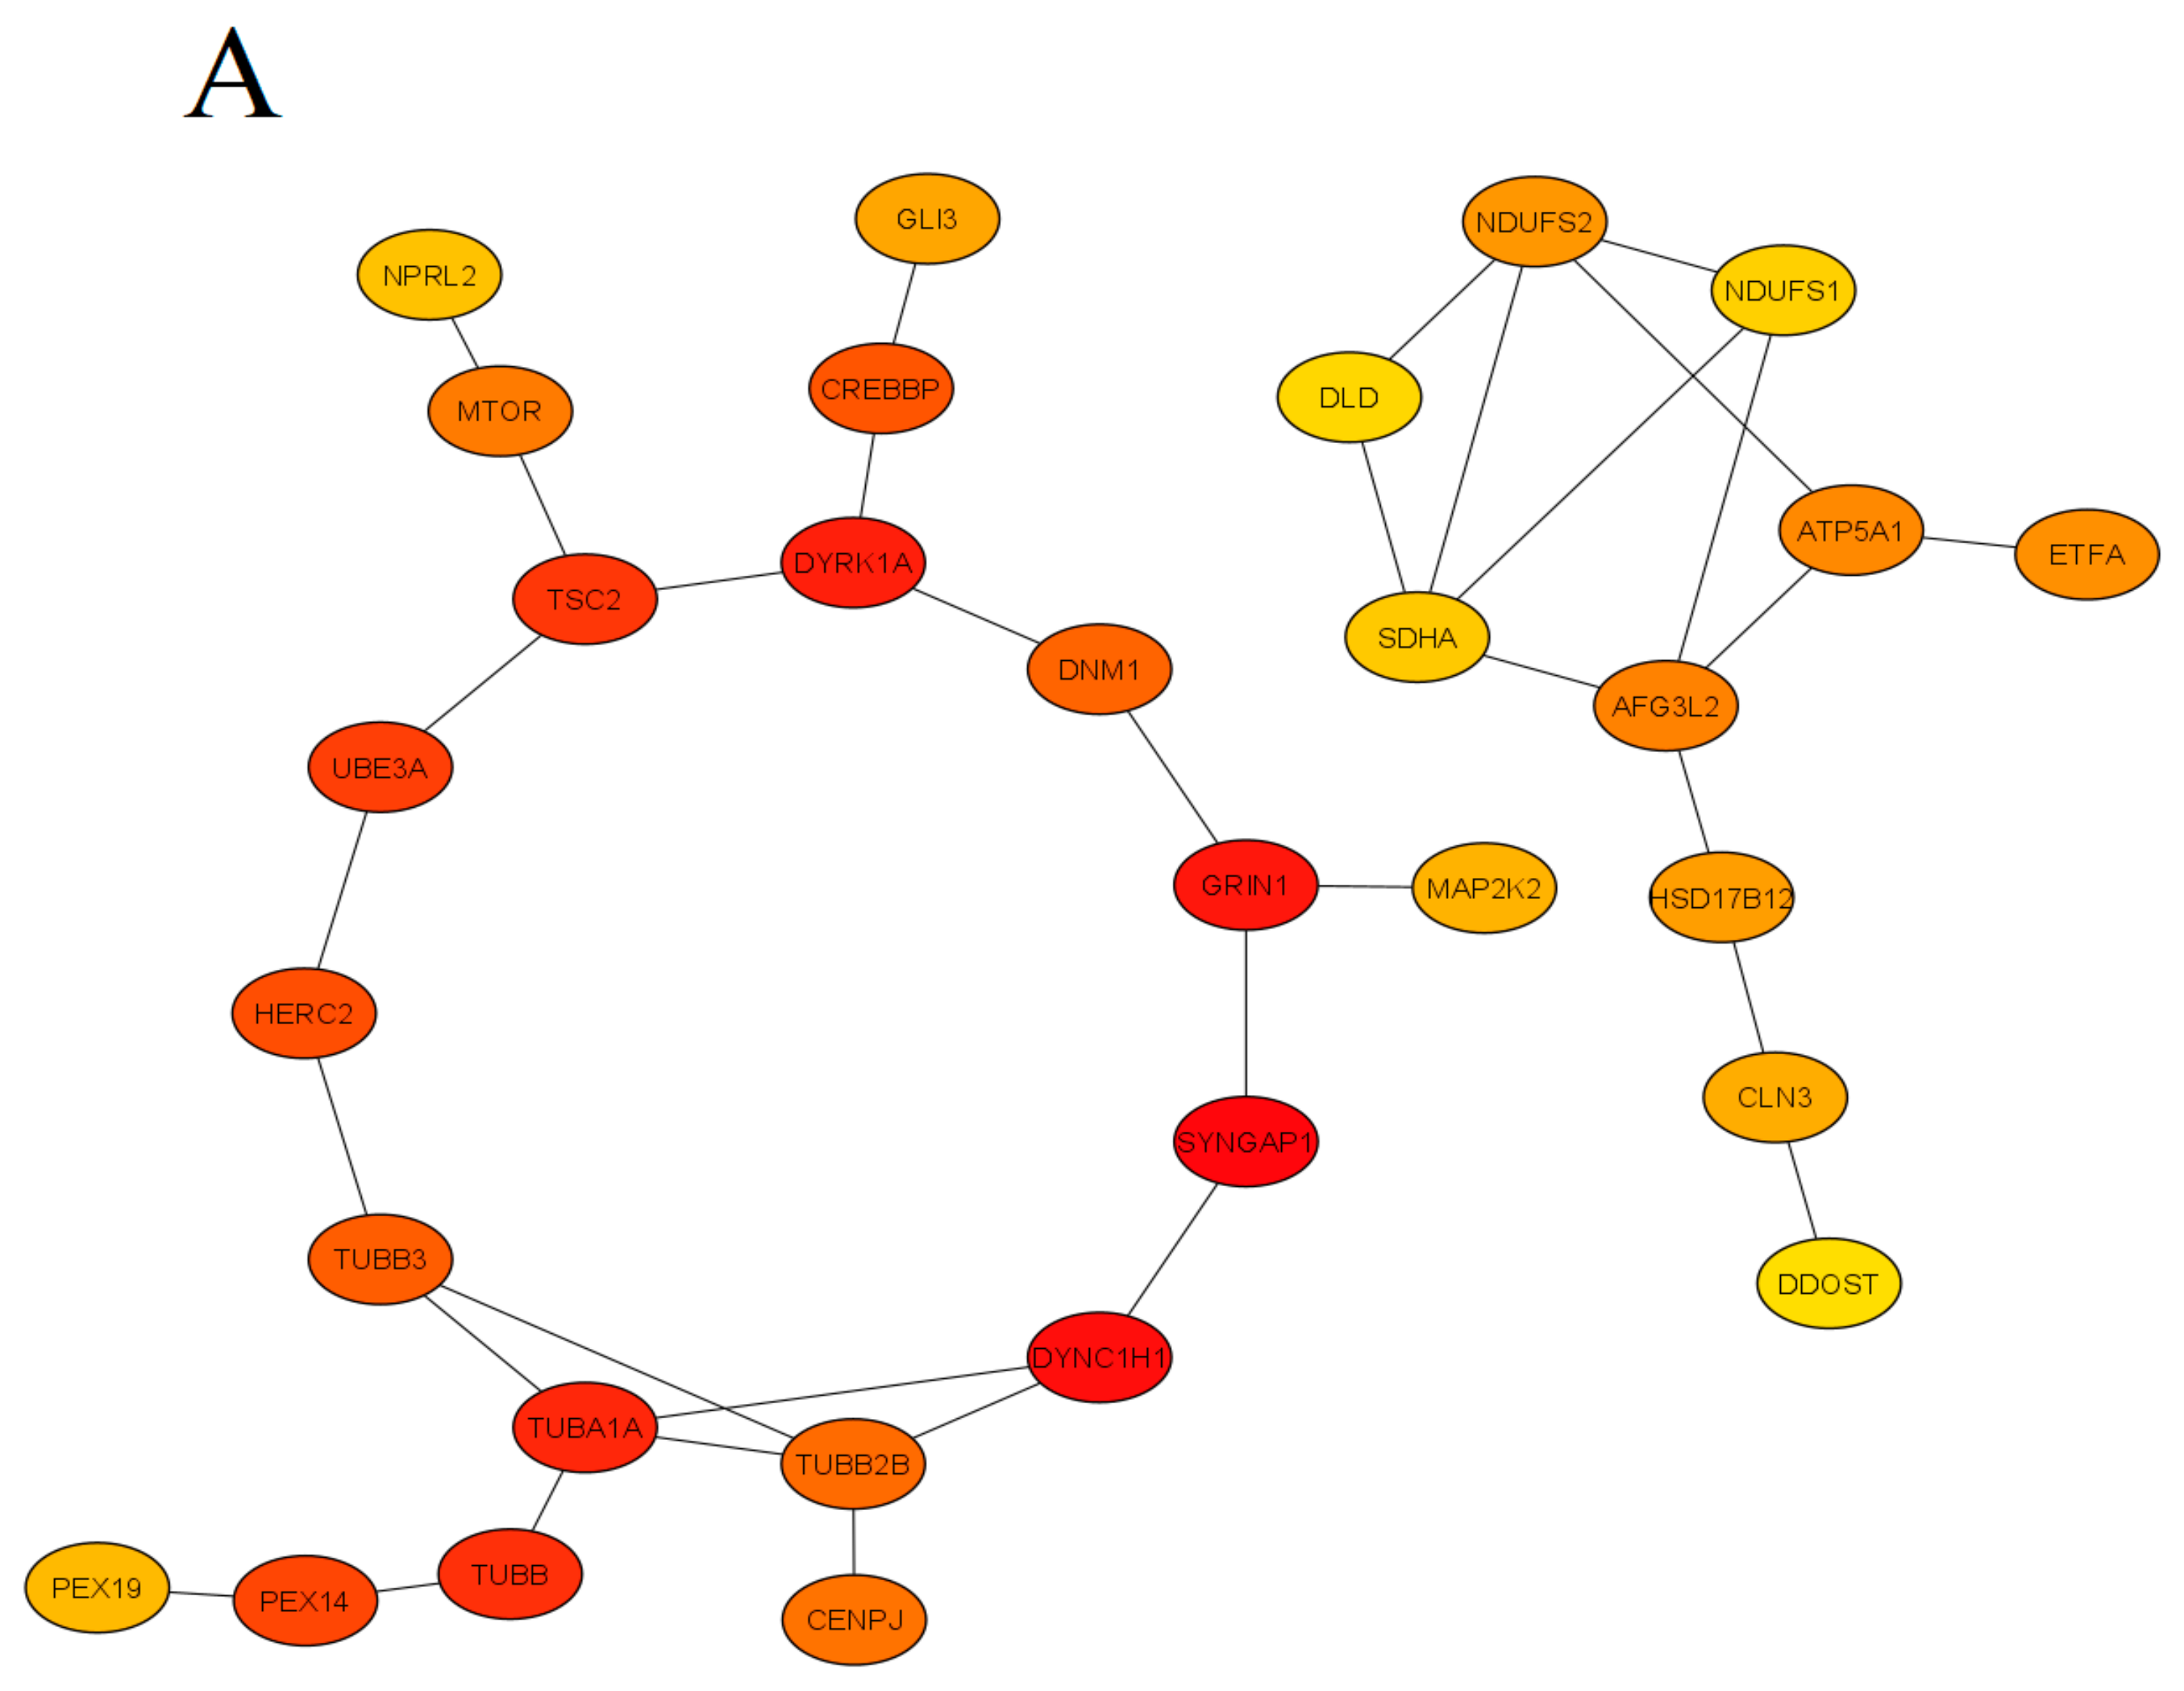
This approach has generated a list of additional 74 putative genes likely positioned within epilepsy-associated pathways, 29 of which have been reconfirmed by published findings in PubMed, hence confirming their clinical role in epilepsy. The present study employed a conservative approach to selecting molecular interactors, using only “experimental data” as the search criterion (i.e., not assessing indirect evidence, such as text mining, co-occurrence or co-expression data) to generate a comprehensive molecular PPI network (Figure 1).
Figure 1. The protein-protein interaction (PPI) network obtained and visualized using the STRING database. Nodes denote individual proteins, thickness of edges represents their respective interaction scores. The network was divided into four panels (A–D); continued on the next pages, for convenience of visual presentation. Panel A mostly represents products of the mTOR system, chromatin remodeling, zinc fingers clusters and others intermediate genes. Panel B contains mainly cytoskeletal, cell division, peroxisomal, gamma-aminobutyric acid (GABA)-ergic and translation elongation initiation gene products. Panel C consists mainly of glutamate receptor- and potassium channel-related proteins. Panel D represents mitochondrial and N-oligosaccharyl transferase gene clusters.
Finally, the STRING database linked 329 of 623 into a single molecular network, leaving 240 genes that did not link to other genes and 89 genes that formed two- or three-gene clusters unlinked to the main built molecular network. The results of the analyses were next visualized using the STRING tools, as well as the CytoHubba plugin of the Cytoscape (version 3.9.1) software, searching for ‘hub’ genes from the global PPI network, as assessed by a combination of Betweenness, Stress and BottleNeck methods (Figure 2). Specifically, genes were deemed ‘hub’ if highly ranked by all three methods, which were chosen here for their known best performance in global network-based analyses from hub proteins from clusters of heterogeneous networks [9]. Betweenness centrality measures the number of times a node lies on the shortest path between other nodes. Betweenness identifies the nodes acting as “bridges” between nodes in a network, analyzing all its shortest paths and then counting how many times each node falls on one. The BottleNeck algorithm similarly searches for the shortest path between the nodes, albeit computing the minimum weight edge in the shortest path. The Stress of a node in a protein-signaling network represents the relevance of a protein as functionally capable of holding together communicating PPI nodes (its higher values reflect higher relevance of a protein for connecting regulatory molecules).
Figure 2. Summary of modules extracted from the global protein-protein interaction (PPI) network based on their Betweenness centrality (Panel (A), 30 nodes and 35 edges), Stress centrality (Panel (B), 30 nodes and 36 edges) and BottleNeck centrality (Panel (C), 30 nodes and 38 edges). Colors denote significance (high-ranked modules = red, low-ranked modules = yellow).
To identify significantly enriched molecular pathways,scholars applied GO biological process and KEGG pathway enrichment analyses of hub genes (Figure 3), using the ShinyGO (www.bioinformatics.sdstate.edu/go/, accessed on 15 February 2022) version 0.77 tool with adjusted p-value < 0.05 considered as statistically significant.
Figure 3. Enrichment analysis of the ‘hub’ genes identified in the present study. Color represents the -log10 (false discovery rate) of the pathway/terms, the X axis represents the enrichment, as assessed for top 10 genes by the KEGG (Kyoto Encyclopedia of Genes and Genomes) pathway (A) and GO (Gene Ontology) terms (B).
3. Identified Pathways
Epilepsy pathogenesis is traditionally linked to neuronal hyperactivation that arises from aberrant ion channel (especially, Ca++ and K+) activity, imbalanced excitatory and inhibitory neurotransmission, or shifting the number of excitatory vs. inhibitory neurons [1][2][10], also see Figure 4 further.
Figure 4. Summary diagram mapping main biomolecular pathways involved in epilepsy pathogenesis. Known biological interactions between protein products of various epilepsy-related genes are presented as bigger clusters, with selected key proteins highlighted in green, and identified central ‘hub’ genes (interconnected with most genes and clusters) in yellow. Genes originally not associated with epilepsy are shown in white, and genes not forming clusters highlighted in orange.
3.1. Mitochondrial and Metabolic Genes
Mitochondrial and metabolic genes formed one of the largest PPI clusters in the present study (Figure 4). Although mitochondrial encephalopathies often present epileptic symptoms clinically [11], mitochondria-related epilepsy is commonly caused by mutations of mitochondrial DNA [12]. Such deficits usually affect tissues with high energy needs, including the brain, hence resulting in epilepsy when brain metabolism is disturbed. However, based on the systems biology-based analyses (Figure 4), mutations of the mitochondrial genome can impact other, higher-level systems that may also be relevant to epilepsy pathogenesis. Indeed, since many molecular processes are ATP-dependent, if a mutation occurs in a mitochondrial gene, there is a high risk of disrupting such ATP-dependent mechanisms in general. For example, as can be seen in Figure 4, the mitochondrial complex is directly related to many other cellular systems and processes, such as the exosomal complex, the mTOR signaling, the N-oligosaccharyltransferase cluster, chromatin remodeling, as well as transcription and translation factors, whose functional activity depends on normally functioning mitochondria, and may therefore be disrupted by mutations in mitochondrial genes.
Directly linked to them, the exosomal complex genes are also involved in the maturation and degradation of various types of RNA, and thereby can play an important role in epigenetic regulation. The exosomal complex modulates the activity of mitochondrial genes, regulating their expression using microRNAs [13].
Genes of the N-oligosaccharyltransferase complex are crucial for cell development and survival. Congenital glycosylation disorders (CDG) are a heterogeneous group of congenital metabolic diseases with multisystem clinical lesions [14][15][16][17] due to mutations in N-linked glycosylation genes, that may also affect CNS and, thus, contribute to epilepsy [18]. Multiple mannosyltransferase genes are also located in this gene cluster (Figure 4), and their aberrant activity is associated with a very rare subtype of CDG, accompanied by several forms of early-onset epileptic encephalopathies [19][20].
3.2. The mTOR Signaling Pathway
The mammalian target of rapamycin (mTOR) pathway is a key signaling system regulating cell growth, development, proliferation and motility. Like mitochondrial genes, mutations within the mTOR pathway genes are the commonest cause of epilepsy, often accompanying focal cortical dysplasia (PCD) and other cortical malformations [8][10][21]. MTOR functions as a serine/threonine protein kinase forming two main complexes, mTORC1 and mTORC2. MTOR acts as a protein tyrosine kinase that promotes the activation of insulin receptors and insulin-like growth factor receptors [22].
Notably, the mTOR system is associated with glutamate signaling, Ca++ genes and the mitochondrial compartment (Figure 2). Furthermore, the mTOR pathway is controlled by multiple other mechanisms, including the methyl CpG-binding protein 2 gene (MECP2), an epigenetic regulator with several important functions in the brain [23]. De novo mutations of X-linked MECP2 are the main cause of Rett syndrome often involving epileptic symptoms [24]. MECP2 mutations in humans with Rett syndrome are associated with impaired regulation of nucleolin, rRNA transcripts, and mTOR signaling through participation in post-transcriptional processing of certain microRNAs [25][26].
Another important mTOR regulator involved in epilepsy is dual specificity tyrosine-phosphorylation-regulated kinase 1A (DYRK1A), an inhibitor of mTORC1. In contrast, its overexpression increases phosphorylation and activity of both TSC1 and TSC2, whereas increased phosphorylation of S6K1 and 4E-BP1 is observed in DYRK1A knockdown cancer cells—the effect inhibited by the mTOR-inhibiting drug rapamycin [27][28]. A deficiency in ubiquitin protein ligase E3A (UBE3A) also modulates the mTOR system activity, elevating levels of TSC2 responsible for inhibiting mTOR, hence hyperactivating the mTORC1-S6K1 pathway [29].
3.3. Transcription Factors and Chromatin Remodeling Genes
As shown in Figure 4, genes of the mTOR pathway, such as MECP2 and DYRK1A, also interact with other genes, including the gene of the CREB binding protein (CREBBP), a critical cellular epigenetic regulator and a common transcription factor that specifically binds to DNA upstream of the 5′ ends of genes to initiate the landing of RNA polymerase, thereby exerting its regulatory effects. Although some tumor-related transcription factors can participate in the pathogenesis of neurological diseases, the transcription factor genes have not been viewed as classical epilepsy-associated genes, and their putative role in epilepsy merits further scrutiny [30]. In the present study, CREBBP has emerged as one of the central hub genes of the generated epilepsy PPI network (Figure 1).
REST (RE1 silencing transcription factor) is an important transcriptional repressor that silences target genes through epigenetic remodeling, thereby regulating neurogenesis, differentiation and the expression of specific genes controlling brain development. REST, like CREBBP, regulates numerous target genes that encode neuronal receptors, ion channels, neuropeptides and synaptic proteins, key for synaptic plasticity and vesicular transport [31][32][33]. Not surprisingly, REST and CREBBP are both prominently present in the epilepsy PPI network generated here (Figure 1).
CRFs play a crucial role in epigenetic regulation, determining the activity of transcription factors by forming open sections of DNA for their landing. Chromatin remodeling is an ATP- and actin-dependent process, and may therefore be directly linked to the mitochondrial and cytoskeleton gene clusters [34] implicated in epilepsy by the analyses (Figure 1).
3.4. Cytoskeleton and Cell Division
In epileptic brain, cytoskeletal disruption is often viewed as being secondary to aberrant neuronal activity. However, mounting data indicate that cytoskeletal and cell division genes are critical factors in the pathogenesis of epilepsy, as well as neuronal migration disorders and channelopathies [35][36]. The cell cycle genes are also involved in neuronal migration and proliferation, and are closely related to cytoskeletal function as well. For instance, commonly causing epilepsy, mutations in tubulin coding genes [37][38] are responsible for a wide range of brain malformations secondary to abnormal neuronal migration, manifesting as motor disorders, mental retardation and epilepsy [39]. Moreover, tubulin is an important protein for the transport of the gamma aminobutyric acid A (GABA-A) receptors and for formation of peroxisomes [38][40][41].
References
- Sanchez-Carpintero Abad, R.; Sanmarti Vilaplana, F.X.; Serratosa Fernandez, J.M. Genetic causes of epilepsy. Neurologist 2007, 13 (Suppl. 1), S47–S51.
- Thijs, R.D.; Surges, R.; O’Brien, T.J.; Sander, J.W. Epilepsy in adults. Lancet 2019, 393, 689–701.
- Moshe, S.L.; Perucca, E.; Ryvlin, P.; Tomson, T. Epilepsy: New advances. Lancet 2015, 385, 884–898.
- Myers, K.A.; Johnstone, D.L.; Dyment, D.A. Epilepsy genetics: Current knowledge, applications, and future directions. Clin. Genet. 2019, 95, 95–111.
- Wang, J.; Lin, Z.J.; Liu, L.; Xu, H.Q.; Shi, Y.W.; Yi, Y.H.; He, N.; Liao, W.P. Epilepsy-associated genes. Seizure 2017, 44, 11–20.
- Sim, N.S.; Ko, A.; Kim, W.K.; Kim, S.H.; Kim, J.S.; Shim, K.W.; Aronica, E.; Mijnsbergen, C.; Spliet, W.G.M.; Koh, H.Y.; et al. Precise detection of low-level somatic mutation in resected epilepsy brain tissue. Acta Neuropathol. 2019, 138, 901–912.
- Ribierre, T.; Deleuze, C.; Bacq, A.; Baldassari, S.; Marsan, E.; Chipaux, M.; Muraca, G.; Roussel, D.; Navarro, V.; Leguern, E.; et al. Second-hit mosaic mutation in mTORC1 repressor DEPDC5 causes focal cortical dysplasia-associated epilepsy. J. Clin. Investig. 2018, 128, 2452–2458.
- Guerrini, R.; Cavallin, M.; Pippucci, T.; Rosati, A.; Bisulli, F.; Dimartino, P.; Barba, C.; Garbelli, R.; Buccoliero, A.M.; Tassi, L.; et al. Is Focal Cortical Dysplasia/Epilepsy Caused by Somatic MTOR Mutations Always a Unilateral Disorder? Neurol. Genet. 2021, 7, e540.
- Chin, C.H.; Chen, S.H.; Wu, H.H.; Ho, C.W.; Ko, M.T.; Lin, C.Y. cytoHubba: Identifying hub objects and sub-networks from complex interactome. BMC Syst. Biol. 2014, 8 (Suppl. 4), S11.
- Baldassari, S.; Licchetta, L.; Tinuper, P.; Bisulli, F.; Pippucci, T. GATOR1 complex: The common genetic actor in focal epilepsies. J. Med. Genet. 2016, 53, 503–510.
- Kang, H.C.; Lee, Y.M.; Kim, H.D. Mitochondrial disease and epilepsy. Brain Dev. 2013, 35, 757–761.
- Rahman, S. Mitochondrial disease and epilepsy. Dev. Med. Child Neurol. 2012, 54, 397–406.
- Tian, F.; Tang, P.; Sun, Z.; Zhang, R.; Zhu, D.; He, J.; Liao, J.; Wan, Q.; Shen, J. miR-210 in Exosomes Derived from Macrophages under High Glucose Promotes Mouse Diabetic Obesity Pathogenesis by Suppressing NDUFA4 Expression. J. Diabetes Res. 2020, 2020, 6894684.
- Nakagawa, H.; Hato, M.; Takegawa, Y.; Deguchi, K.; Ito, H.; Takahata, M.; Iwasaki, N.; Minami, A.; Nishimura, S. Detection of altered N-glycan profiles in whole serum from rheumatoid arthritis patients. J. Chromatogr. B Analyt. Technol. Biomed. Life Sci. 2007, 853, 133–137.
- Bermingham, M.L.; Colombo, M.; McGurnaghan, S.J.; Blackbourn, L.A.K.; Vuckovic, F.; Pucic Bakovic, M.; Trbojevic-Akmacic, I.; Lauc, G.; Agakov, F.; Agakova, A.S.; et al. N-Glycan Profile and Kidney Disease in Type 1 Diabetes. Diabetes Care 2018, 41, 79–87.
- Kodar, K.; Stadlmann, J.; Klaamas, K.; Sergeyev, B.; Kurtenkov, O. Immunoglobulin G Fc N-glycan profiling in patients with gastric cancer by LC-ESI-MS: Relation to tumor progression and survival. Glycoconj. J. 2012, 29, 57–66.
- Chen, G.; Wang, Y.; Qin, X.; Li, H.; Guo, Y.; Wang, Y.; Liu, H.; Wang, X.; Song, G.; Li, F.; et al. Change in IgG1 Fc N-linked glycosylation in human lung cancer: Age- and sex-related diagnostic potential. Electrophoresis 2013, 34, 2407–2416.
- Patterson, M.C. Metabolic mimics: The disorders of N-linked glycosylation. Semin. Pediatr. Neurol. 2005, 12, 144–151.
- Paketci, C.; Edem, P.; Hiz, S.; Sonmezler, E.; Soydemir, D.; Sarikaya Uzan, G.; Oktay, Y.; O’Heir, E.; Beltran, S.; Laurie, S.; et al. Successful treatment of intractable epilepsy with ketogenic diet therapy in twins with ALG3-CDG. Brain Dev. 2020, 42, 539–545.
- Fiumara, A.; Barone, R.; Del Campo, G.; Striano, P.; Jaeken, J. Electroclinical Features of Early-Onset Epileptic Encephalopathies in Congenital Disorders of Glycosylation (CDGs). JIMD Rep. 2016, 27, 93–99.
- Marsan, E.; Baulac, S. Review: Mechanistic target of rapamycin (mTOR) pathway, focal cortical dysplasia and epilepsy. Neuropathol. Appl. Neurobiol. 2018, 44, 6–17.
- Yin, Y.; Hua, H.; Li, M.; Liu, S.; Kong, Q.; Shao, T.; Wang, J.; Luo, Y.; Wang, Q.; Luo, T.; et al. mTORC2 promotes type I insulin-like growth factor receptor and insulin receptor activation through the tyrosine kinase activity of mTOR. Cell Res. 2016, 26, 46–65.
- Ezeonwuka, C.D.; Rastegar, M. MeCP2-Related Diseases and Animal Models. Diseases 2014, 2, 45–70.
- Lioy, D.T.; Wu, W.W.; Bissonnette, J.M. Autonomic dysfunction with mutations in the gene that encodes methyl-CpG-binding protein 2: Insights into Rett syndrome. Auton. Neurosci. 2011, 161, 55–62.
- Olson, C.O.; Pejhan, S.; Kroft, D.; Sheikholeslami, K.; Fuss, D.; Buist, M.; Ali Sher, A.; Del Bigio, M.R.; Sztainberg, Y.; Siu, V.M.; et al. MECP2 Mutation Interrupts Nucleolin-mTOR-P70S6K Signaling in Rett Syndrome Patients. Front. Genet. 2018, 9, 635.
- Tsujimura, K.; Irie, K.; Nakashima, H.; Egashira, Y.; Fukao, Y.; Fujiwara, M.; Itoh, M.; Uesaka, M.; Imamura, T.; Nakahata, Y.; et al. miR-199a Links MeCP2 with mTOR Signaling and Its Dysregulation Leads to Rett Syndrome Phenotypes. Cell Rep. 2015, 12, 1887–1901.
- Courcet, J.B.; Faivre, L.; Malzac, P.; Masurel-Paulet, A.; Lopez, E.; Callier, P.; Lambert, L.; Lemesle, M.; Thevenon, J.; Gigot, N.; et al. The DYRK1A gene is a cause of syndromic intellectual disability with severe microcephaly and epilepsy. J. Med. Genet. 2012, 49, 731–736.
- Larsen, L.J.; Moller, L.B. Crosstalk of Hedgehog and mTORC1 Pathways. Cells 2020, 9, 2316.
- Sun, J.; Liu, Y.; Moreno, S.; Baudry, M.; Bi, X. Imbalanced mechanistic target of rapamycin C1 and C2 activity in the cerebellum of Angelman syndrome mice impairs motor function. J. Neurosci. 2015, 35, 4706–4718.
- Sun, Q.; Xu, W.; Piao, J.; Su, J.; Ge, T.; Cui, R.; Yang, W.; Li, B. Transcription factors are potential therapeutic targets in epilepsy. J. Cell. Mol. Med. 2022, 26, 4875–4885.
- Sharma, N.; Jadhav, S.P.; Bapat, S.A. CREBBP re-arrangements affect protein function and lead to aberrant neuronal differentiation. Differentiation 2010, 79, 218–231.
- Henshall, D.C.; Kobow, K. Epigenetics and Epilepsy. Cold Spring Harb. Perspect. Med. 2015, 5, a022731.
- Cheong, A.; Bingham, A.J.; Li, J.; Kumar, B.; Sukumar, P.; Munsch, C.; Buckley, N.J.; Neylon, C.B.; Porter, K.E.; Beech, D.J.; et al. Downregulated REST transcription factor is a switch enabling critical potassium channel expression and cell proliferation. Mol. Cell 2005, 20, 45–52.
- He, S.; Wu, Z.; Tian, Y.; Yu, Z.; Yu, J.; Wang, X.; Li, J.; Liu, B.; Xu, Y. Structure of nucleosome-bound human BAF complex. Science 2020, 367, 875–881.
- Gavrilovici, C.; Jiang, Y.; Kiroski, I.; Teskey, G.C.; Rho, J.M.; Nguyen, M.D. Postnatal Role of the Cytoskeleton in Adult Epileptogenesis. Cereb. Cortex Commun. 2020, 1, tgaa024.
- Dery, T.; Chatron, N.; Alqahtani, A.; Pugeat, M.; Till, M.; Edery, P.; Sanlaville, D.; Schluth-Bolard, C.; Nicolino, M.; Lesca, G.; et al. Follow-up of two adult brothers with homozygous CEP57 pathogenic variants expands the phenotype of Mosaic Variegated Aneuploidy Syndrome. Eur. J. Med. Genet. 2020, 63, 104044.
- Kolbjer, S.; Martin, D.A.; Pettersson, M.; Dahlin, M.; Anderlid, B.M. Lissencephaly in an epilepsy cohort: Molecular, radiological and clinical aspects. Eur. J. Paediatr. Neurol. 2021, 30, 71–81.
- Xu, X.; Shangguan, Y.; Lu, S.; Wang, W.; Du, C.; Xiao, F.; Hu, Y.; Luo, J.; Wang, L.; He, C.; et al. Tubulin beta-III modulates seizure activity in epilepsy. J. Pathol. 2017, 242, 297–308.
- Romaniello, R.; Zucca, C.; Arrigoni, F.; Bonanni, P.; Panzeri, E.; Bassi, M.T.; Borgatti, R. Epilepsy in Tubulinopathy: Personal Series and Literature Review. Cells 2019, 8, 669.
- Takahashi, Y.; Suzuki, Y.; Kumazaki, K.; Tanabe, Y.; Akaboshi, S.; Miura, K.; Shimozawa, N.; Kondo, N.; Nishiguchi, T.; Terada, K.; et al. Epilepsy in peroxisomal diseases. Epilepsia 1997, 38, 182–188.
- Rapp, S.; Saffrich, R.; Anton, M.; Jakle, U.; Ansorge, W.; Gorgas, K.; Just, W.W. Microtubule-based peroxisome movement. J. Cell Sci. 1996, 109 Pt 4, 837–849.
More
Information
Subjects:
Biochemistry & Molecular Biology
Contributors
MDPI registered users' name will be linked to their SciProfiles pages. To register with us, please refer to https://encyclopedia.pub/register
:
View Times:
633
Revisions:
2 times
(View History)
Update Date:
17 Apr 2023
Table of Contents


Notice
You are not a member of the advisory board for this topic. If you want to update advisory board member profile, please contact office@encyclopedia.pub.
OK
Confirm
Only members of the Encyclopedia advisory board for this topic are allowed to note entries. Would you like to become an advisory board member of the Encyclopedia?
Yes
No
${ textCharacter }/${ maxCharacter }
Submit
Cancel
Back
Comments
${ item }
|
${ item.createdUser.fullName }
${ item.createdAt }
${ item.vote }
${ item.reply }
Delete
${ reply.createdUser.fullName }
${ reply.createdAt }
${ reply.vote }
Delete
There is no reply to this comment~
${ item.replyTextCharacter }/${ item.replyMaxCharacter }
Submit
Cancel
More
No more~
There is no comment~
${ textCharacter }/${ maxCharacter }
Submit
Cancel
${ selectedItem.replyTextCharacter }/${ selectedItem.replyMaxCharacter }
Submit
Cancel
Confirm
Are you sure to Delete?
Yes
No