Your browser does not fully support modern features. Please upgrade for a smoother experience.
Submitted Successfully!
 +1 credit
Thank you for your contribution! You can also upload a video entry or images related to this topic.
For video creation, please contact our Academic Video Service.
| Version | Summary | Created by | Modification | Content Size | Created at | Operation |
|---|---|---|---|---|---|---|
| 1 | Tobias Bernhard Robben | -- | 4128 | 2023-04-14 10:06:30 | | | |
| 2 | Camila Xu | Meta information modification | 4128 | 2023-04-14 10:32:25 | | |
Video Upload Options
We provide professional Academic Video Service to translate complex research into visually appealing presentations. Would you like to try it?
Cite
If you have any further questions, please contact Encyclopedia Editorial Office.
Kampker, A.; Heimes, H.; Offermanns, C.; Wennemar, S.; Robben, T.; Lackner, N. Cell Finishing Process Chain. Encyclopedia. Available online: https://encyclopedia.pub/entry/43055 (accessed on 30 July 2026).
Kampker A, Heimes H, Offermanns C, Wennemar S, Robben T, Lackner N. Cell Finishing Process Chain. Encyclopedia. Available at: https://encyclopedia.pub/entry/43055. Accessed July 30, 2026.
Kampker, Achim, Heiner Heimes, Christian Offermanns, Sarah Wennemar, Tobias Robben, Nikolaus Lackner. "Cell Finishing Process Chain" Encyclopedia, https://encyclopedia.pub/entry/43055 (accessed July 30, 2026).
Kampker, A., Heimes, H., Offermanns, C., Wennemar, S., Robben, T., & Lackner, N. (2023, April 14). Cell Finishing Process Chain. In Encyclopedia. https://encyclopedia.pub/entry/43055
Kampker, Achim, et al. "Cell Finishing Process Chain." Encyclopedia. Web. 14 April, 2023.
Copy Citation
The cell finishing process is the final stage in the production of a battery cell. Almost one third of the production costs of a battery cell are related to this part of the production. It includes a series of steps and technologies aimed at optimizing the battery cell’s performance, quality, and safety. The process is divided into three categories: pre-treatment, formation procedure, and quality testing. The order of the processes and the time required for each step can vary depending on the manufacturer and the cell format.
battery production
cell finishing
formation
electrochemical activation
SEI layer formation
production innovation
1. Introduction
The battery industry is one of the fastest-growing industries in the world. In order to achieve a cost advantage over internal combustion engine vehicles, the manufacturing costs of the battery cells are a key factor since they account for 20% to 25% of the total battery cost and offer a lever for cost reduction [1][2]. The manufacturing process for lithium-ion batteries is subdivided into three main production areas as shown in Figure 1: electrode manufacturing, cell assembly, and cell finishing. The challenges in cell finishing are the high dependency on previous production processes and the high number of possible process routes which are influenced by the material, cell format, and desired production as well as quality parameters. At the same time, cell finishing is a very time-consuming and therefore cost-intensive process step in the production of battery cells and thus an important factor in reducing production costs [3][4][5][6].
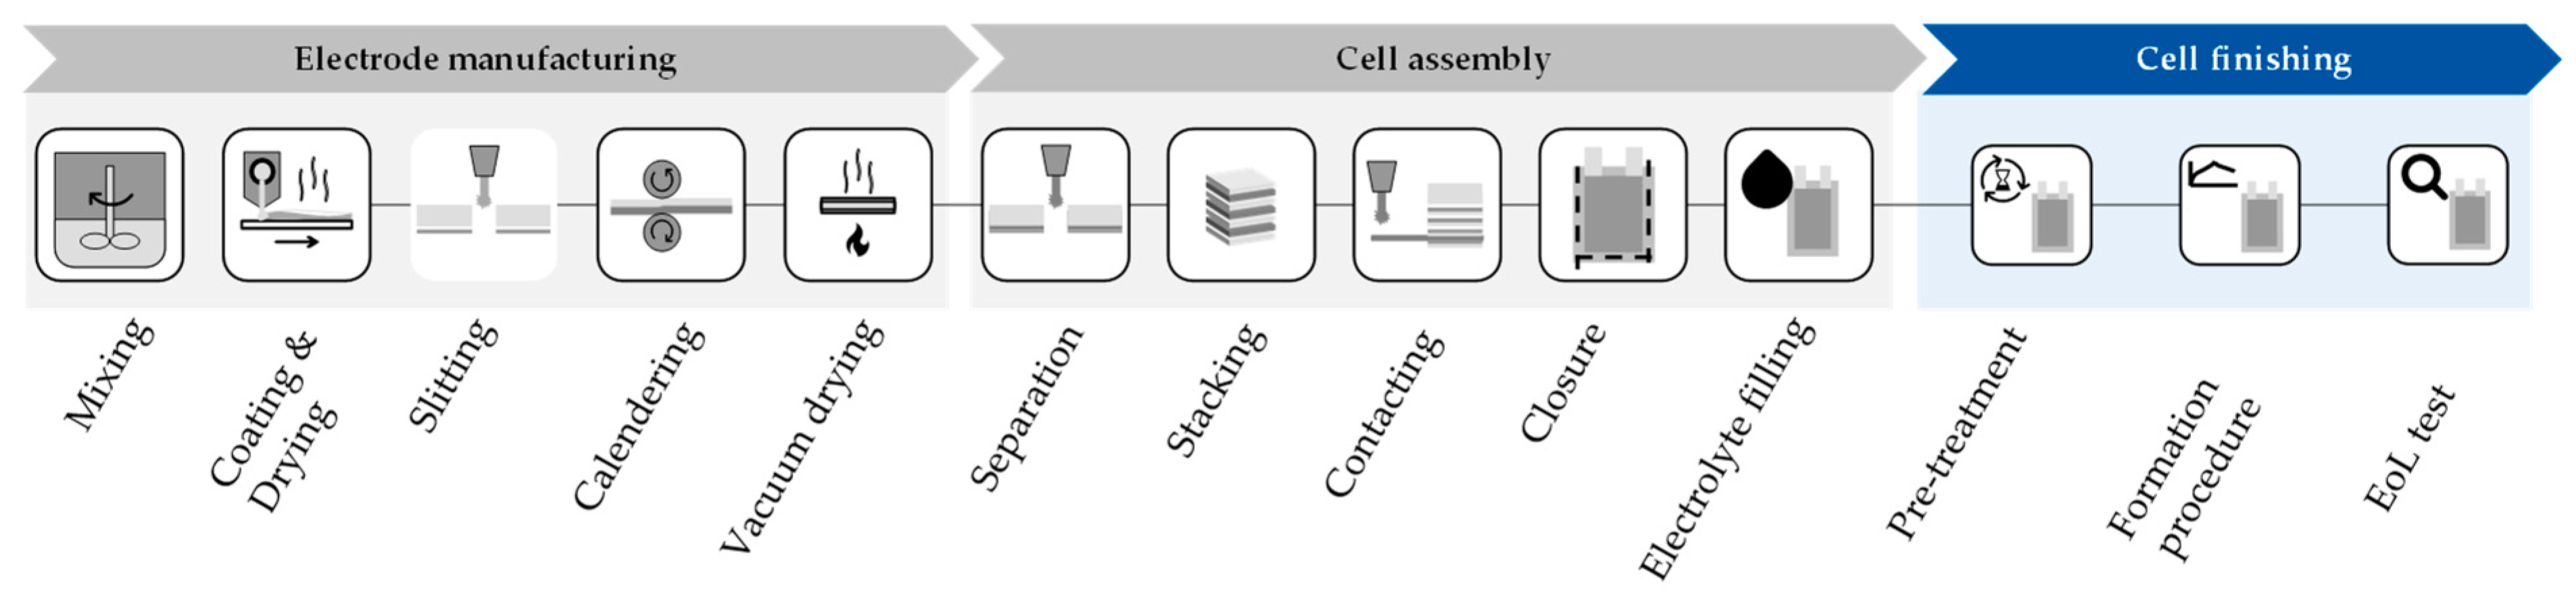
Figure 1. Overview of the production steps in battery cell production (researchers’ illustration).
2. Cell Finishing Process Chain
To explain the function and tasks of the different production steps and technologies within cell finishing, this production area is divided into the following categories as shown in Figure 2: pre-treatment, formation procedure, and quality testing. Pre-treatment focuses on the creation of optimal conditions for the formation itself. The formation procedure contains the formation cycles which describe the cell’s internal processes taking place during the first charging and discharging cycle(s) as well as auxiliary processes to either reduce process time or optimize the formation of the Solid Electrolyte Interphase (SEI) layer. Those auxiliary processes can contain high-temperature aging as well as degassing, sealing, and second filling. The last stage, quality testing, begins during room-temperature aging and closes with EoL testing and grading.
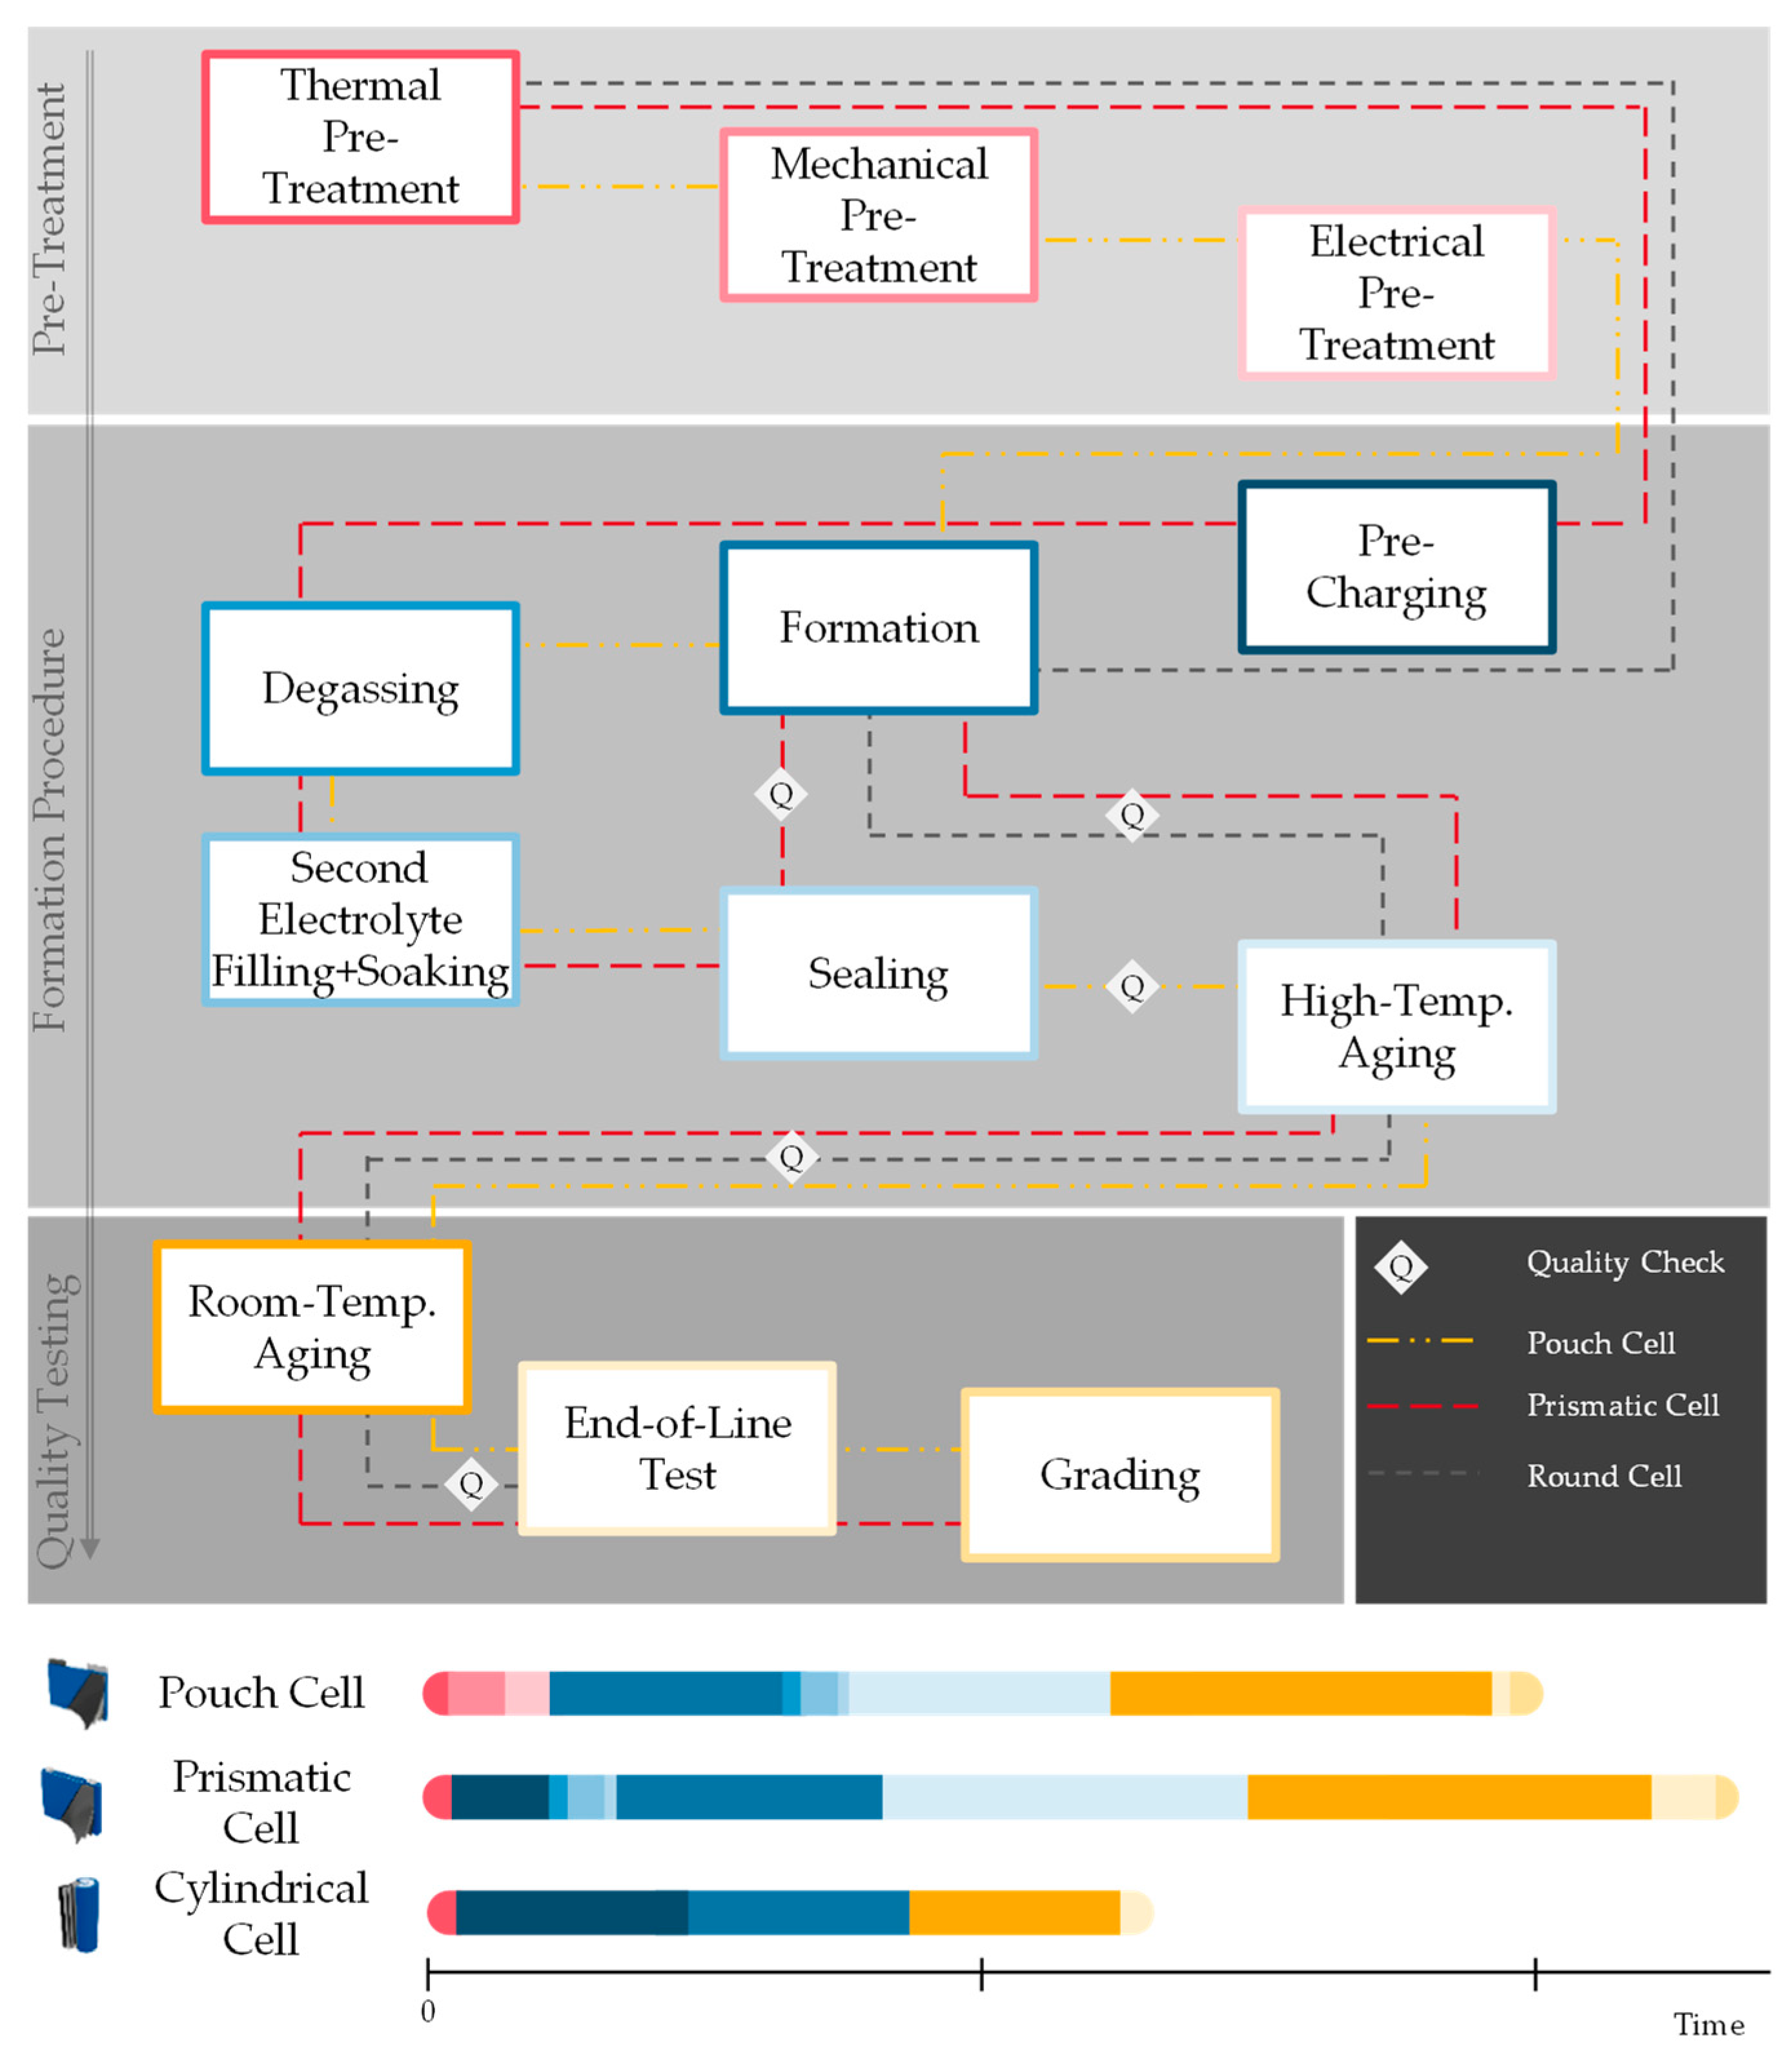
Figure 2. Introduction of possible cell finishing process routes (researchers’ illustration).
The pre-treatment can contain thermal or mechanical processes that improve or accelerate the wetting of the battery cell layers with electrolyte. Additionally, an electrical pre-treatment step (0.05 C, up to 0.8 V battery cell voltage) can be conducted that reduces copper foil corrosion and allows longer wetting times. Pre-treatment is particularly employed in the case of battery cells that are challenging for wetting such as large, densely packed battery cells, or designs that use low porosity cathodes and anodes.
Starting the formation procedure, a pre-charging step (0.05 C, up to 20% to 30% State of Charge (SOC)) can be conducted that allows the release of gas from the battery cell at an earlier process stage. This step is used for lager battery cells and materials that create a high amount of gas from side reactions such as high-nickel cathodes. The following main formation procedure triggers the development of protection layers on the surface of both electrodes. On the anode side this layer is called “Solid Electrolyte Interphase” (SEI), and its quality strongly influences the performance, quality, and safety of the battery cells. On the cathode side the layer is called “Cathode Electrolyte Interphase” (CEI). The conducted charging and discharging protocols aim to ensure stable and homogeneous electrolyte interphases [3]. To complete the formation and ensure good quality, several auxiliary processes can be added in between or after the formation cycles. Degassing is necessary to release the gas that is produced as a side reaction during formation. A second filling which adds more electrolyte can further improve the wetting degree by compensating for the loss of electrolyte during the first cycle of the formation. Sealing ensures the air-tight and liquid-tight closing of the battery cell while aging ensures the completion of the remaining chemical side reactions and wetting processes taking place after formation. During aging, the open circuit voltage is monitored to detect voltage drops over an extended time which also acts as a first quality test of the battery cell.
In the End-of-Line test, the battery cell undergoes further quality checks for relevant parameters such as capacity, internal resistance, weight, and dimension. Pulse power or EIS are potential methods for quality testing, too. Afterwards the battery cells are sorted according to the quality level reached, which is known as “grading.”
Since there is no standardized process order in cell finishing and every cell manufacturer is developing their own production protocol to fit their individual requirements and cell characteristics, different process routes are possible. Figure 2 shows different process routes for the existing prismatic, cylindrical, and pouch cell formats. The time required for each process step is displayed qualitatively in the figure as well. The process route of the cylindrical cell shown here has the shortest process time. Usually, smaller cells (cylindrical cells as well as small pouch and prismatic cells) have smaller energy content, and therefore the cell finishing process steps which are necessary for larger cells are shorter or sometimes even skipped. This results in shorter wetting times, limited pre-charging, and no second electrolyte filling or degassing. Formation and aging processes can be shortened due to the smaller energy content. Today’s prismatic and pouch cells are often much larger than cylindrical cells [7]. Therefore, the pre-treatment process takes much longer for those cells. There are different options for how to shorten the pre-treatment time which will be introduced in detail in chapter 2.1.
2.1. Pre-Treatment
After the first electrolyte filling the cells are stored in racks and the wetting process starts immediately (Figure 3) [8]. As the first step in the cell finishing process chain, it serves to create a sufficient wetting degree for conducting the formation. This is usually achieved by a homogenous distribution of the electrolyte into the electrodes and separator [9]. The penetration of the electrolyte into the pores of the electrodes and the separator establishes the performance of the ionic conductivity [10].
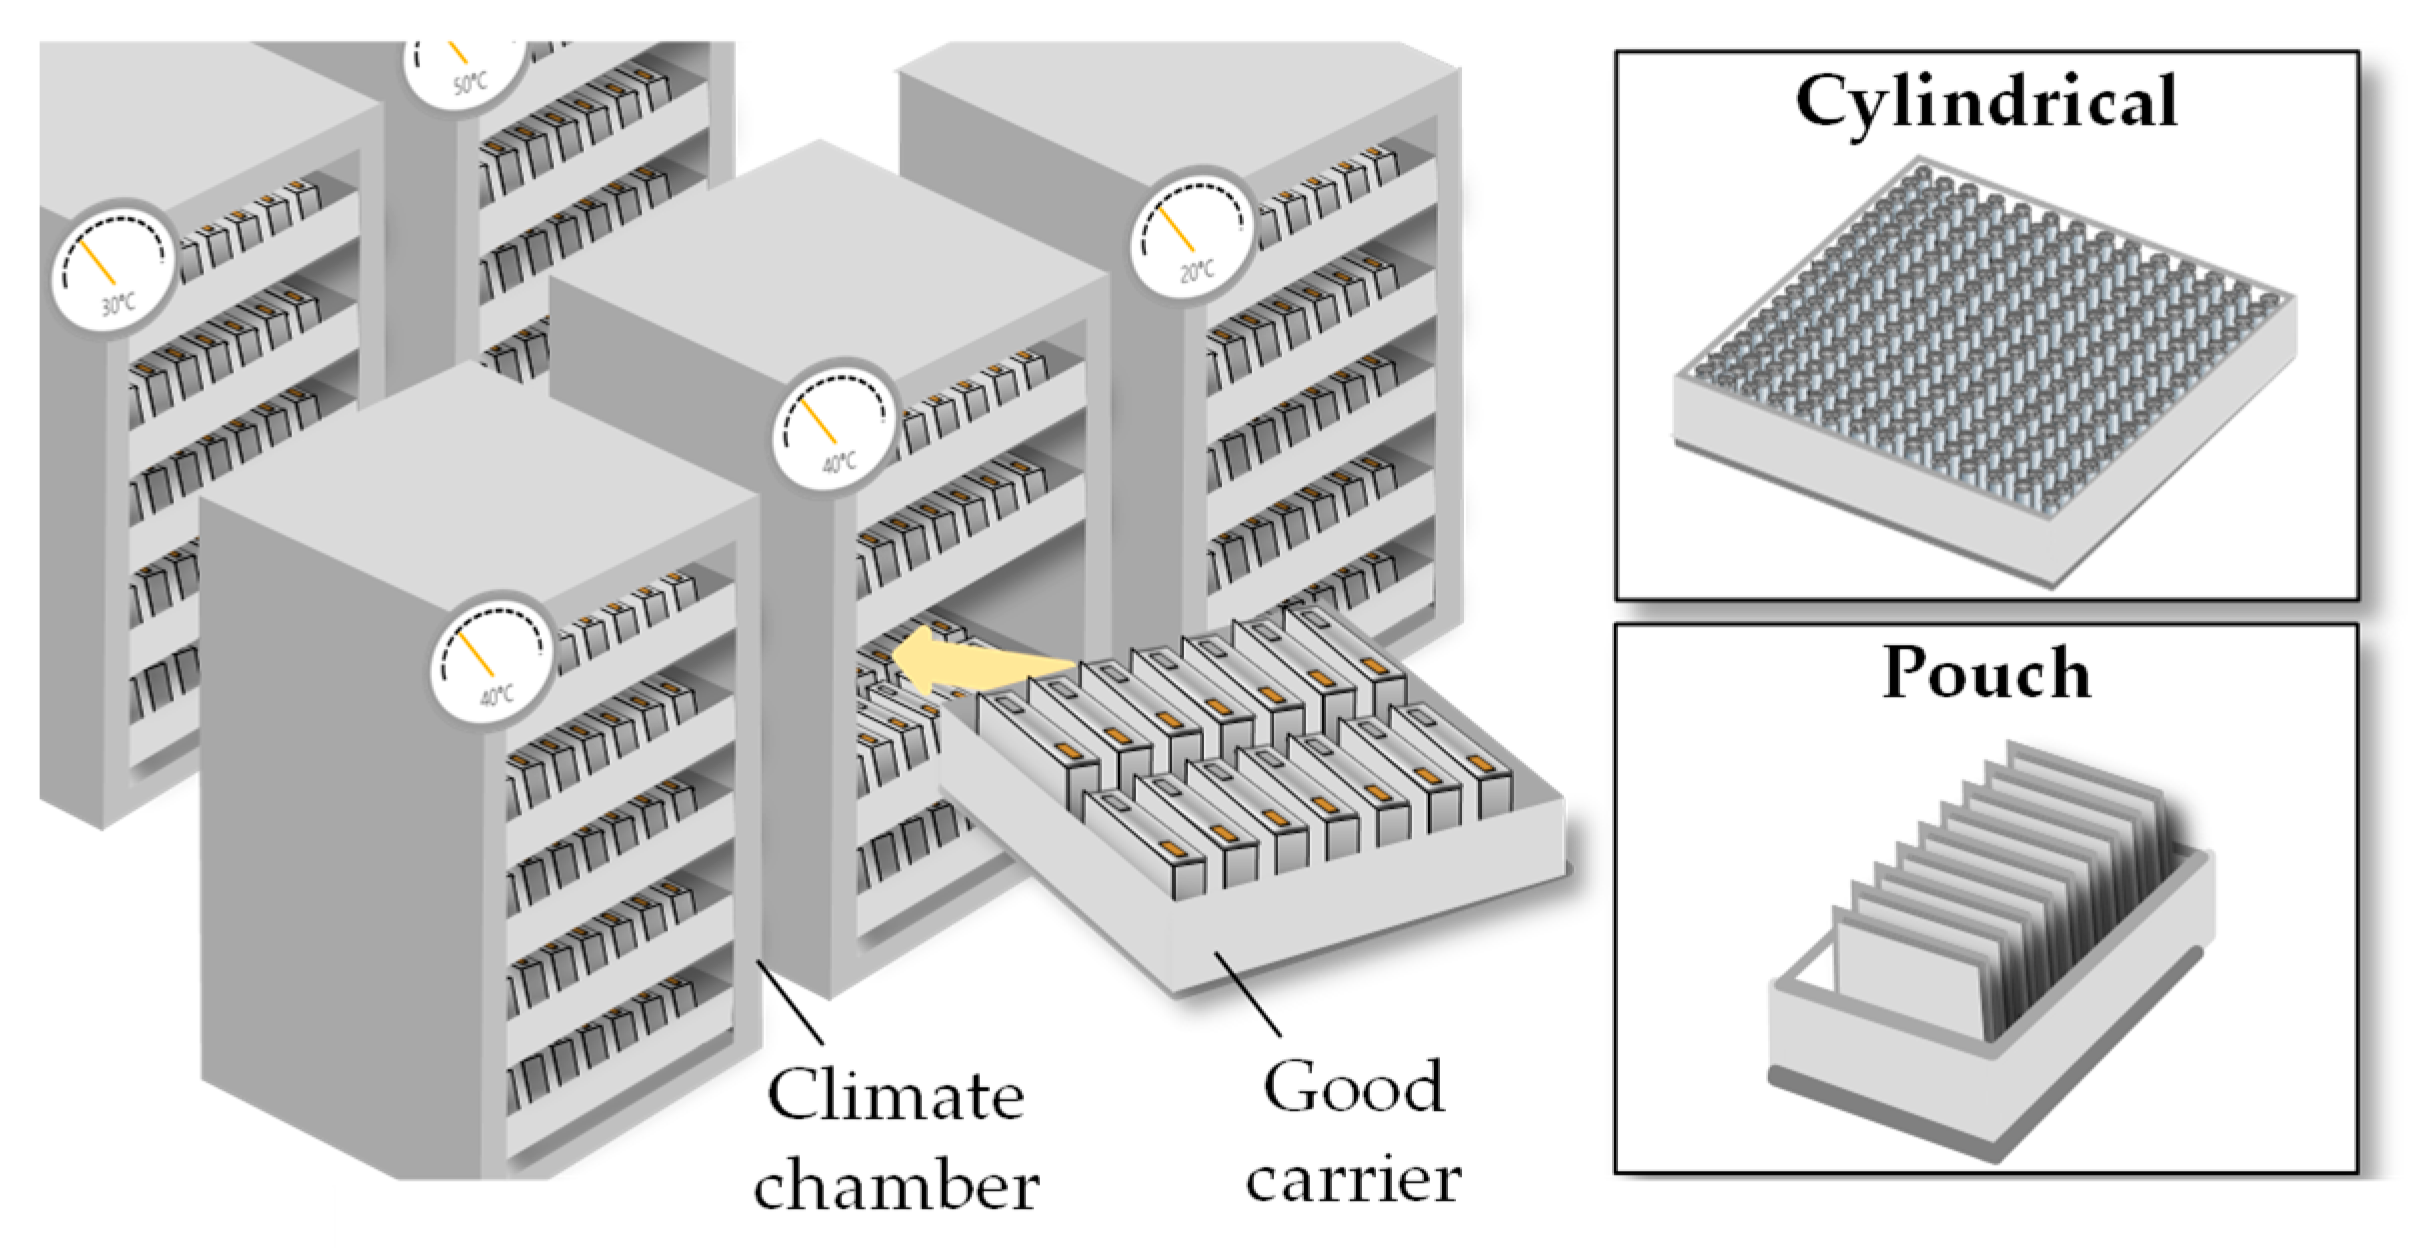
Figure 3. Schematic of the pre-treatment [8].
A homogenous distribution of electrolyte is necessary as it has a crucial influence on the ionic conductivity and therefore on the distribution of current inside the cell. Only at fully wetted areas of the electrodes can ionic conductivity, and thus a current flow, be possible. Therefore, the wetting process has a high influence on cell quality, as a poor wetting degree can cause lithium plating on the surface of the electrode [11][12]. If the electrodes are not wetted equally, the risk of lithium plating on the surface of the electrodes is very high, and thus a crucial safety risk is introduced [11].
The industrial standard is to conduct the filling process under negative pressure. Here, a vacuum down to 100 mbar is created in the lithium-ion cell so that the electrolyte can be filled into the cell quickly and efficiently [9][10]. The vacuum created is also beneficial for the wetting process since the compression forces allow the electrolyte to penetrate the electrode and separator structure more quickly. The pre-treatment process contains all processes, leading to a sufficient wetting degree for an optimal formation. The process can be subdivided into “thermal pre-treatment,” “mechanical pre-treatment,” and “electrical pre-treatment.” The order, the integration of the process steps, the process parameters, and their duration are dependent on the cell design and format.
2.1.1. Thermal Pre-Treatment
The term “thermal pre-treatment” summarizes everything that includes the storage of the lithium-ion battery cell under high-temperature conditions for a soaking step, called “high-temperature soaking.” By elevating the wetting temperature to 40 °C to 60 °C, the liquid electrolyte contact angle is reduced and the access of the electrolyte to the electrode mesopores is improved [13][14][15]. This wetting/soaking process can last between 12 and 24 h for larger cells since it is related to the electrode surface area, electrode thickness, the porosity, separator, and cell geometry [15]. The thermal pre-treatment is conducted either in larger climate chambers or climate rooms. The cells are therefore stored in rack systems [16].
2.1.2. Mechanical Pre-Treatment
Another process type to reduce the wetting time and improve wetting quality are mechanical pre-treatments. After the first wetting phase, bubbles often still remain inside the battery cell. In particular, micro-sized bubbles existing inside the battery cell do not disappear for a long time, increasing the amount of dissolved oxygen and thus adversely affecting the capacity and aging behavior of the battery. There are two major approaches for the application of mechanical forces on the cells which will be introduced in the following: roll pressing and megasonic vibration. During roll pressing, the lithium-ion pouch cell is clamped in a special carrier with the help of a gripper while pressure is applied by two rollers. This step serves as preparation for the subsequent formation because electrochemically inactive areas are avoided due to the pressurization. This process step can only be applied for pouch cells, as cylindrical and prismatic cells cannot be handled like this because of their solid housing. By applying megasonic vibration to a preliminary battery cell, not only is it possible to increase a direct physical contact between an electrode assembly and the electrolyte due to vibration, thus enhancing the wettability of electrodes and separator, but it also enables the removal of small-sized bubbles and minimizes damage to the battery cell. Therefore, the time and cost required for manufacturing the battery cell is saved, and the safety of the battery cell is improved. To apply this technique, the battery cells are stored in a tray which is connected to an excitation unit [17][18].
2.1.3. Electrical Pre-Treatment
The industry also includes pre-charging steps with small currents prior to the formation process to improve the wetting degree and to avoid copper foil corrosion. By applying small C-rates up to 0.05 C, the soaking process can be prolonged without limited copper corrosion on the electrodes. The pre-charging can also be conducted as a part of the first charging cycle up to 20% to 30% SOC. Another reason for conducting a pre-charging lies in the huge gas development of high energy battery cells, which occurs mainly in the first 20% to 30% SOC in the first charging cycle, due to the SEI formation. Between pre-charging and formation, an initial degassing and optional second electrolyte filling are performed. Pre-charging results in higher cell quality due to the lower influence of gas bubbles between the electrodes for subsequent formation sequences and allows the formation of large-format cells. The downside is that two degassing and two formation steps are required [3][19][20].
2.2. Formation Procedure
The formation procedures include all processes that serve the purpose of forming and stabilizing the SEI layer optimally. Therefore, this process includes not only the actual formation but also other auxiliary processes that either optimize the formation of the SEI in terms of quality and service life or accelerate the process. The main task of the formation procedure is the development of the passivation layers at both boundary layers of the electrodes to the electrolyte [21]. Therefore, a strong dependence between the passivation layer quality and the formation process exists. The passivation layer at the anode is called “Solid Electrolyte Interphase” (SEI) layer, while the one on the cathode is known as the “Cathode Electrolyte Interphase” (CEI) layer. Both passivation layers protect the electrodes from further decomposition [22][23]. The SEI layer has a significantly greater influence on the safety and performance of the battery cell and is therefore primarily considered in this publication [24][25]. The aim of the formation process is the optimal composition and homogeneity of the protection layer, especially on the anode side. The ideal SEI contains an inorganic layer close to the electrode and a porous organic or polymeric layer close to the electrolyte [24]. The layer should be 50 to 200 nm thin and homogeneously distributed on the surface of the anode [26]. The formation of the SEI occurs by exceeding the stable potential range of the electrolyte, as the potential of graphite exceeds the stability window of the electrolyte during the charging process [27]. As a by-product of the SEI formation reactions, gases are generated during formation. Commonly used electrolytes have reduction potentials of about 1 V, i.e., below this voltage they can be reductively decomposed (Figure 4). The first step of the formation takes place between anode potential of 0.8 V and 0.25 V vs. Li+. From 0.8 V, gas formation begins, which originates from decomposition reactions of the electrolyte solvent. One of the most dominant reactions involves the production of ethylene from electrolyte reduction, which occurs from 0.8 V until the charging cycle is completed. From 0.7 V, the surface morphology of the graphite anode changes [28][29][30]. From a voltage of U ≤0.25 V, Li+ ions are reversibly intercalated into the graphite anode. The resulting SEI layer consists of an inorganic inner layer near the electrode/SEI interface and an organic layer near the SEI/electrolyte interface. Components of the inorganic layer which allow Li+ transport are, for example, Li2CO3, LiF, and Li2O. On the other side, the organic layer is composed of products such as dilithium ethylene dicarbonate (Li2EDC) and ROLi, where R depends on the solvent. Li+ but also electrolyte solvent molecules can penetrate the organic layer [29][31][32][33][34].
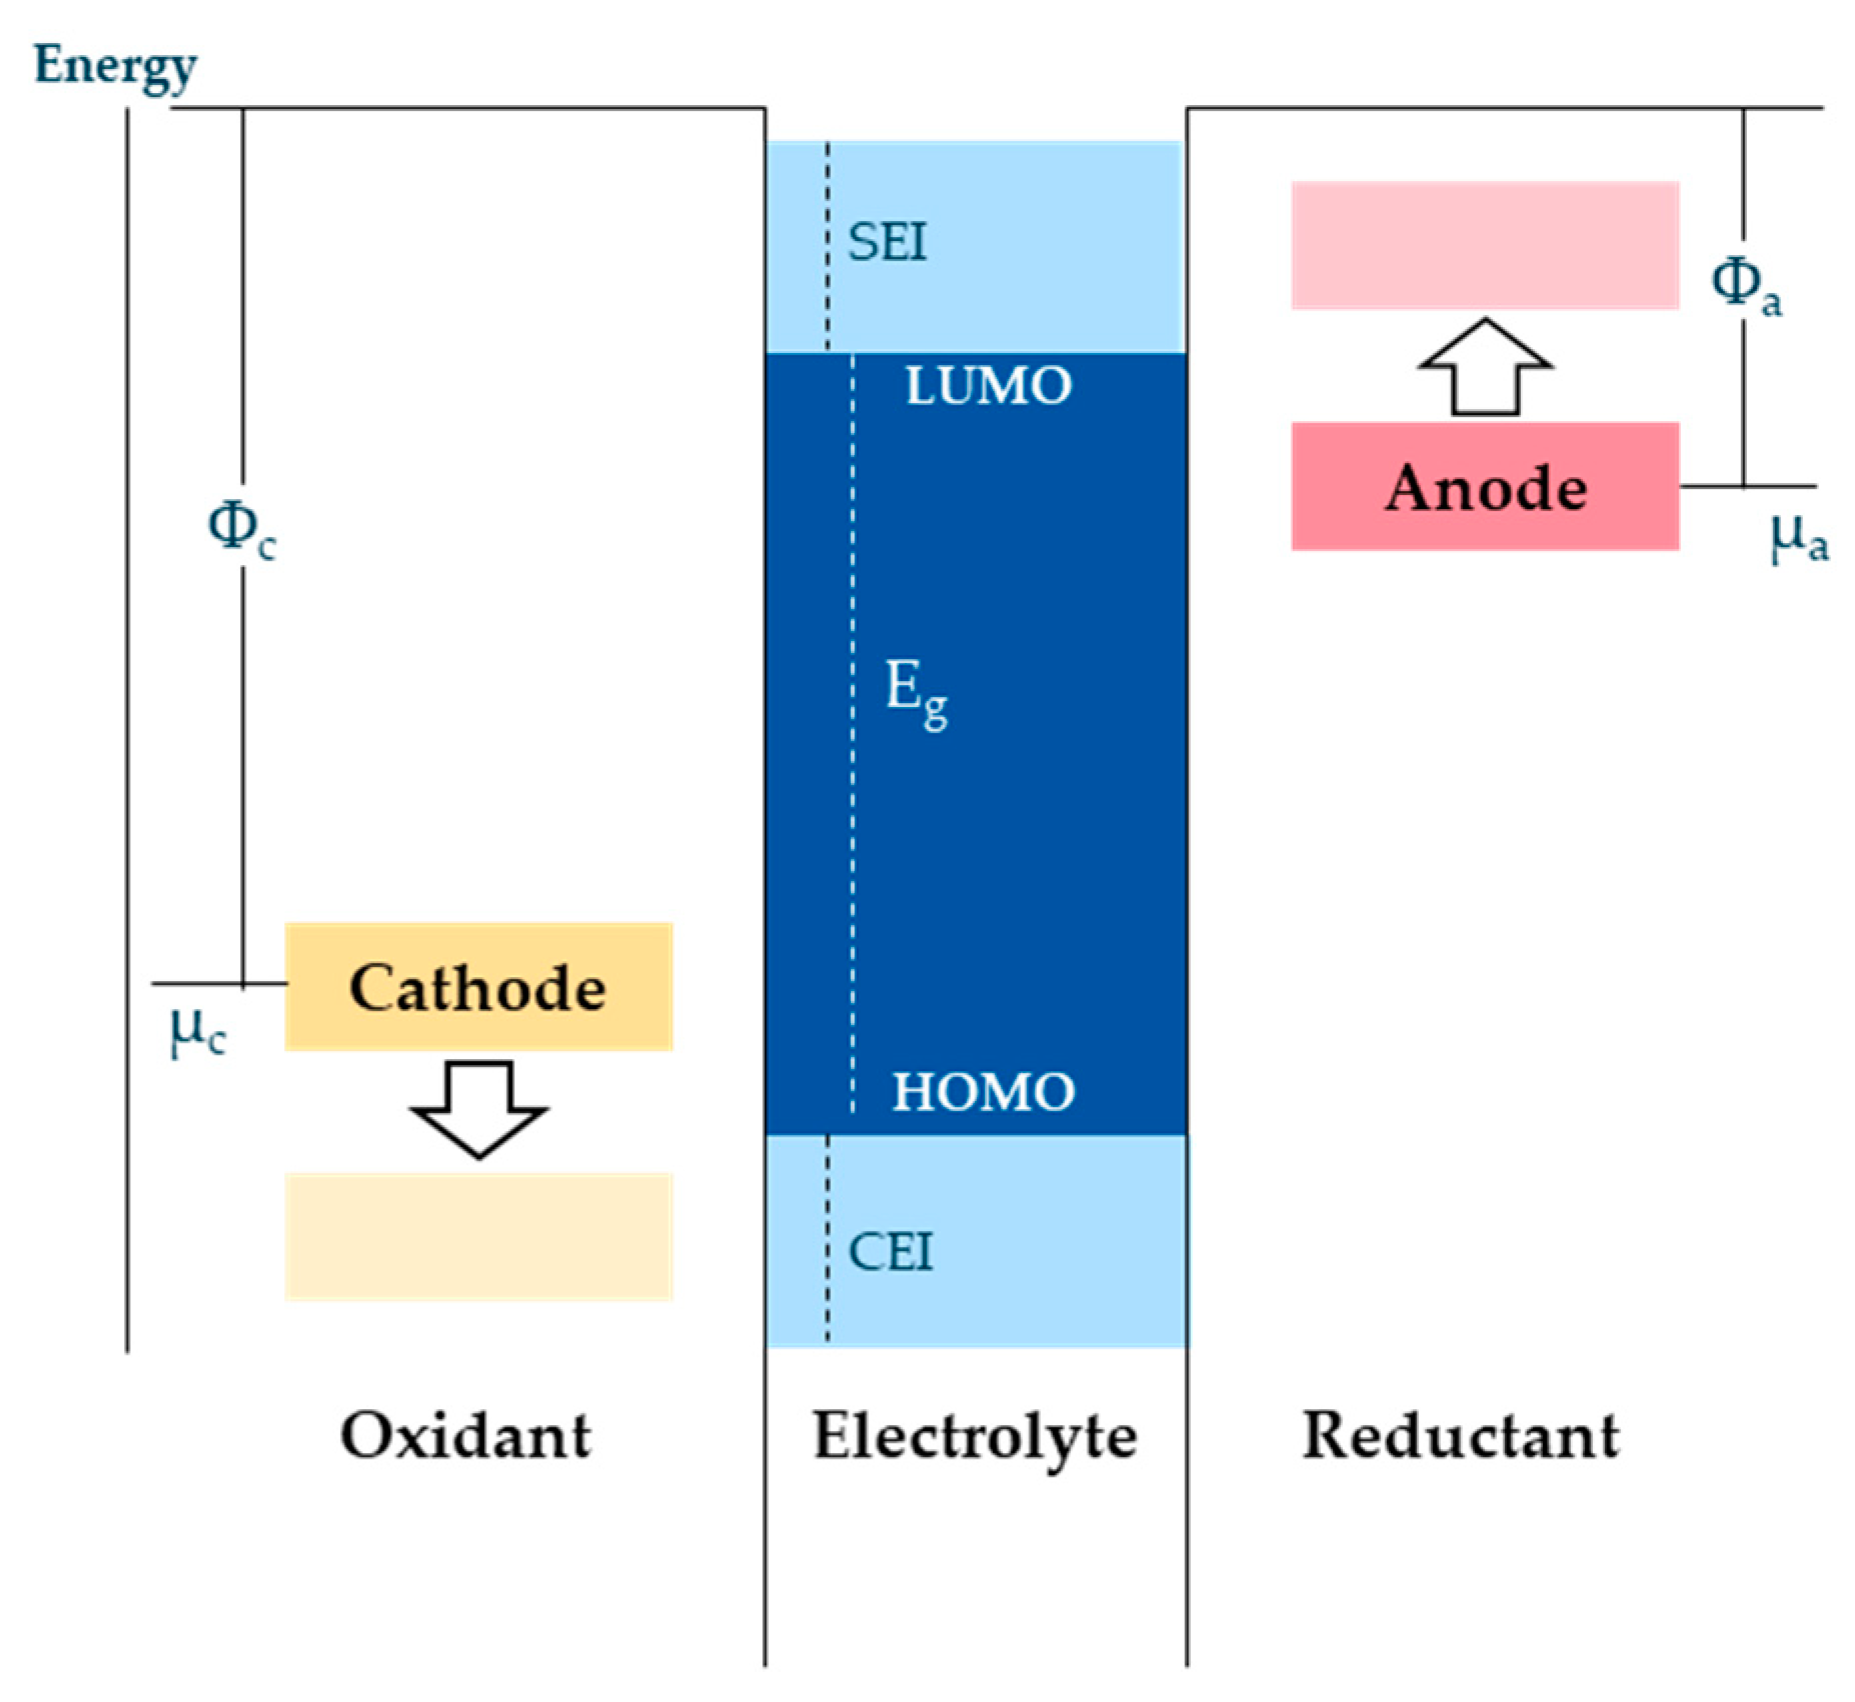
Figure 4. Description of the electrolyte homo/lumo limits (researchers illustration according to [32]).
It is possible to influence the ratio between organic and inorganic components and the amount of produced gases by changing the current density. Low current density leads to a larger proportion of organic components because more single electron reactions are carried out. This results in the formation of an excessively thick SEI layer, which leads to an increase in resistance and consequently to reduced cell performance. On the other side, high current density leads to a larger proportion of inorganic components because more electron pair reactions are favored due to a higher number of electrons reaching the anode. The result is a thinner, more uneven, and more porous (less resistant) SEI [26]. Moreover, the components of the electrolyte can influence the SEI layer. Additives like FEC, DFEC, and VC assist in forming a more stable SEI due to their fast polymerization and leading to a controlled SEI growth as well as reducing the amount of formed gases [26][34][35]. The quality of the SEI layer has a decisive influence on the cycle stability, lifetime, performance, and safety of lithium-ion cells [36][37][38] and is strongly dependent on the previous process parameters, e.g., materials, electrode manufacturing parameters, and wetting degree/amount of electrolyte, and the settings of the formation parameters, especially the C-rate [3][39][40][41][42][43]. The choice of cell finishing process order design, especially in the formation step, varies from one manufacturer to the other, e.g., in C-rate and number of cycles as well as upper and lower voltage limits [44]. Relevant process parameters in the formation are C-rate, number of cycles, temperature, and external pressure.
2.2.1. Pre-Charging and Formation
The formation process is defined as the first complete charge and discharge cycle(s) of the battery cell (Figure 5). One option to allow the SEI layer to be formed homogeneously and with a robust, rather than porous, structure is to apply a low C-rate in the first charge cycle [3][44]. The C-rate is then continuously increased with each charging and discharging cycle [3][5][44]. Another option is to integrate a pre-charging step up to 20% to 30% SOC. Due to the increased gas development of high-energy battery cells, which mainly occurs in the first 20% to 30% SOC in the first charging cycle, the SEI formation and formation time can be optimized by integrating a pre-charging step and thus a degassing and optional second electrolyte filling. Pre-charging results in higher cell quality due to less influence of gas bubbles between the electrodes for subsequent formation sequences and allows the formation of large-format cells. The downside is that two degassing and two formation steps are required. The formation procedure represents one of a cell manufacturer’s core competencies and can vary in terms of the sequences, included steps, and duration. Due to high competition between manufacturers, information about the exact formation procedure is not disclosed [45]. For smaller cells, the formation in the industry usually contains only one cycle [3][38]. Due to higher gassing and safety requirements, larger cells contain two or more complete charge and discharge cycles [12].
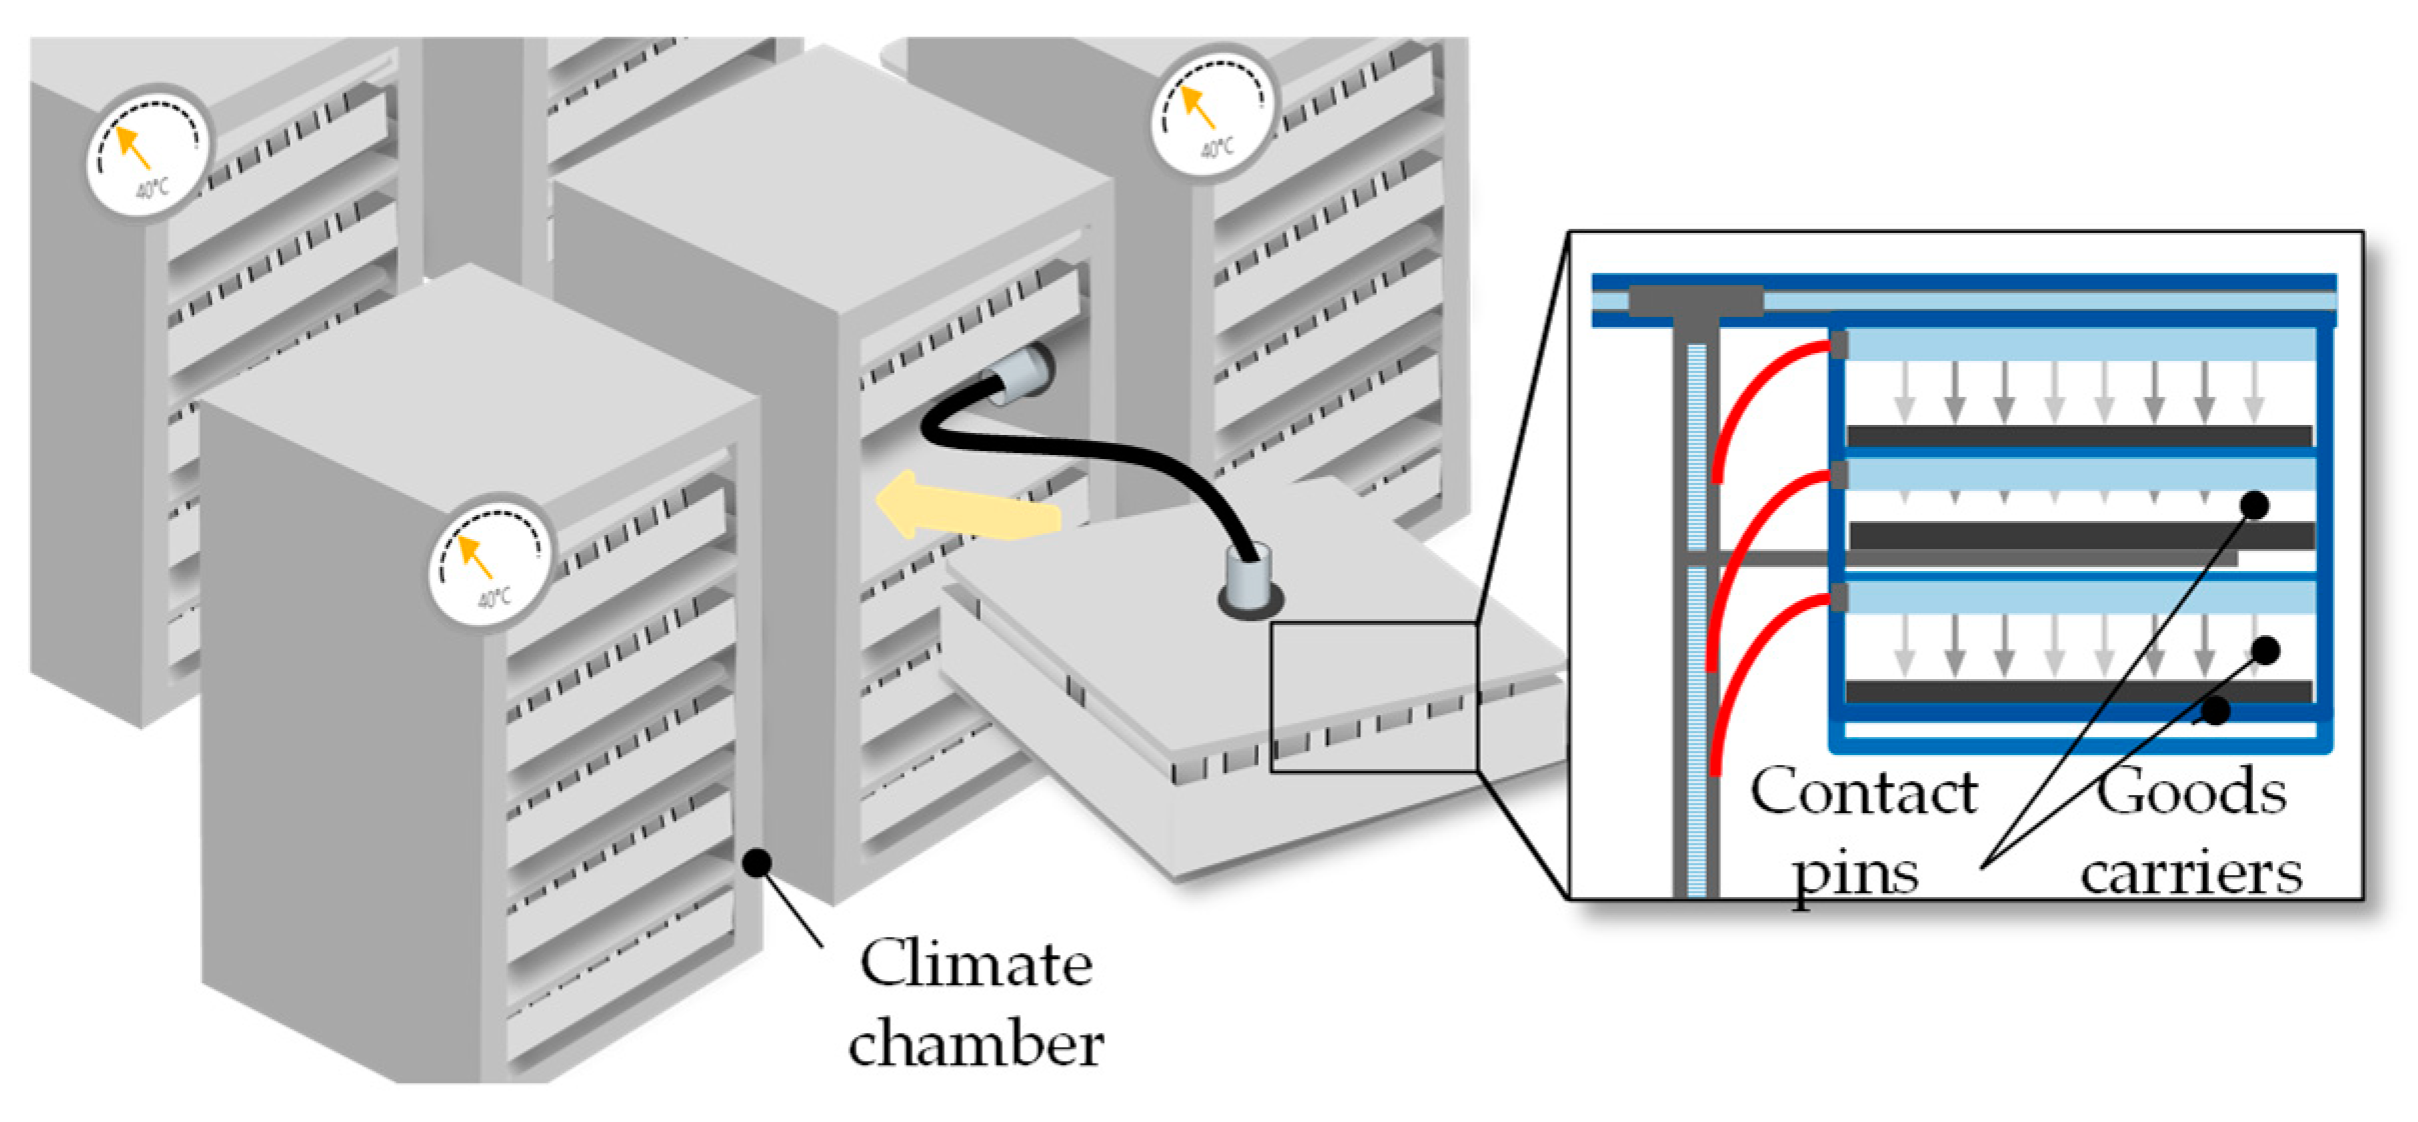
Figure 5. Schematic of pre-charging and formation [8].
Research-based formation protocols currently apply C-rates between 0.05 C and 0.5 C or even higher, depending on the purpose and research goals of the formation. Depending on the C-rate, one to five full cycles are applied during formation. The ambient temperature is set between 20 °C to 50 °C. Especially for pouch cells, mechanical pressure is usually applied during formation [15][46][47][48].
2.2.2. Degassing and Second Filling
During the formation, gases are generated by electrolyte reduction reactions with the anode and cathode. Those gases must be removed from the battery cell (Figure 6). The most commonly identified gases produced during the operation of LIBs are CO2, C2H4, H2, O2, and CO. During the first formation cycles, H2, CO, and C2H4 are the most typical gases formed. However, when the cell voltage is increased, CO2 evolution at the cathode dominates. CO2 and H2 concentrations have been found to increase at elevated temperatures under open-circuit voltage due to chemical reactions of the electrolyte with the electrode materials [49]. Nevertheless, the graphite of the anode can act as a sink for CO2, which is generated through oxidation reactions at the cathode. Therefore, the CO2 concentration is decreased in the exhaust gas during the degassing process [50].
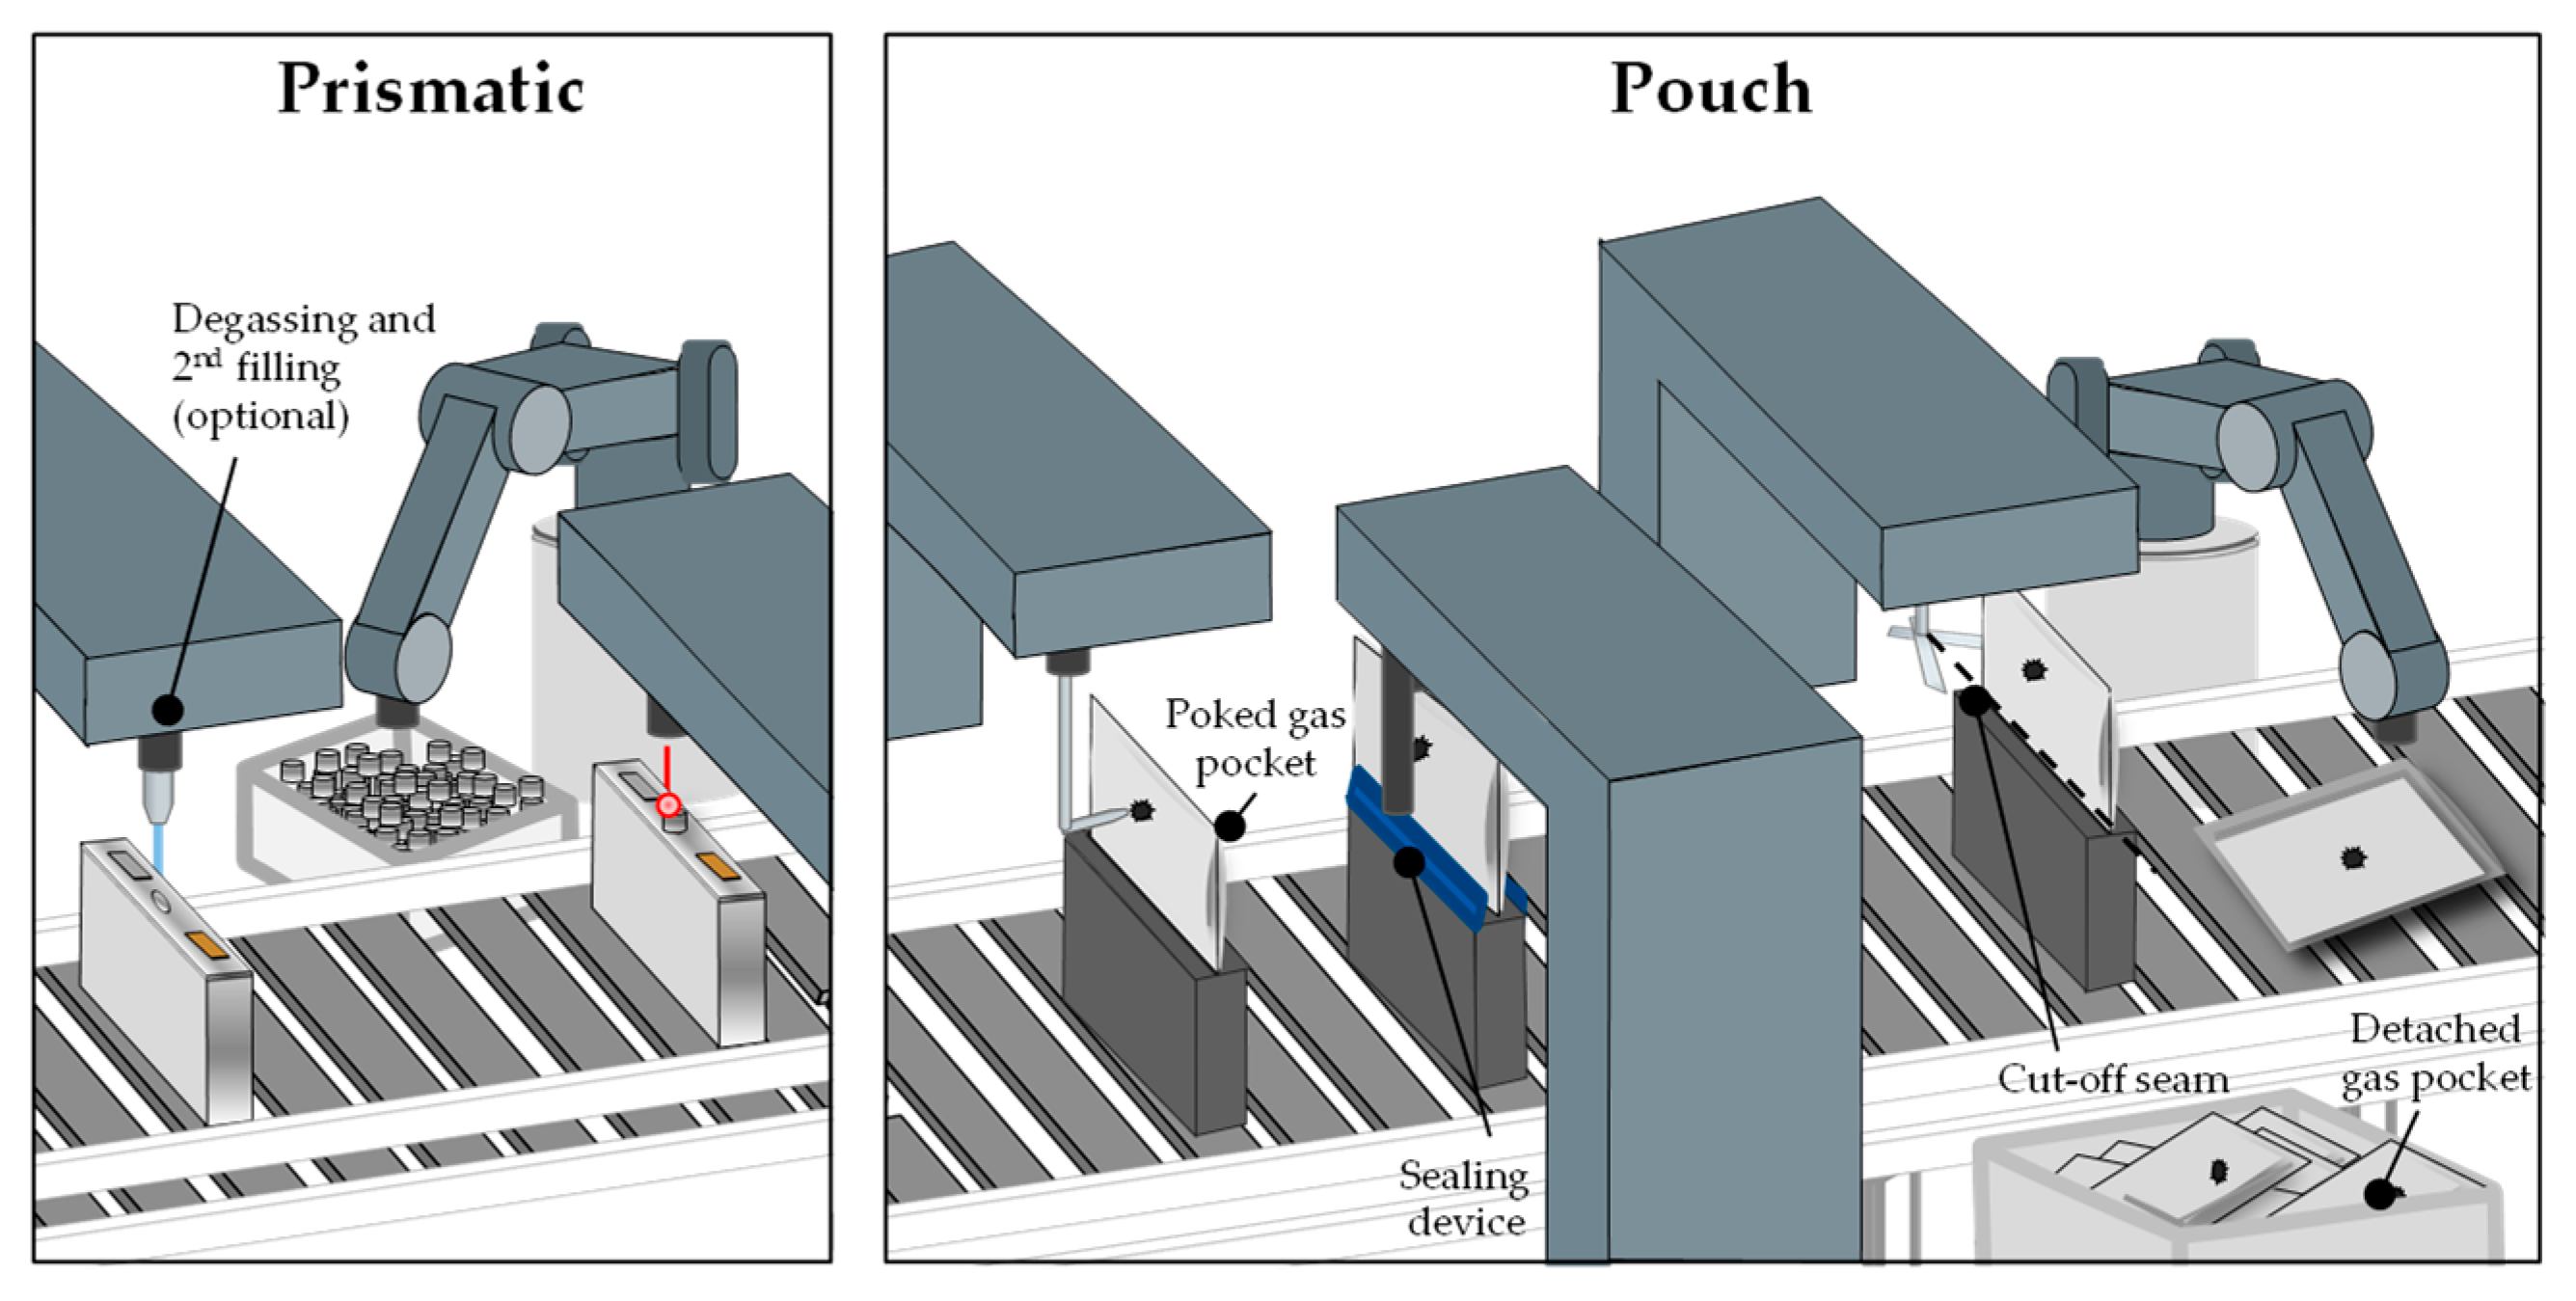
Figure 6. Schematic of the degassing and second filling [8].
The gases that have been generated during the formation must be removed in the degassing process to prevent safety issues, reduced cell life, and performance losses. Gas bubbles are deposited in the porous material in addition to the emerging gas and prevent the penetration of the electrolyte for the reactions at these places. The degassing process takes place in a vacuum chamber and varies depending on the cell type. Pouch cells have a gas pocket where the gas is accumulated. The bag is subsequently punctured and the gases are vacuumed out. While still in the vacuum chamber, a final seal is applied to the cell. The empty pocket is then separated from the cell. In the process of degassing prismatic cells, the gases are drawn out through a small hole which afterwards is filled with a permanent seal, e.g., a metallic sphere [11][51]. Due to their size and therefore the small amount of formed gas, cylindrical cells normally do not have a degassing step. This applies also to the smaller pouch and prismatic cells. For large cells, it is necessary to first perform a pre-charging with subsequent degassing, because the amount of emerging gas increases proportionally to the amount of active material while the volume of the cell hardly increases. For highly gassing materials and large prismatic cells, there could also be more than one degassing step. As the size of battery cells for all formats has increased in the last years, the degassing step will also become more important for cylindrical cells. This results in a conflict between a desired cheap and fast process and the removal of gases which needs to be done more often. From a production safety standpoint, degassing should happen at a low state of charge (SOC) because the released energy in case of a short circuit is directly connected to the SOC, which is another conflict with the economic efficiency. After the degassing for prismatic and pouch cells, a second filling step can be included to refill the electrolyte consumed during the formation [52].
2.2.3. High-Temperature Aging
The aging process can be divided into two different phases, namely high-temperature aging (HT aging) at a temperature of 30 °C to 50 °C and room-temperature aging (RT aging) with a temperature of approximately 20 °C to 25 °C. After formation, open-circuit voltage (OCV) measurements are performed to determine the self-discharge behavior of the battery cells. Unusual self-discharge rates indicate electrochemical defects and micro-shorts due to damaged separators. During the aging phase, there are also other reactions happening due to lithium-ion concentration balancing in the electrodes, final SEI stabilization reactions and final electrode wetting processes after a second filling. The described reactions can also lead to a drop in the OCV measures but are not related to any quality defects. These high-temperature phases can be integrated into the formation protocol or at the end of the formation [10][16].
2.3. Quality Testing
Quality testing processes include all processes for quality assurance and have no further influence on the battery cell quality itself. This includes room-temperature aging, End-of-Line (EoL) testing, and an optional grading of the battery cells.
2.3.1. Room-Temperature Aging
The room-temperature aging, unlike the high-temperature aging, is only performed for the purpose of quality assurance of the battery cell (Chapter 2.3.1.). Since the self-discharge rate is low for battery cells, the aging process can take up to three weeks for larger cells to be able to make valid statements about the quality. During this time the cells are stored in racks (Figure 7).
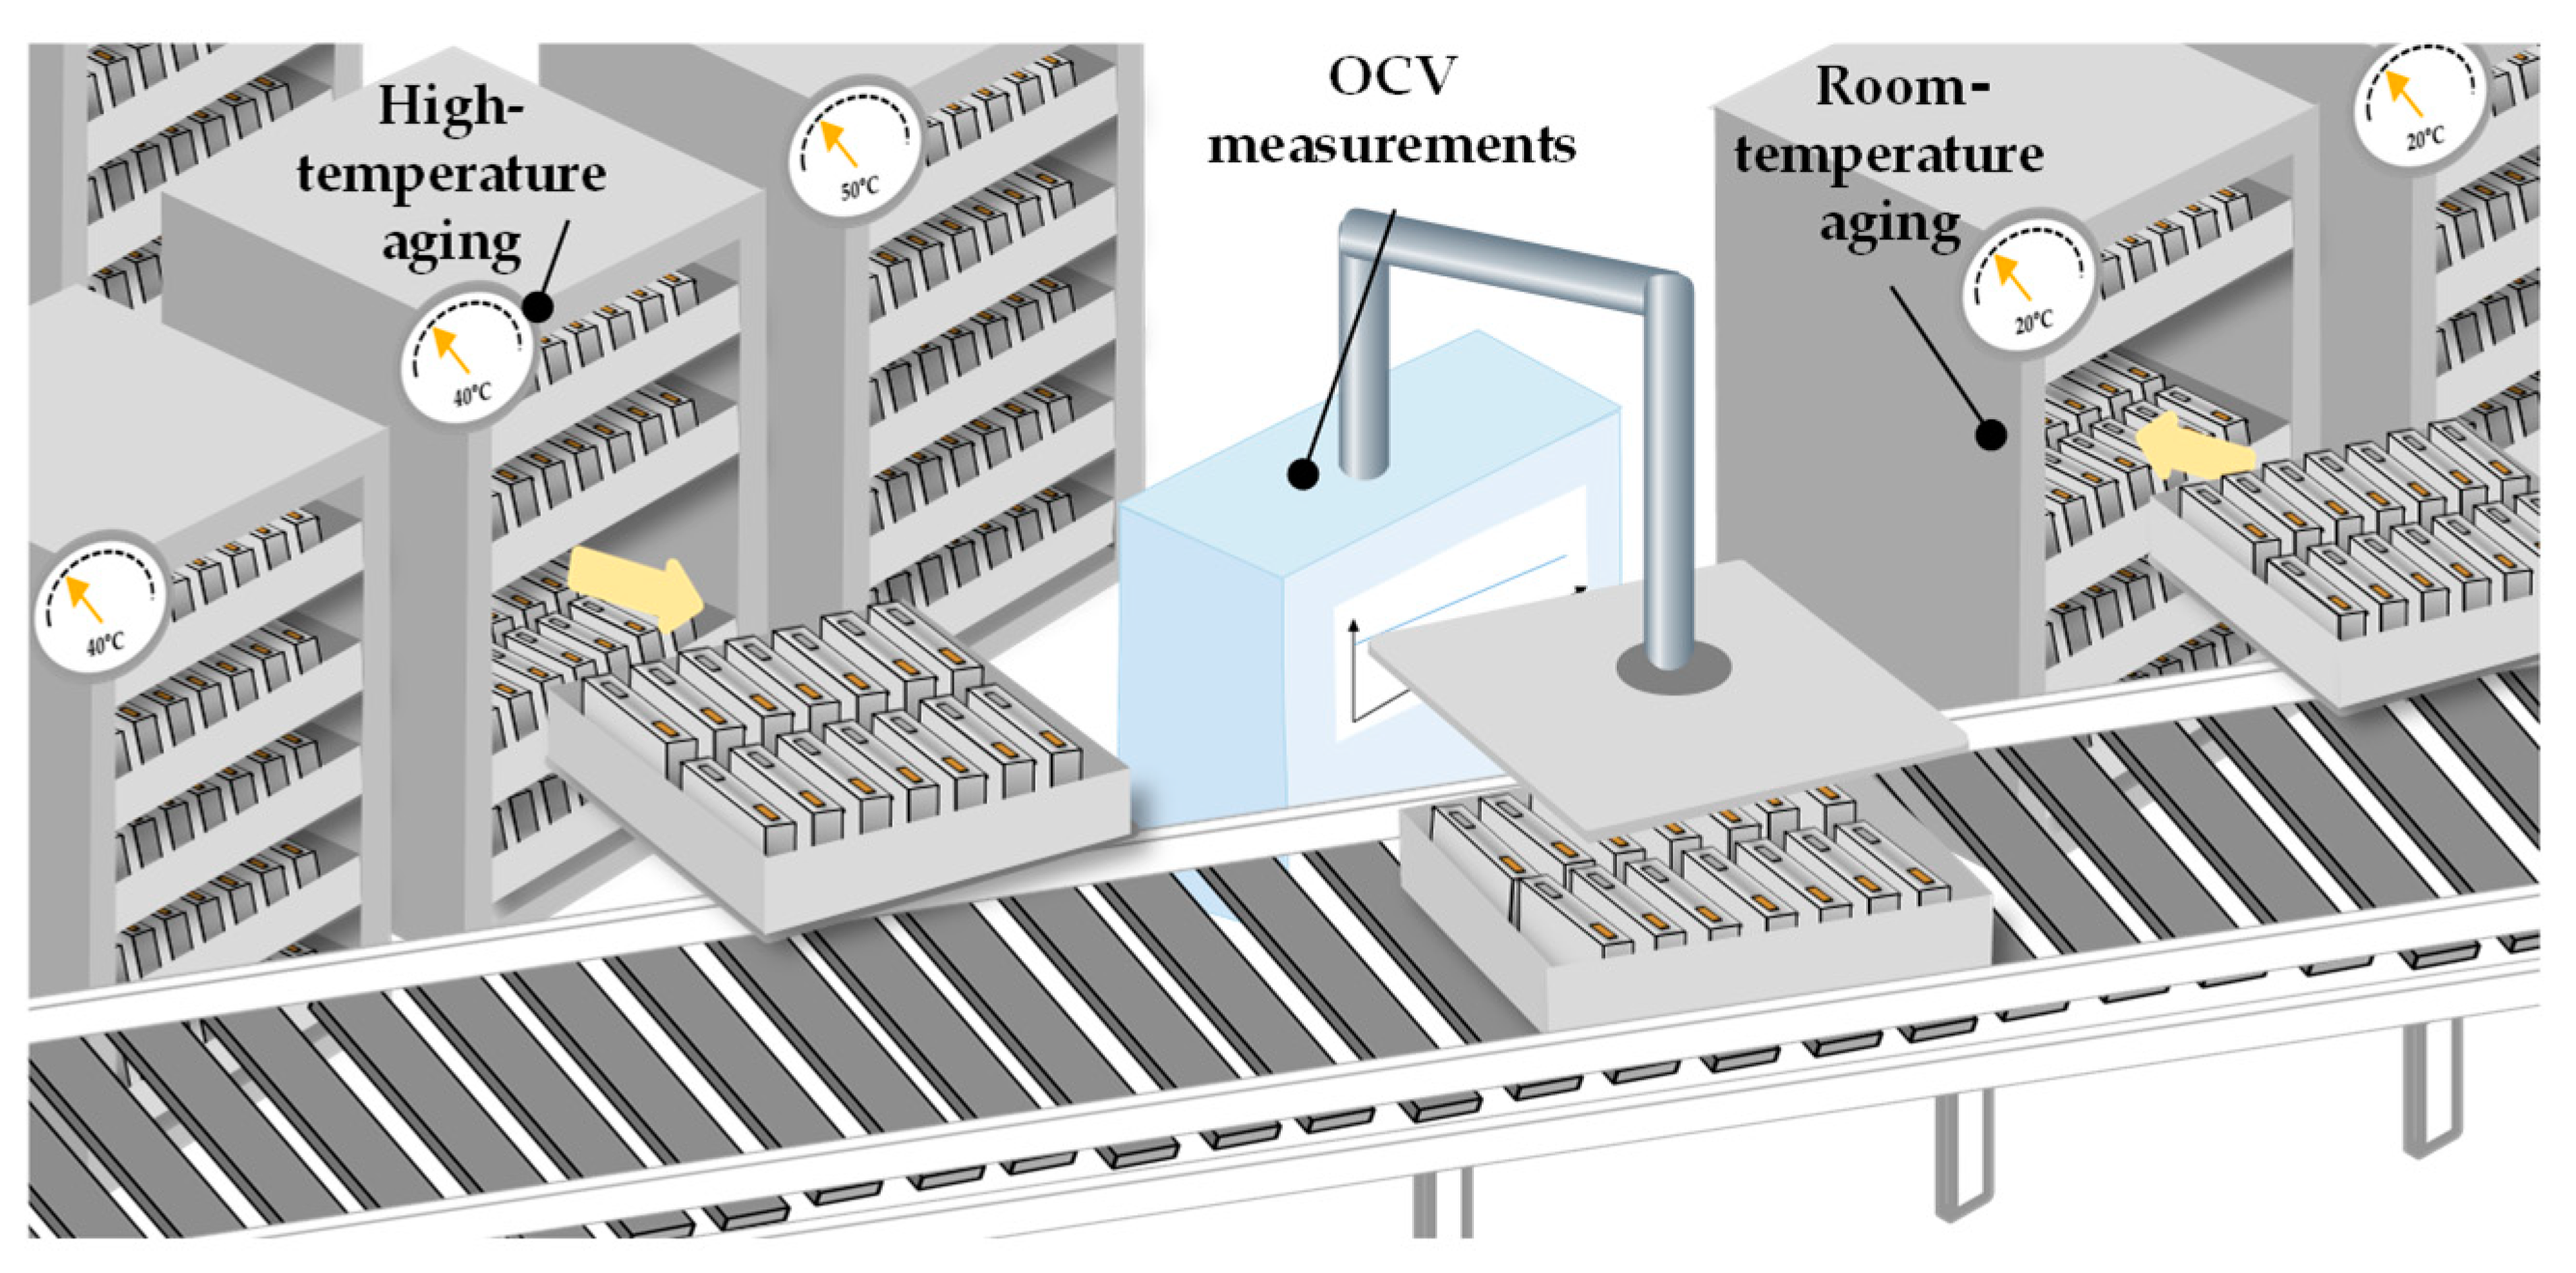
Figure 7. Schematic of high-temperature and room-temperature aging [8].
The parameter that is mainly measured is the open-circuit-voltage (OCV). Furthermore, parameters such as internal resistance and capacitance can also be measured during the aging process. By monitoring the OCV, observations can be made on the self-discharge of the cell. In this process, the voltage loss must not exceed a defined value. The measured voltage must be divided by the cell resistance to obtain the self-discharge, which also causes an inaccurate self-discharge measurement. Another measurement principle based on OCV is the K-value. The K-value is a physical quantity to describe the self-discharge rate of the cell. It is calculated by dividing the difference in OCV between two measurements by the time interval between the measurements. Thus, it can be referred to as the rate of voltage change [53].
The second reason for the time-consuming aging process is that reliable performance parameters can only be determined after a certain period of time. Battery cells are electrochemically unstable after electrolyte filling and formation. During storage, chemical reactions take place within the cells, such as the conversion of by-products and impurities, which serve for electrochemical stability and especially for SEI stabilization. These are called “self-discharge mechanisms.”
2.3.2. EoL Testing and Grading
During the EoL testing, various quality parameters are tested to ensure the function, quality, and safety of the battery cells (Figure 8). These characteristics can be divided into four categories: performance, safety, lifetime, and mechanical properties. The quality characteristics in these categories are determined by various values, e.g., capacity, voltage range, internal resistance, self-discharge, and rate capability (the ratio of the possible power output in relation to energy content of the battery cell). The mechanical properties (e.g., deformed housings or tabs) can have little influence on cell functions, but influence the usability of the battery cells and are therefore required by certain customers. Technologies, the duration of the tests, and the test sequence are not specified or standardized in the literature and are dependent on the respective manufacturers of the cells.
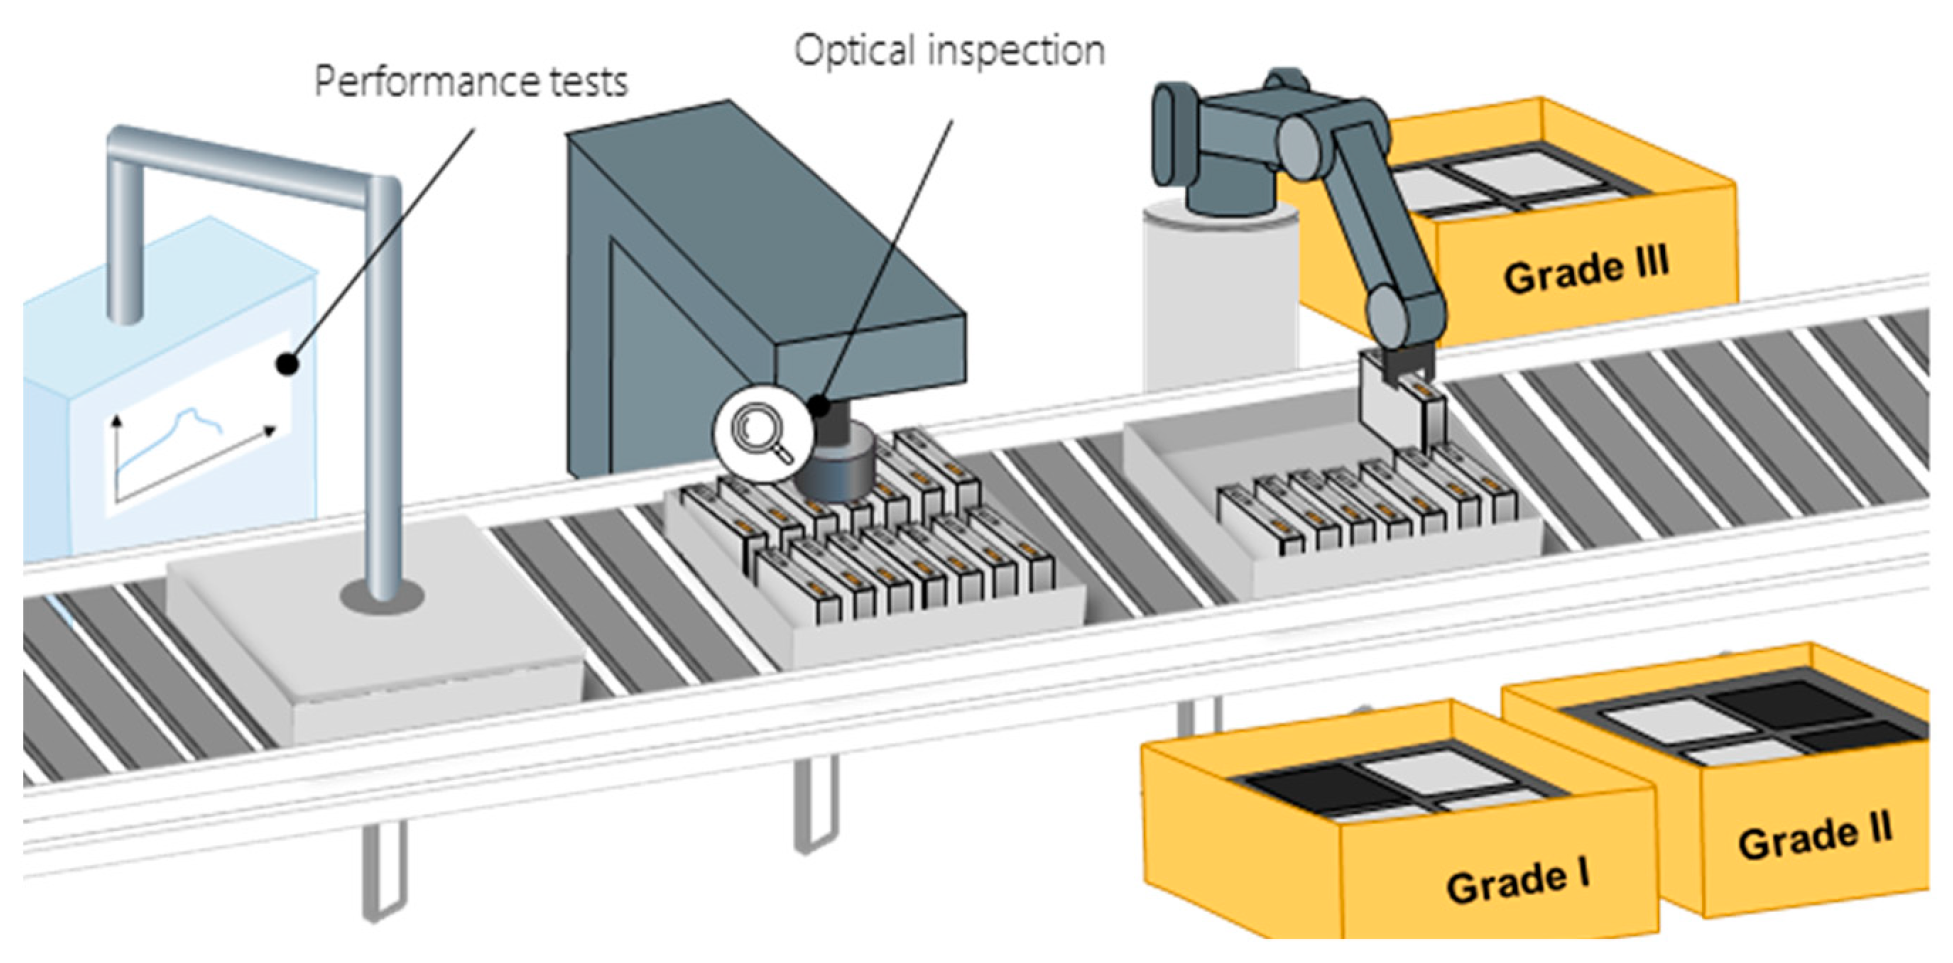
Figure 8. Schematic of EoL testing and grading [8].
The measurements that are predominantly reported in the literature are OCV, internal resistance, capacity, and pulse test. Additionally, the leak tightness is tested and an optical inspection is conducted. Some of these values can already be measured prior to EoL testing. For example, the OCV is tracked over an extended time during the aging process. During the formation process, a first indication on the capacity of the battery cell can be observed by looking at the data gathered for discharge capacity and charge efficiency (ratio of discharge capacity to charge capacity). The internal resistance is often measured between the different process steps of the formation procedure. Pulse testing is commonly used to assess battery cell characteristics by observing the voltage response of the battery cell during the pulse duration. This involves observing the dynamic response of the battery cell through loading and unloading pulses to determine its rate capability and available energy. Capacity tests are used to determine the energy capacity of the battery cell in its delivery state. Usually this can be done in a single dedicated station for electrical measurements [54][55].
The EoL testing results allow the sorting of the battery cells by quality in a downstream process called “grading” or “classification.” However, this process is optional and dependent on the manufacturer. In many cases, all battery cells that do not reach the desired quality characteristics are sorted out and not delivered to a customer but rather scrapped or recycled. If a grading process is conducted based on the data obtained during testing, cells are sorted into several classes according to their performance data. It is also common to sort and bundle cells with similar internal resistances into groups. This helps to minimize cell-to-cell variations within the battery modules and thus reduces the balancing effort [55][56].
References
- Sakti, A.; Michalek, J.J.; Fuchs, E.R.H.; Whitacre, J.F. A techno-economic analysis and optimization of Li-ion batteries for light-duty passenger vehicle electrification. J. Power Sources 2015, 273, 966–980.
- Patry, G.; Romagny, A.; Martinet, S.; Froelich, D. Cost modeling of lithium-ion battery cells for automotive applications. Energy Sci. Eng. 2015, 3, 71–82.
- An, S.J.; Li, J.; Daniel, C.; Mohanty, D.; Nagpure, S.; Wood, D.L. The state of understanding of the lithium-ion-battery graphite solid electrolyte interphase (SEI) and its relationship to formation cycling. Carbon 2016, 105, 52–76.
- Duffner, F.; Mauler, L.; Wentker, M.; Leker, J.; Winter, M. Large-scale automotive battery cell manufacturing: Analyzing strategic and operational effects on manufacturing costs. Int. J. Prod. Econ. 2021, 232, 107982.
- Kampker, A. Elektromobilproduktion; Springer: Berlin/Heidelberg, Germany, 2014; ISBN 978-3-642-42021-4.
- Baumhöfer, T.; Brühl, M.; Rothgang, S.; Sauer, D.U. Production caused variation in capacity aging trend and correlation to initial cell performance. J. Power Sources 2014, 247, 332–338.
- Löbberding, H.; Wessel, S.; Offermanns, C.; Kehrer, M.; Rother, J.; Heimes, H.; Kampker, A. From Cell to Battery System in BEVs: Analysis of System Packing Efficiency and Cell Types. World Electr. Veh. J. 2020, 11, 77.
- Heimes, H.; Kampker, A.; Wennemar, S.; Plocher, L.; Bockey, G.; Michaelis, S.; Schütrumpf, J. Production Process of a Lithium-Ion Battery Cell; RWTH Aachen University: Aachen, Germany, 2023; ISBN 978-3-947920-26-6.
- Weydanz, W.J.; Reisenweber, H.; Gottschalk, A.; Schulz, M.; Knoche, T.; Reinhart, G.; Masuch, M.; Franke, J.; Gilles, R. Visualization of electrolyte filling process and influence of vacuum during filling for hard case prismatic lithium ion cells by neutron imaging to optimize the production process. J. Power Sources 2018, 380, 126–134.
- Michaelis, S.; Rahimsei, E.; Kampker, A.; Heimes, H. Roadmap Batterie-Produktionsmittel 2030-Update 2020; VDMA: Frankfurt am Main, Germany, 2021.
- Yoshio, M. Lithium-Ion Batteries; Springer: Dordrecht, The Netherlands, 2010; ISBN 0387344446.
- Korthauer, R. Lithium-Ion Batteries: Basics and Applications; Springer: Berlin/Heidelberg, Germany, 2018; ISBN 978-3-662-53069-6.
- Davoodabadi, A.; Li, J.; Liang, Y.; Wang, R.; Zhou, H.; Wood, D.L.; Singler, T.J.; Jin, C. Characterization of Surface Free Energy of Composite Electrodes for Lithium-Ion Batteries. J. Electrochem. Soc. 2018, 165, A2493–A2501.
- Davoodabadi, A.; Li, J.; Liang, Y.; Wood, D.L.; Singler, T.J.; Jin, C. Analysis of electrolyte imbibition through lithium-ion battery electrodes. J. Power Sources 2019, 424, 193–203.
- Wood, D.L.; Li, J.; An, S.J. Formation Challenges of Lithium-Ion Battery Manufacturing. Joule 2019, 3, 2884–2888.
- Liu, Y.; Zhang, R.; Wang, J.; Wang, Y. Current and future lithium-ion battery manufacturing. iScience 2021, 24, 102332.
- Jin, D.; Kang, H.; Do, H.W.; Kim, G.; Kim, T.; Kim, S.; Choi, S.; Won, J.; Park, I.; Jung, K.; et al. Enhancing Li Ion Battery Performance by Mechanical Resonance. Nano Lett. 2021, 21, 5345–5352.
- Kang, G.; Lee, Y.T.; Kim, J.; Ko, M.H. Electrolyte Wetting Device for Manufacturing Battery Cell by Using Vibration, and Battery cell manufacturing method using same. EU Patent 3800705 A1. PCT/KR2020/003473, 12 March 2020. Available online: https://patentscope.wipo.int/search/en/detail.jsf?docId=WO2020189962 (accessed on 27 February 2023).
- Guo, L.; Thornton, D.B.; Koronfel, M.A.; Stephens, I.E.L.; Ryan, M.P. Degradation in lithium ion battery current collectors. J. Phys. Energy 2021, 3, 32015.
- Günter, F.J.; Habedank, J.B.; Schreiner, D.; Neuwirth, T.; Gilles, R.; Reinhart, G. Introduction to Electrochemical Impedance Spectroscopy as a Measurement Method for the Wetting Degree of Lithium-Ion Cells. J. Electrochem. Soc. 2018, 165, A3249–A3256.
- Winter, M. The Solid Electrolyte Interphase—The Most Important and the Least Understood Solid Electrolyte in Rechargeable Li Batteries. Z. Phys. Chem. 2009, 223, 1395–1406.
- Arora, P.; White, R.E. Capacity Fade Mechanisms and Side Reactions in Lithium-Ion Batteries. J. Electrochem. Soc. 1998, 145, 3647–3667.
- Edström, K.; Gustafsson, T.; Thomas, J. The Cathode-Electrolyte Interface in A Li-Ion Battery. In Lithium-Ion Batteries; Balbuena, P.B., Wang, Y., Eds.; Imperial College Press: London, UK, 2004; pp. 337–364. ISBN 978-1-86094-362-1.
- Liu, Y.-M.G.; Nicolau, B.; Esbenshade, J.L.; Gewirth, A.A. Characterization of the Cathode Electrolyte Interface in Lithium Ion Batteries by Desorption Electrospray Ionization Mass Spectrometry. Anal. Chem. 2016, 88, 7171–7177.
- Von Aspern, N.; Wölke, C.; Börner, M.; Winter, M.; Cekic-Laskovic, I. Impact of single vs. blended functional electrolyte additives on interphase formation and overall lithium ion battery performance. J. Solid State Electrochem. 2020, 24, 3145–3156.
- Peled, E.; Menkin, S. Review—SEI: Past, Present and Future. J. Electrochem. Soc. 2017, 164, A1703–A1719.
- Goodenough, J.B.; Kim, Y. Challenges for Rechargeable Li Batteries. Chem. Mater. 2010, 22, 587–603.
- Novák, P.; Joho, F.; Lanz, M.; Rykart, B.; Panitz, J.-C.; Alliata, D.; Kötz, R.; Haas, O. The complex electrochemistry of graphite electrodes in lithium-ion batteries. J. Power Sources 2001, 97–98, 39–46.
- Zhang, S.S.; Xu, K.; Jow, T.R. Understanding Formation of Solid Electrolyte Interface Film on LiMn2O4 Electrode. J. Electrochem. Soc. 2002, 149, A1521.
- Peljo, P.; Girault, H.H. Electrochemical potential window of battery electrolytes: The HOMO–LUMO misconception. Energy Environ. Sci. 2018, 11, 2306–2309.
- Rowden, B.; Garcia-Araez, N. A review of gas evolution in lithium ion batteries. Energy Rep. 2020, 6, 10–18.
- Metzger, M.; Strehle, B.; Solchenbach, S.; Gasteiger, H.A. Origin of H2 Evolution in LIBs: H2O Reduction vs. Electrolyte Oxidation. J. Electrochem. Soc. 2016, 163, A798–A809.
- Peled, E.; Golodnitsky, D.; Penciner, J. The Anode/Electrolyte Interface. In Handbook of Battery Materials; Besenhard, J.O., Ed.; Wiley: Hoboken, NJ, USA, 1998; pp. 419–456. ISBN 9783527294695.
- Wang, A.; Kadam, S.; Li, H.; Shi, S.; Qi, Y. Review on modeling of the anode solid electrolyte interphase (SEI) for lithium-ion batteries. npj Comput. Mater. 2018, 4, 15.
- Li, J.; Liu, H.; Xia, J.; Cameron, A.R.; Nie, M.; Botton, G.A.; Dahn, J.R. The Impact of Electrolyte Additives and Upper Cut-off Voltage on the Formation of a Rocksalt Surface Layer in LiNi0.8Mn0.1Co0.1O2 Electrodes. J. Electrochem. Soc. 2017, 164, A655–A665.
- Nzereogu, P.U.; Omah, A.D.; Ezema, F.I.; Iwuoha, E.I.; Nwanya, A.C. Anode materials for lithium-ion batteries: A review. Appl. Surf. Sci. Adv. 2022, 9, 100233.
- Kurzweil, P.; Dietlmeier, O.K. Elektrochemische Speicher; Springer Fachmedien Wiesbaden: Wiesbaden, Germany, 2018; ISBN 978-3-658-21828-7.
- He, Y.-B.; Tang, Z.-Y.; Song, Q.-S.; Xie, H.; Liu, Y.-G.; Xu, Q. Effects of Temperature on the Formation of Graphite/LiCoO2 Batteries. J. Electrochem. Soc. 2008, 155, A481.
- Günter, F.J.; Burgstaller, C.; Konwitschny, F.; Reinhart, G. Influence of the Electrolyte Quantity on Lithium-Ion Cells. J. Electrochem. Soc. 2019, 166, A1709–A1714.
- Günter, F.J.; Rössler, S.; Schulz, M.; Braunwarth, W.; Gilles, R.; Reinhart, G. Influence of the Cell Format on the Electrolyte Filling Process of Lithium-Ion Cells. Energy Technol. 2020, 8, 1801108.
- Tokranov, A.; Kumar, R.; Li, C.; Minne, S.; Xiao, X.; Sheldon, B.W. Control and Optimization of the Electrochemical and Mechanical Properties of the Solid Electrolyte Interphase on Silicon Electrodes in Lithium Ion Batteries. Adv. Energy Mater. 2016, 6, 1502302.
- Zheng, H.; Liu, G.; Song, X.; Ridgway, P.; Xun, S.; Battaglia, V.S. Cathode Performance as a Function of Inactive Material and Void Fractions. J. Electrochem. Soc. 2010, 157, A1060.
- Rago, N.D.; Basco, J.K.; Vu, A.; Li, J.; Hays, K.; Sheng, Y.; Wood, D.L.; Bloom, I. Effect of formation protocol: Cells containing Si-Graphite composite electrodes. J. Power Sources 2019, 435, 126548.
- Kampker, A.; Vallée, D.; Schnettler, A. Elektromobilität; Springer: Berlin/Heidelberg, Germany, 2013; ISBN 978-3-642-31985-3.
- Sharova, V. Enhancing the Performance of Lithium Batteries through the Development of Improved Electrolyte Formulation, Formation Protocol and Graphite Surface Modification; KIT: Karlsruhe, Germany, 2018.
- Mao, C.; An, S.J.; Meyer, H.M.; Li, J.; Wood, M.; Ruther, R.E.; Wood, D.L. Balancing formation time and electrochemical performance of high energy lithium-ion batteries. J. Power Sources 2018, 402, 107–115.
- An, S.J.; Li, J.; Du, Z.; Daniel, C.; Wood, D.L. Fast formation cycling for lithium ion batteries. J. Power Sources 2017, 342, 846–852.
- Heimes, H.H.; Offermanns, C.; Mohsseni, A.; Laufen, H.; Westerhoff, U.; Hoffmann, L.; Niehoff, P.; Kurrat, M.; Winter, M.; Kampker, A. The Effects of Mechanical and Thermal Loads during Lithium-Ion Pouch Cell Formation and Their Impacts on Process Time. Energy Technol. 2020, 8, 1900118.
- Berkes, B.B.; Schiele, A.; Sommer, H.; Brezesinski, T.; Janek, J. On the gassing behavior of lithium-ion batteries with NCM523 cathodes. J. Solid State Electrochem. 2016, 20, 2961–2967.
- Xiong, D.J.; Petibon, R.; Nie, M.; Ma, L.; Xia, J.; Dahn, J.R. Interactions between Positive and Negative Electrodes in Li-Ion Cells Operated at High Temperature and High Voltage. J. Electrochem. Soc. 2016, 163, A546–A551.
- Warner, J. Lithium-ion Battery Chemistries: A Primer; Elsevier: Amsterdam, The Netherland; Oxford, UK; Cambridge, MA, USA, 2019; ISBN 978-0-12-814778-8.
- Schreiner, D.; Zünd, T.; Günter, F.J.; Kraft, L.; Stumper, B.; Linsenmann, F.; Schüßler, M.; Wilhelm, R.; Jossen, A.; Reinhart, G.; et al. Comparative Evaluation of LMR-NCM and NCA Cathode Active Materials in Multilayer Lithium-Ion Pouch Cells: Part I. Production, Electrode Characterization, and Formation. J. Electrochem. Soc. 2021, 168, 30507.
- Farmann, A.; Sauer, D.U. A study on the dependency of the open-circuit voltage on temperature and actual aging state of lithium-ion batteries. J. Power Sources 2017, 347, 1–13.
- Wolter, M.; Fauser, G.; Bretthauer, C.; Roscher, M.A. End-of-line testing and formation process in Li-ion battery assembly lines. In Proceedings of the IEEE 9th International Multi-Conference on Systems, Signals and Devices (SSD), Chemnitz, Germany, 20–23 March 2012; IEEE: Piscataway, NJ, USA, 2012; pp. 1–3, ISBN 978-1-4673-1590-6.
- R-Smith, N.A.-Z.; Ragulskis, M.; Kasper, M.; Wagner, S.; Pumsleitner, J.; Zollo, B.; Groebmeyer, A.; Kienberger, F. Multiplexed 16 × 16 Li-Ion Cell Measurements Including Internal Resistance for Quality Inspection and Classification. IEEE Trans. Instrum. Meas. 2021, 70, 1–9.
- Hoffmann, L.; Grathwol, J.-K.; Haselrieder, W.; Leithoff, R.; Jansen, T.; Dilger, K.; Dröder, K.; Kwade, A.; Kurrat, M. Capacity Distribution of Large Lithium-Ion Battery Pouch Cells in Context with Pilot Production Processes. Energy Technol. 2020, 8, 1900196.
More
Information
Subjects:
Engineering, Manufacturing
Contributors
MDPI registered users' name will be linked to their SciProfiles pages. To register with us, please refer to https://encyclopedia.pub/register
:
View Times:
2.6K
Revisions:
2 times
(View History)
Update Date:
14 Apr 2023
Table of Contents


Notice
You are not a member of the advisory board for this topic. If you want to update advisory board member profile, please contact office@encyclopedia.pub.
OK
Confirm
Only members of the Encyclopedia advisory board for this topic are allowed to note entries. Would you like to become an advisory board member of the Encyclopedia?
Yes
No
${ textCharacter }/${ maxCharacter }
Submit
Cancel
Back
Comments
${ item }
|
${ item.createdUser.fullName }
${ item.createdAt }
${ item.vote }
${ item.reply }
Delete
${ reply.createdUser.fullName }
${ reply.createdAt }
${ reply.vote }
Delete
There is no reply to this comment~
${ item.replyTextCharacter }/${ item.replyMaxCharacter }
Submit
Cancel
More
No more~
There is no comment~
${ textCharacter }/${ maxCharacter }
Submit
Cancel
${ selectedItem.replyTextCharacter }/${ selectedItem.replyMaxCharacter }
Submit
Cancel
Confirm
Are you sure to Delete?
Yes
No