Your browser does not fully support modern features. Please upgrade for a smoother experience.
Submitted Successfully!
 +1 credit
Thank you for your contribution! You can also upload a video entry or images related to this topic.
For video creation, please contact our Academic Video Service.
| Version | Summary | Created by | Modification | Content Size | Created at | Operation |
|---|---|---|---|---|---|---|
| 1 | Nina Boorsma | -- | 1483 | 2023-02-24 10:26:54 | | | |
| 2 | Rita Xu | -6 word(s) | 1477 | 2023-02-24 10:48:14 | | |
Video Upload Options
We provide professional Academic Video Service to translate complex research into visually appealing presentations. Would you like to try it?
Cite
If you have any further questions, please contact Encyclopedia Editorial Office.
Boorsma, N.; Polat, E.; Bakker, C.; Peck, D.; Balkenende, R. Circular Product Readiness Method. Encyclopedia. Available online: https://encyclopedia.pub/entry/41629 (accessed on 24 July 2026).
Boorsma N, Polat E, Bakker C, Peck D, Balkenende R. Circular Product Readiness Method. Encyclopedia. Available at: https://encyclopedia.pub/entry/41629. Accessed July 24, 2026.
Boorsma, Nina, Esra Polat, Conny Bakker, David Peck, Ruud Balkenende. "Circular Product Readiness Method" Encyclopedia, https://encyclopedia.pub/entry/41629 (accessed July 24, 2026).
Boorsma, N., Polat, E., Bakker, C., Peck, D., & Balkenende, R. (2023, February 24). Circular Product Readiness Method. In Encyclopedia. https://encyclopedia.pub/entry/41629
Boorsma, Nina, et al. "Circular Product Readiness Method." Encyclopedia. Web. 24 February, 2023.
Copy Citation
Design indicators can be used by companies to track circular design implementation, which can yield insights into their performance and opportunities for improvement. Existing indicator methods either lack depth with regard to circular design, are incomplete, or do not use design semantics.
sustainable manufacturing
sustainable design
design roadmap
Circular Product Design
Design for Remanufacturing
Remanufacturing
Circular Economy
Design indicators
Design method
implementation
1. Introduction
In the drive towards greater circularity, companies can use design indicators to track their circular design readiness and implementation [1][2]. The literature on circularity indicator methods is diverse, with methods ranging from industry-level meso-approaches to product-level micro-approaches [2][3]. Product-level indicators tend to focus on resource circularity, commonly using material flow analysis models to derive indicators [2][3][4]. Specific product-related indicators have been collected, categorized, and reviewed in several academic studies that, for example, assess product performance in circular settings and the circularity of a product’s materials [5][6]. Other studies assess the performance of specific design aspects, usually expressed in quantitative units, such as longevity (expressed in time), recycling rate (expressed in percentage), or a re-manufacturability score (expressed as an aggregate of multiple variables) [7][8][9]. In a review of product-focused indicators, Linder et al. [6] concluded that the Material Circularity Indicator scheme by the Ellen MacArthur Foundation contains the most ambitious set of indicators [10]. This tool measures the effectiveness of a company’s transition based on material flows.
Despite the value of this approach and given that different sets of existing indicators contain information valuable for designers, none of these sets were specifically developed with the aim of guiding designers in their activities. The goal of this research was to develop a method to help designers to monitor the implementation level when designing a circular product or service. Researchers assessed the efficacy of the newly developed method regarding its power to support strength–weakness analyses and design road mapping activities. The findings can also be used to disseminate results to disciplines outside the field of design.
Design is an important factor in the transition from a linear to a circular economy. The way products are designed determines if and under what conditions products can be recovered. For example, design determines whether a product can be taken apart and put together again, maintained, repaired, or remanufactured. All desired events and behaviors a product experiences throughout its entire life cycle, from strategy to recovery, can be facilitated through design [11]. Having industry design professionals adopt circular product design contributes to achieving the economy’s potential to become circular. To design durable, reparable, and re-manufacturable products is a prominent part of the vision for circular product design, complemented by aspects such as having high-quality end-of-life recycling options.
The primary aim of circular product design is to maintain the largest part of a product’s value for as long as possible [12][13]. Yet, its fundamental differences with linear design make circular design hard to implement [14]. Designers have to choose between selling product functionality or performance as a core value rather than ownership, or whether they rate customer satisfaction higher than consumerism, and whether they think in terms of end-of-use products with potentially unlimited lifespans [15]. Circular products are designed for multiple use-cycles, and innovative multi-disciplinary solutions are needed to support this goal [16]. To achieve shifts such as these, strategic design can contribute to embedding circular design in existing processes [17].
2. Development of the Circular Product Readiness Method
Researchers present the process that led to the final design of the method, corresponding to step 3 of the Design Science Research approach. The first activity was the development of the basic structure of the Circular Product Readiness method. This determined which design topics were to be addressed and how the design topics break down into indicators. This enabled researchers to develop the questions to be asked to assess the readiness level.
2.1. Development of Themes and Indicators
The final set of themes and indicators was obtained through 20 rounds of design iterations, the knowledge coproduction sessions, and the literature review. The first draft was created prior to the literature review and adjusted according to insights from the review. The final set of indicators was derived based on the knowledge coproduction sessions.
The circular indicator methods selected in the background section were analyzed in more detail for their use of design themes and indicators to learn which characteristics met the method criteria and were to be considered when developing the structure of the Circular Product Readiness method. The following characteristics (partially) met the method criteria. The Circulytics method takes a broad lifecycle focus by including strategic and human-centered design. This is important for linking design to the company strategy and optimizing a product for its context. MATChE also takes a broader focus, by considering the take-back services needed to ensure return rates. CEIP takes a designer-intuitive lifecycle perspective with a strong orientation on design aspects. The categorization of indicators benefits by adopting a practice-oriented structure over a theory-oriented structure like that of the C-Indicator Advisor. As a result of this analysis, the themes could be determined and a more advanced set of indicators was developed.
To further optimize the set of indicators, the circular design experts were asked to evaluate the preliminary selection of indicators in the knowledge coproduction sessions. This helped to determine the priority indicators and reach a set that covered all the essential circular design aspects. The final set of themes and indicators are presented in Figure 1.
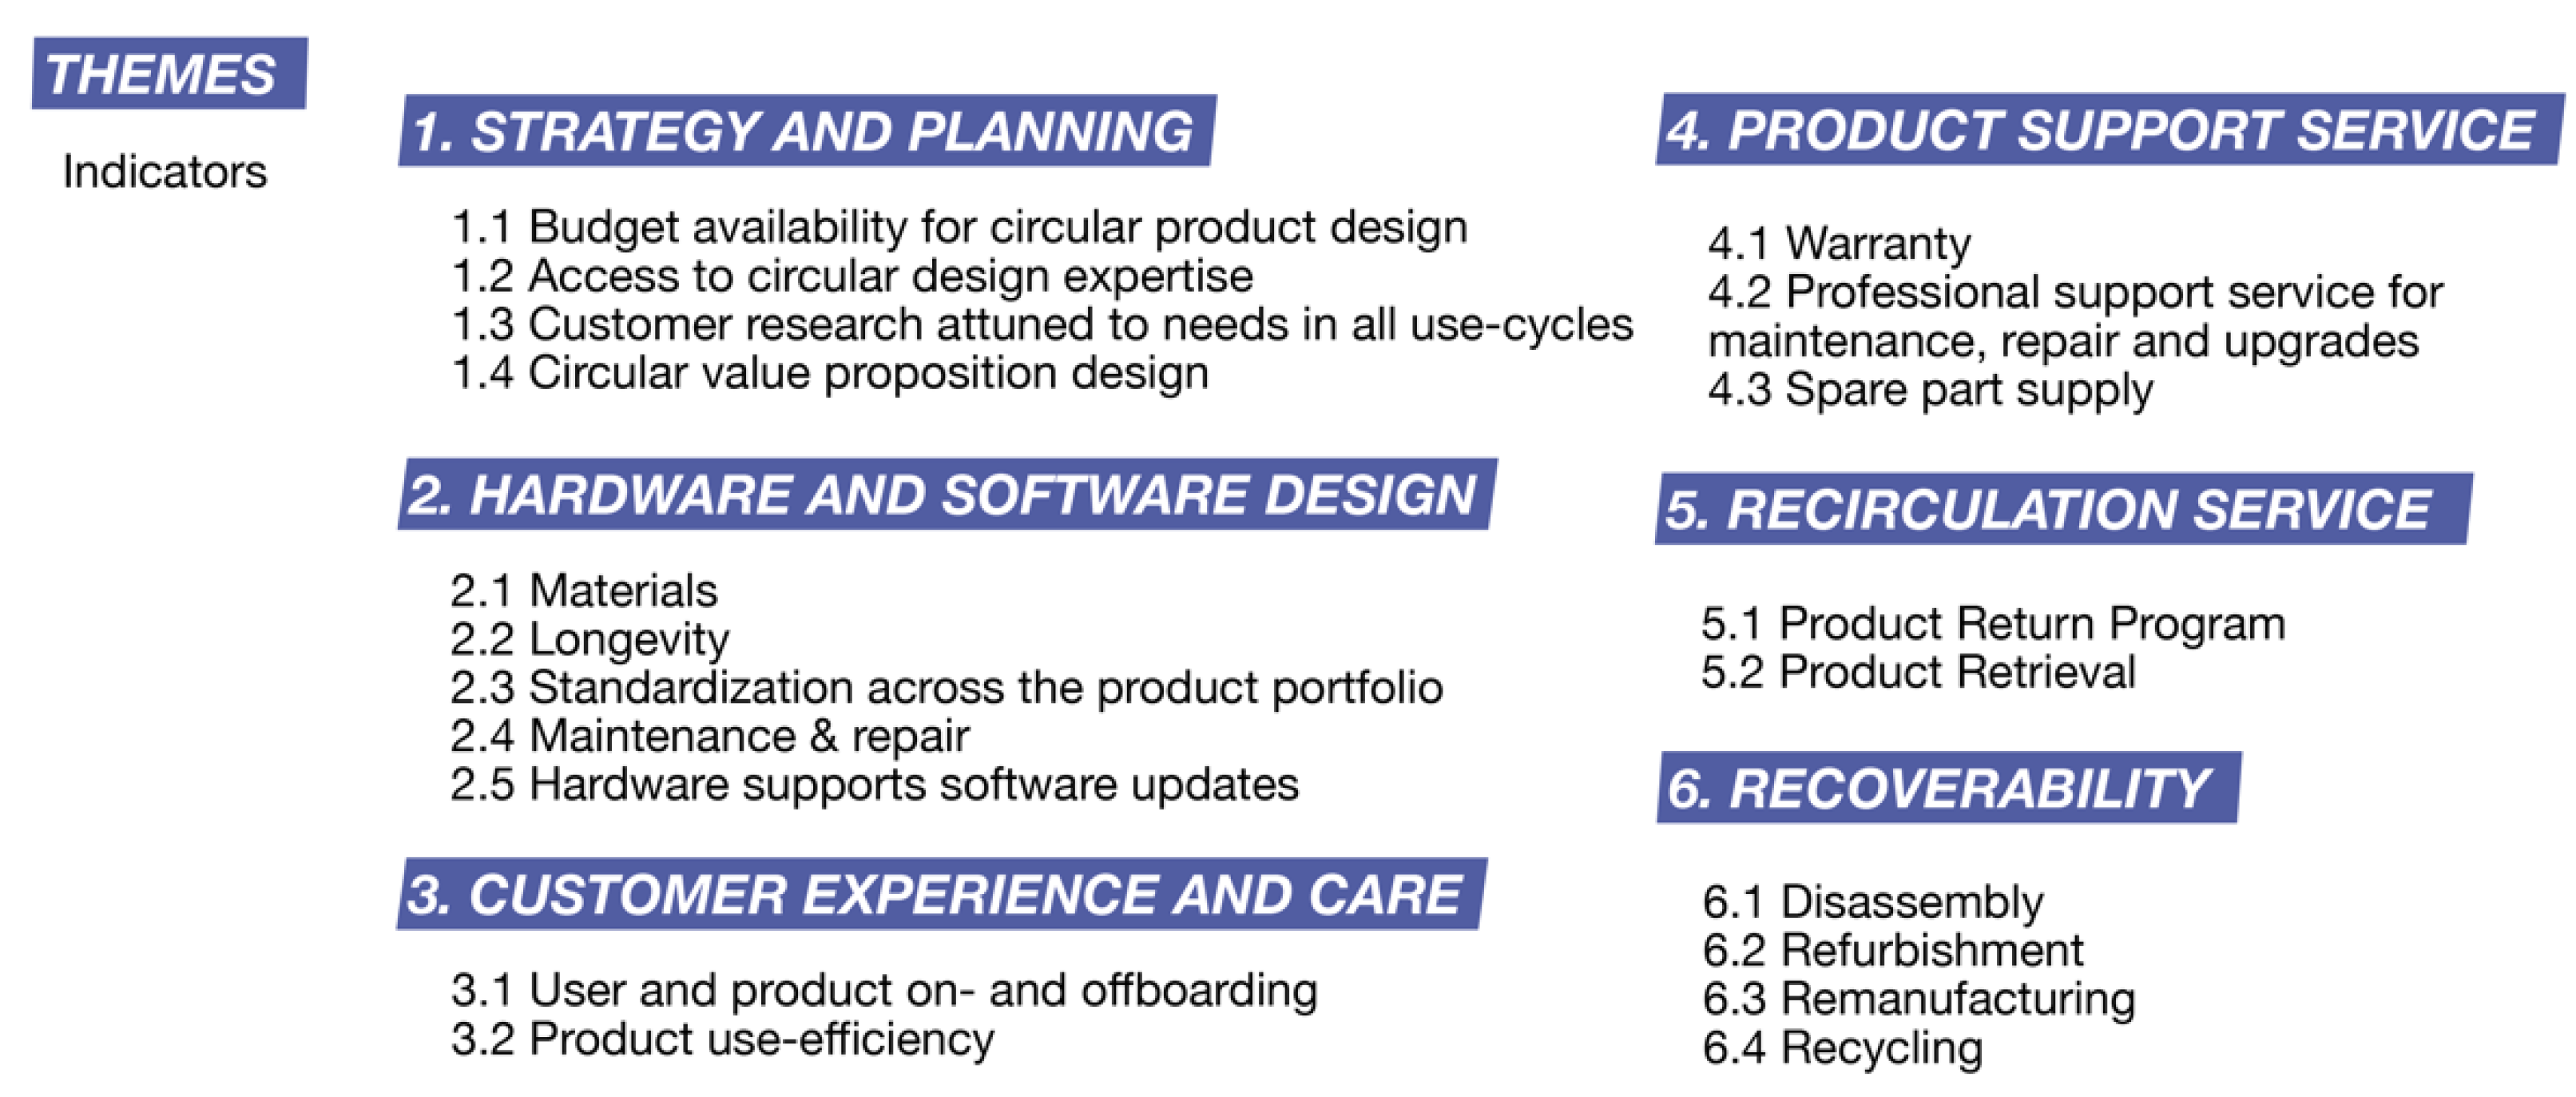
Figure 1. The final set of themes and indicators.
2.2. Development of the Assessment Questions
The literature review and design iterations formed the basis for the development of the assessment questions and the method visual. A first set of questions was developed based on the structure of themes and indicators as well as on the follow-on literature review. The set was then fine-tuned through iterations and feedback loops from this study’s TU Delft research team. In addition, knowledge coproduction sessions were organized to assess the questions’ significance and completeness. The answer options were developed to reflect the readiness grades for the implementation of design activities. This was achieved by considering that design implementation can also be “planned” or “initiated”, if not yet fully implemented. Most questions had “not applicable” as an answer option to let companies tailor this method to their own product type and context, adding to the method’s transversality, as the appropriate strategies to design a product to be circular vary from product to product.
2.3. Development of the Scoring System
Scoring takes places at four levels: individual questions, indicators, themes, and aggregates of all scores into a single number (see Figure 2). A maximum of 1 point can be scored for each question. All the themes, indicators, and questions have equal weighting as the importance of the themes, indicators and questions is highly dependent on the type of product being assessed. The appropriate weighting can be determined by industry-experts. Adding up the score for a specific unit (theme, indicator, or question) and dividing this by the total score for that unit gives the average score (%) (Figure 2).
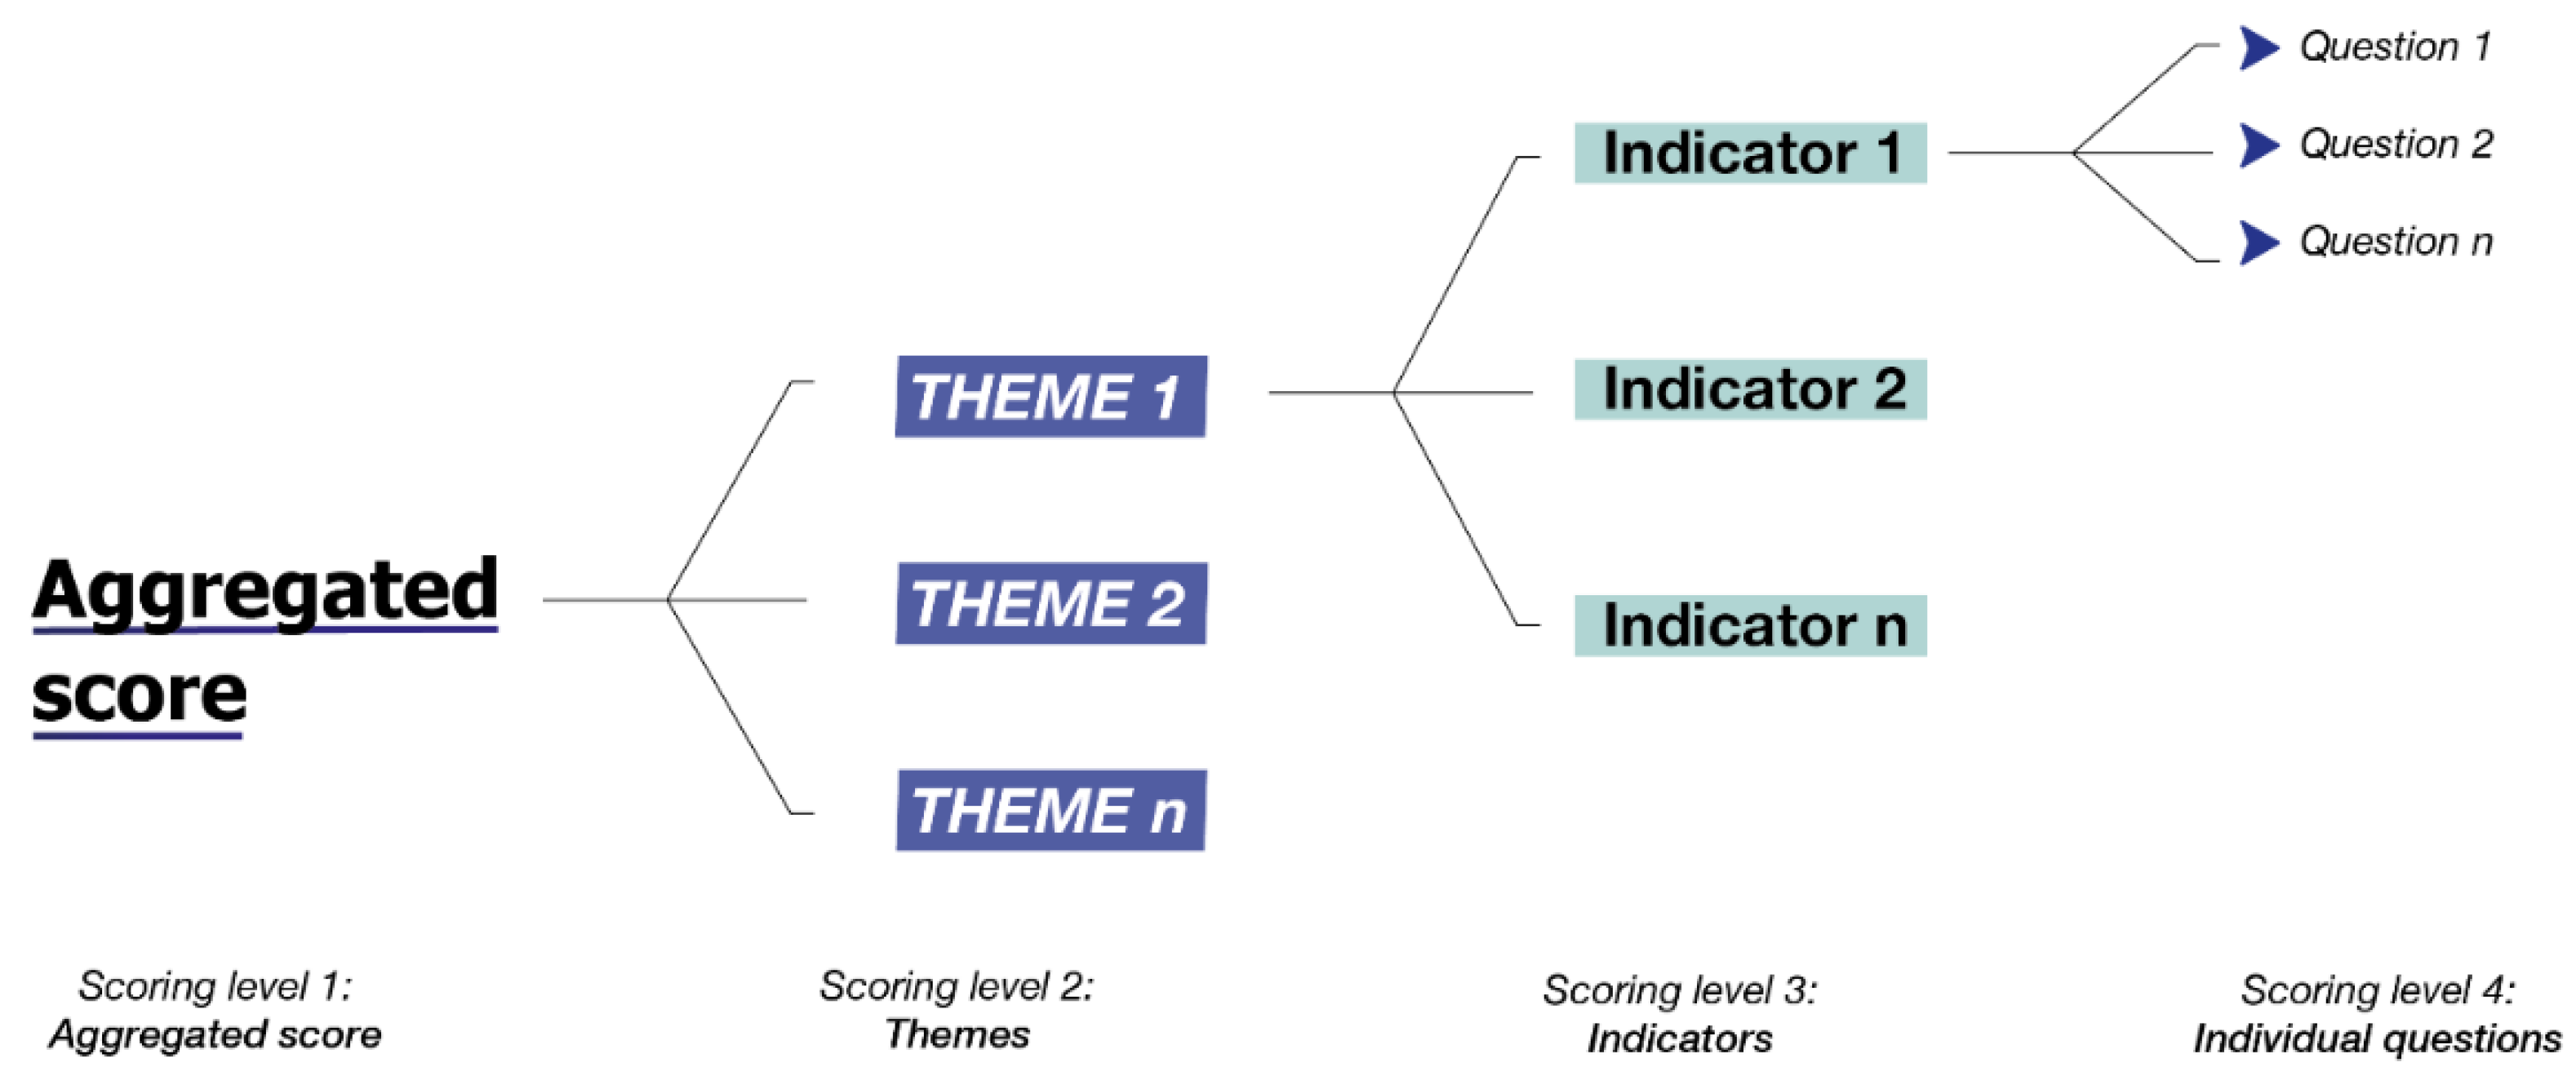
Figure 2. Scoring system using four levels.
2.4. Developing the Visual
According to the method criteria, a visual allows for ease-of-communication of the results, fits the contents, and facilitates time-efficient use. Indicator visuals from literature were used as a reference for developing the final visual. These indicator visuals tend to use a radial structure to show the scores and the different axes of evaluation. Scores can be indicated by both lines and numbers. Colors were used to label different indicators.
Based on insights from indicator visuals in the literature and design iterations, researchers created the first versions of the visual. This was updated along with progress in the theme and indicator development. Factors such as ease-of-communication of the results and having a coherent form language played an important role when developing the final visual (Figure 3). In addition, the visual shows grades of readiness divided over four levels: scores for the assessment questions, scores for the indicators, scores for the design themes, and an aggregated score. This helps to communicate the specific company strengths and shows opportunities for improvement, as it is easy to track which design aspects influence the higher-level scores.
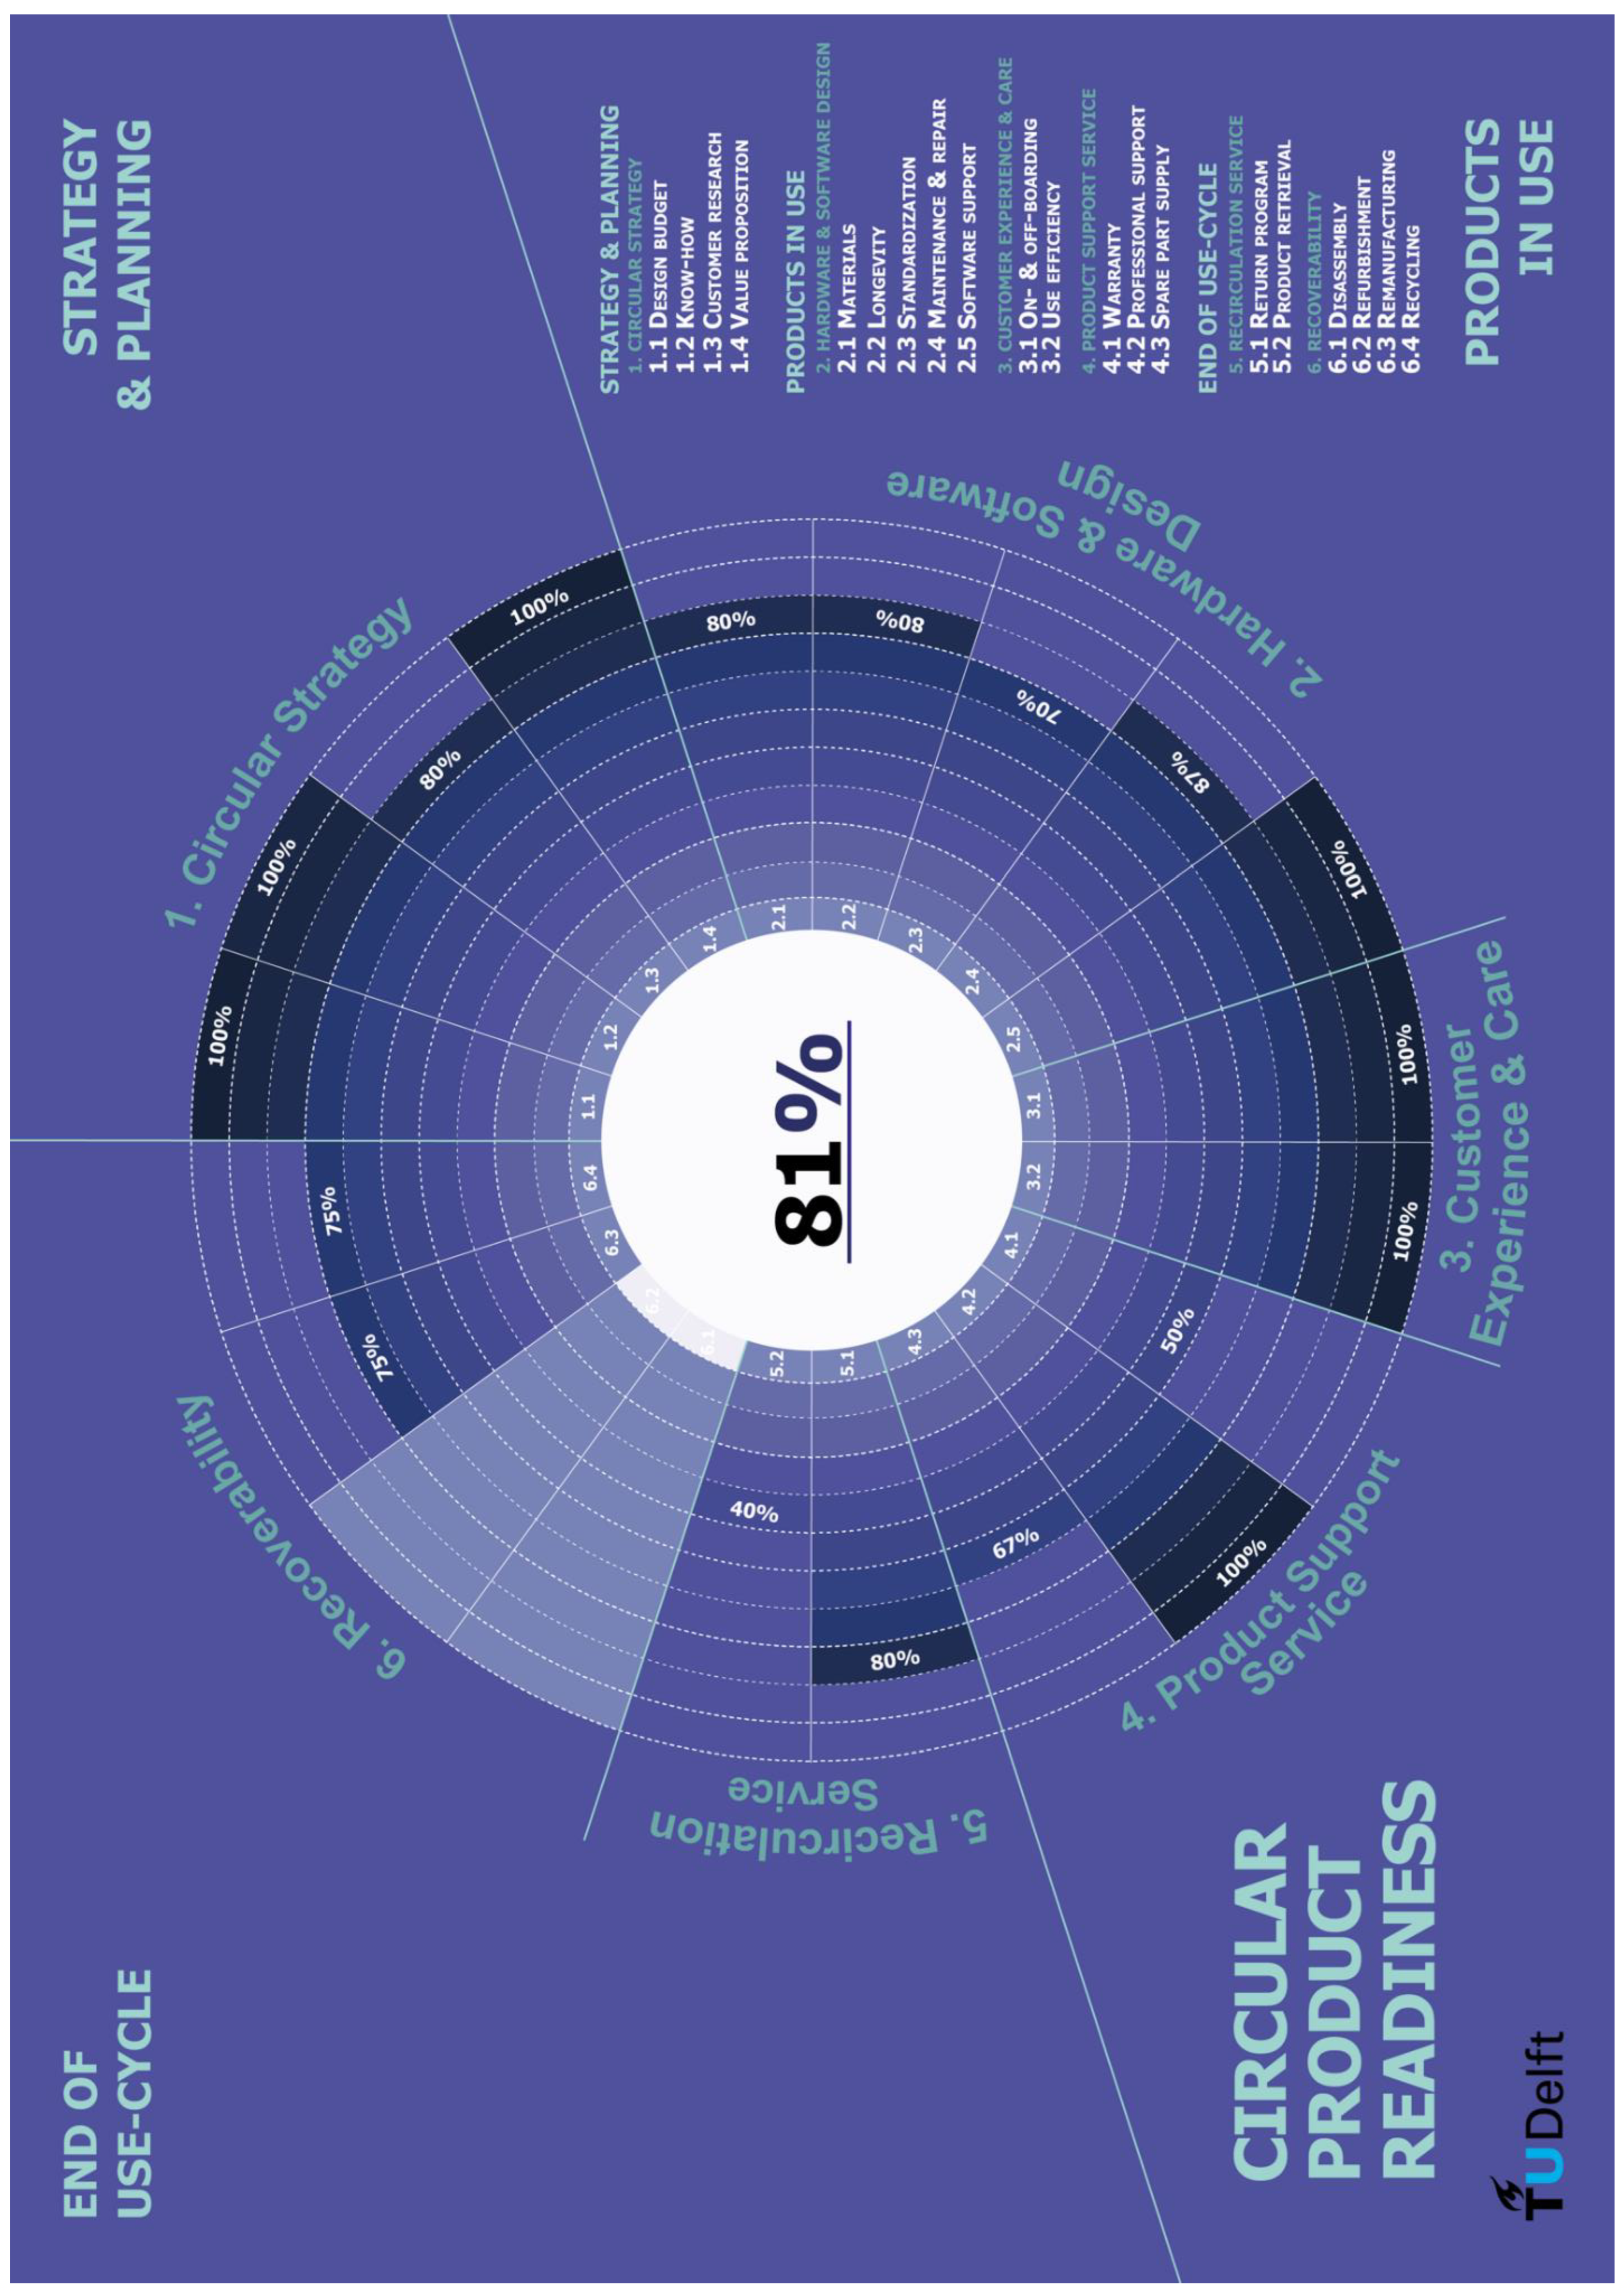
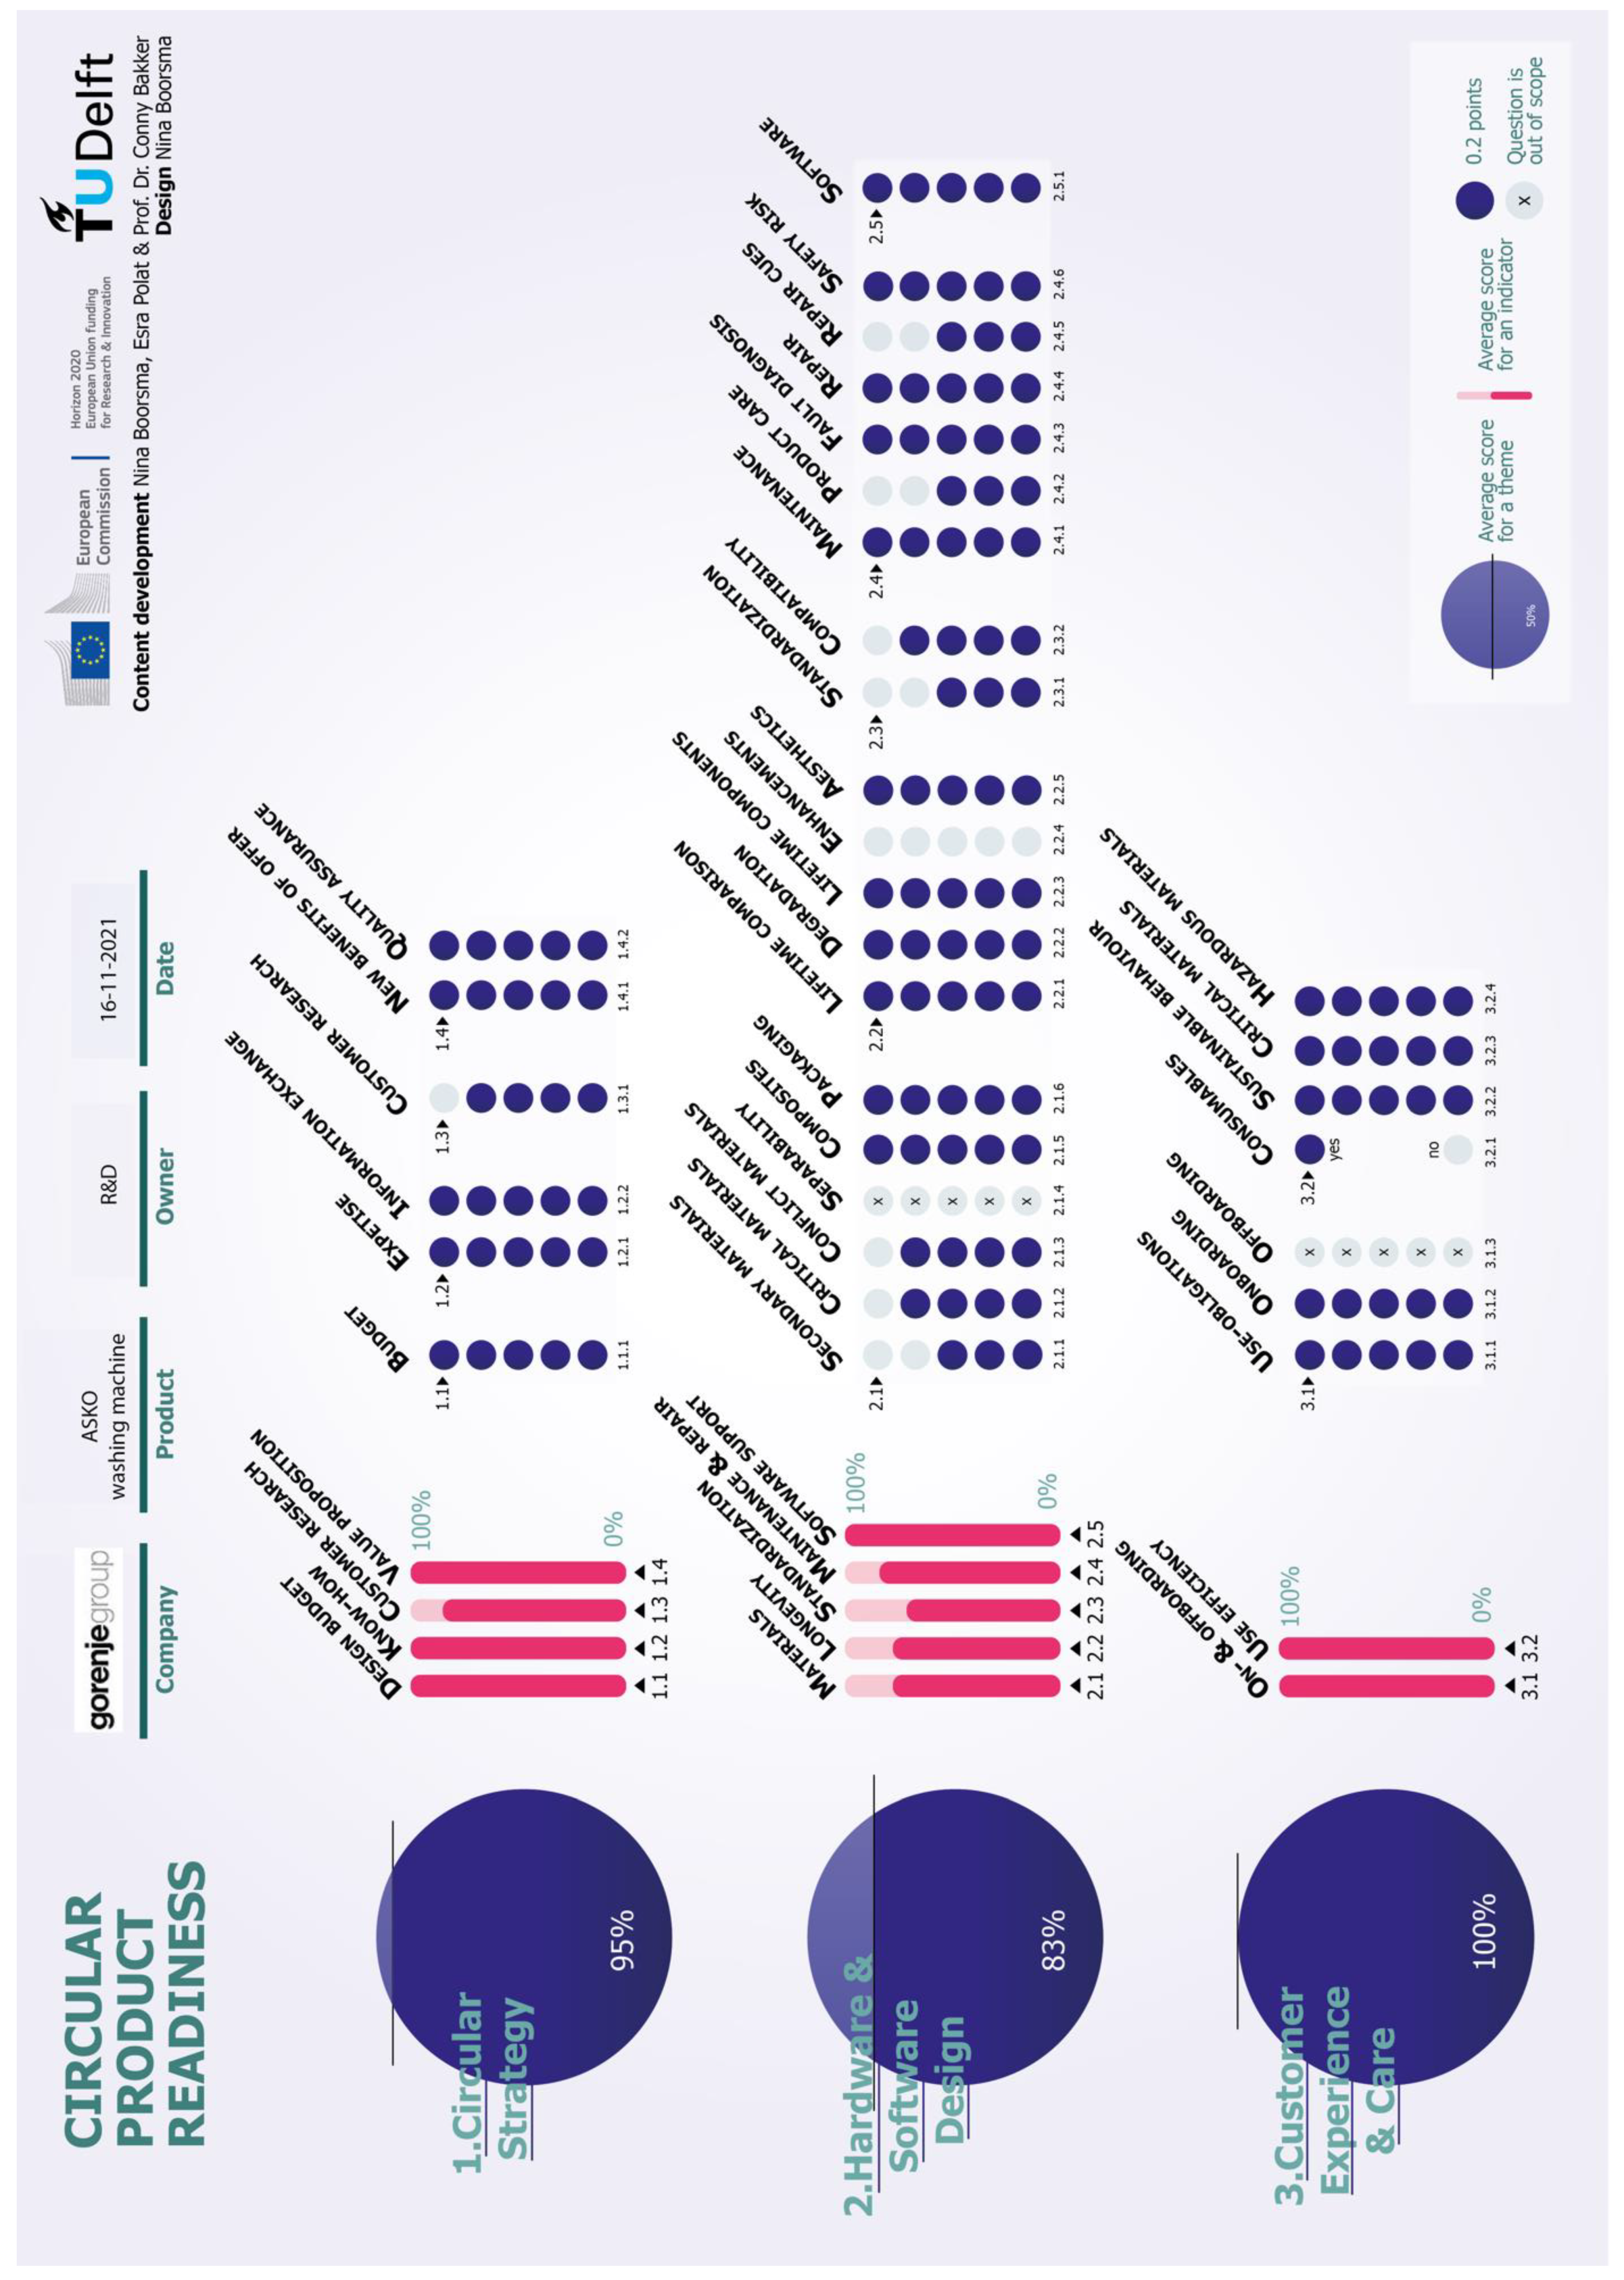
Figure 3. Final visual for the Circular Product Readiness method—results of Gorenje for themes 1, 2 and 3.
2.5. Application of the Method
The CPR method should be applied following a four-step process. The first step is to appoint two employees with prior knowledge and understanding of the circular economy and in-depth knowledge of the product under assessment. Appointing at least two employees, supports the accuracy and effectivity of the entry. The second step is to process the scores and translate them into percentages. The third step is to evaluate and interpret the scores by reflecting on the company’s mission and vision for circular product design. The outcomes are strengths and opportunities for improvement. The fourth step is to adjust the company design roadmap and (re)allocate design resources to fit the changes.
References
- EMF (Ellen MacArthur Foundation). Circulytics—Indicators; EMF: Cowes, UK, 2020.
- Kristensen, H.S.; Mosgaard, M.A. A review of micro level indicators for a circular economy–moving away from the three dimensions of sustainability? J. Clean. Prod. 2020, 243, 118531.
- Saidani, M.; Yannou, B.; Leroy, Y.; Cluzel, F.; Kendall, A. A taxonomy of circular economy indicators. J. Clean. Prod. 2019, 207, 542–559.
- Corona, B.; Shen, L.; Reike, D.; Carreón, J.R.; Worrell, E. Towards sustainable development through the circular economy—A review and critical assessment on current circularity metrics. Resour. Conserv. Recycl. 2019, 151, 104498.
- Cayzer, S.; Griffiths, P.; Beghetto, V. Design of indicators for measuring product performance in the circular economy. Int. J. Sustain. Eng. 2017, 10, 289–298.
- Linder, M.; Sarasini, S.; van Loon, P. A metric for quantifying product-level circularity. J. Ind. Ecol. 2017, 21, 545–558.
- Figge, F.; Thorpe, A.S.; Givry, P.; Canning, L.; Franklin-Johnson, E. Longevity and circularity as indicators of eco-efficient resource use in the circular economy. Ecol. Econ. 2018, 150, 297–306.
- Omwando, T.A.; Otieno, W.A.; Farahani, S.; Ross, A.D. A bi-level fuzzy analytical decision support tool for assessing product remanufacturability. J. Clean. Prod. 2018, 174, 1534–1549.
- van Schaik, A.; Reuter, M.A. Recycling indices visualizing the performance of the circular economy. World Metall. Erzmetall 2016, 69, 201–216.
- Ellen MacArthur Foundation; Granta Design. Circularity Indicators. An Approach to Measuring Circularity. Methodology; EMF: Cowes, UK, 2015.
- Bakker, C.; den Hollander, M.; Van Hinte, E.; Zijlstra, Y. Products That Last: Product Design for Circular Business Models; TU Delft Library: Delft, The Netherlands, 2014.
- EMF (Ellen MacArthur Foundation). Towards the Circular Economy 3: Accelerating the Scale-Up across Global Supply Chains. 2014. Available online: https://ellenmacarthurfoundation.org/towards-the-circular-economy-vol-3-accelerating-the-scale-up-across-global (accessed on 12 January 2022).
- Stahel, W.R. The Performance Economy, 2nd ed.; Palgrave Macmillan: London, UK, 2010.
- Kirchherr, J.; Piscicelli, L.; Bour, R.; Kostense-Smit, E.; Muller, J.; Huibrechtse-Truijens, A.; Hekkert, M. Barriers to the circular economy: Evidence from the European Union (EU). Ecol. Econ. 2018, 150, 264–272.
- Boorsma, N.; Peck, D.; Bakker, T.; Bakker, C.; Balkenende, R. The Strategic Value of Design for Remanufacturing: A Case Study of Professional Imaging Equipment. J. Remanuf. 2022, 12, 187–212.
- EEA (European Environment Agency). Circular by Design, Products in the Circular Economy; European Environment Agency: Copenhagen, Denmark, 2017.
- Boorsma, N.; Balkenende, R.; Bakker, C.; Tsui, T.; Peck, D. Incorporating design for remanufacturing in the early design stage: A design management perspective. J. Remanuf. 2020, 11, 25–48.
More
Information
Subjects:
Engineering, Industrial
Contributors
MDPI registered users' name will be linked to their SciProfiles pages. To register with us, please refer to https://encyclopedia.pub/register
:
View Times:
806
Revisions:
2 times
(View History)
Update Date:
24 Feb 2023
Table of Contents


Notice
You are not a member of the advisory board for this topic. If you want to update advisory board member profile, please contact office@encyclopedia.pub.
OK
Confirm
Only members of the Encyclopedia advisory board for this topic are allowed to note entries. Would you like to become an advisory board member of the Encyclopedia?
Yes
No
${ textCharacter }/${ maxCharacter }
Submit
Cancel
Back
Comments
${ item }
|
${ item.createdUser.fullName }
${ item.createdAt }
${ item.vote }
${ item.reply }
Delete
${ reply.createdUser.fullName }
${ reply.createdAt }
${ reply.vote }
Delete
There is no reply to this comment~
${ item.replyTextCharacter }/${ item.replyMaxCharacter }
Submit
Cancel
More
No more~
There is no comment~
${ textCharacter }/${ maxCharacter }
Submit
Cancel
${ selectedItem.replyTextCharacter }/${ selectedItem.replyMaxCharacter }
Submit
Cancel
Confirm
Are you sure to Delete?
Yes
No