Submitted Successfully!
To reward your contribution, here is a gift for you: A free trial for our video production service.
Thank you for your contribution! You can also upload a video entry or images related to this topic.
Version Summary Created by Modification Content Size Created at Operation
1 -- 6230 2023-02-16 10:27:27 |
2 Reference format revised. Meta information modification 6230 2023-02-17 03:12:20 | |
3 Remove Recently -1 word(s) 6229 2023-02-20 08:43:06 |

Video Upload Options

Do you have a full video?

Confirm

Are you sure to Delete?
Cite
If you have any further questions, please contact Encyclopedia Editorial Office.
Cermakova, E.; Lencova, S.; Mukherjee, S.; Horka, P.; Vobruba, S.; Demnerova, K.; Zdenkova, K. DNA-Based Methods in Identification of Fish Species. Encyclopedia. Available online: https://encyclopedia.pub/entry/41284 (accessed on 01 May 2024).
Cermakova E, Lencova S, Mukherjee S, Horka P, Vobruba S, Demnerova K, et al. DNA-Based Methods in Identification of Fish Species. Encyclopedia. Available at: https://encyclopedia.pub/entry/41284. Accessed May 01, 2024.
Cermakova, Eliska, Simona Lencova, Subham Mukherjee, Petra Horka, Simon Vobruba, Katerina Demnerova, Kamila Zdenkova. "DNA-Based Methods in Identification of Fish Species" Encyclopedia, https://encyclopedia.pub/entry/41284 (accessed May 01, 2024).
Cermakova, E., Lencova, S., Mukherjee, S., Horka, P., Vobruba, S., Demnerova, K., & Zdenkova, K. (2023, February 16). DNA-Based Methods in Identification of Fish Species. In Encyclopedia. https://encyclopedia.pub/entry/41284
Cermakova, Eliska, et al. "DNA-Based Methods in Identification of Fish Species." Encyclopedia. Web. 16 February, 2023.
DNA-Based Methods in Identification of Fish Species
Edit

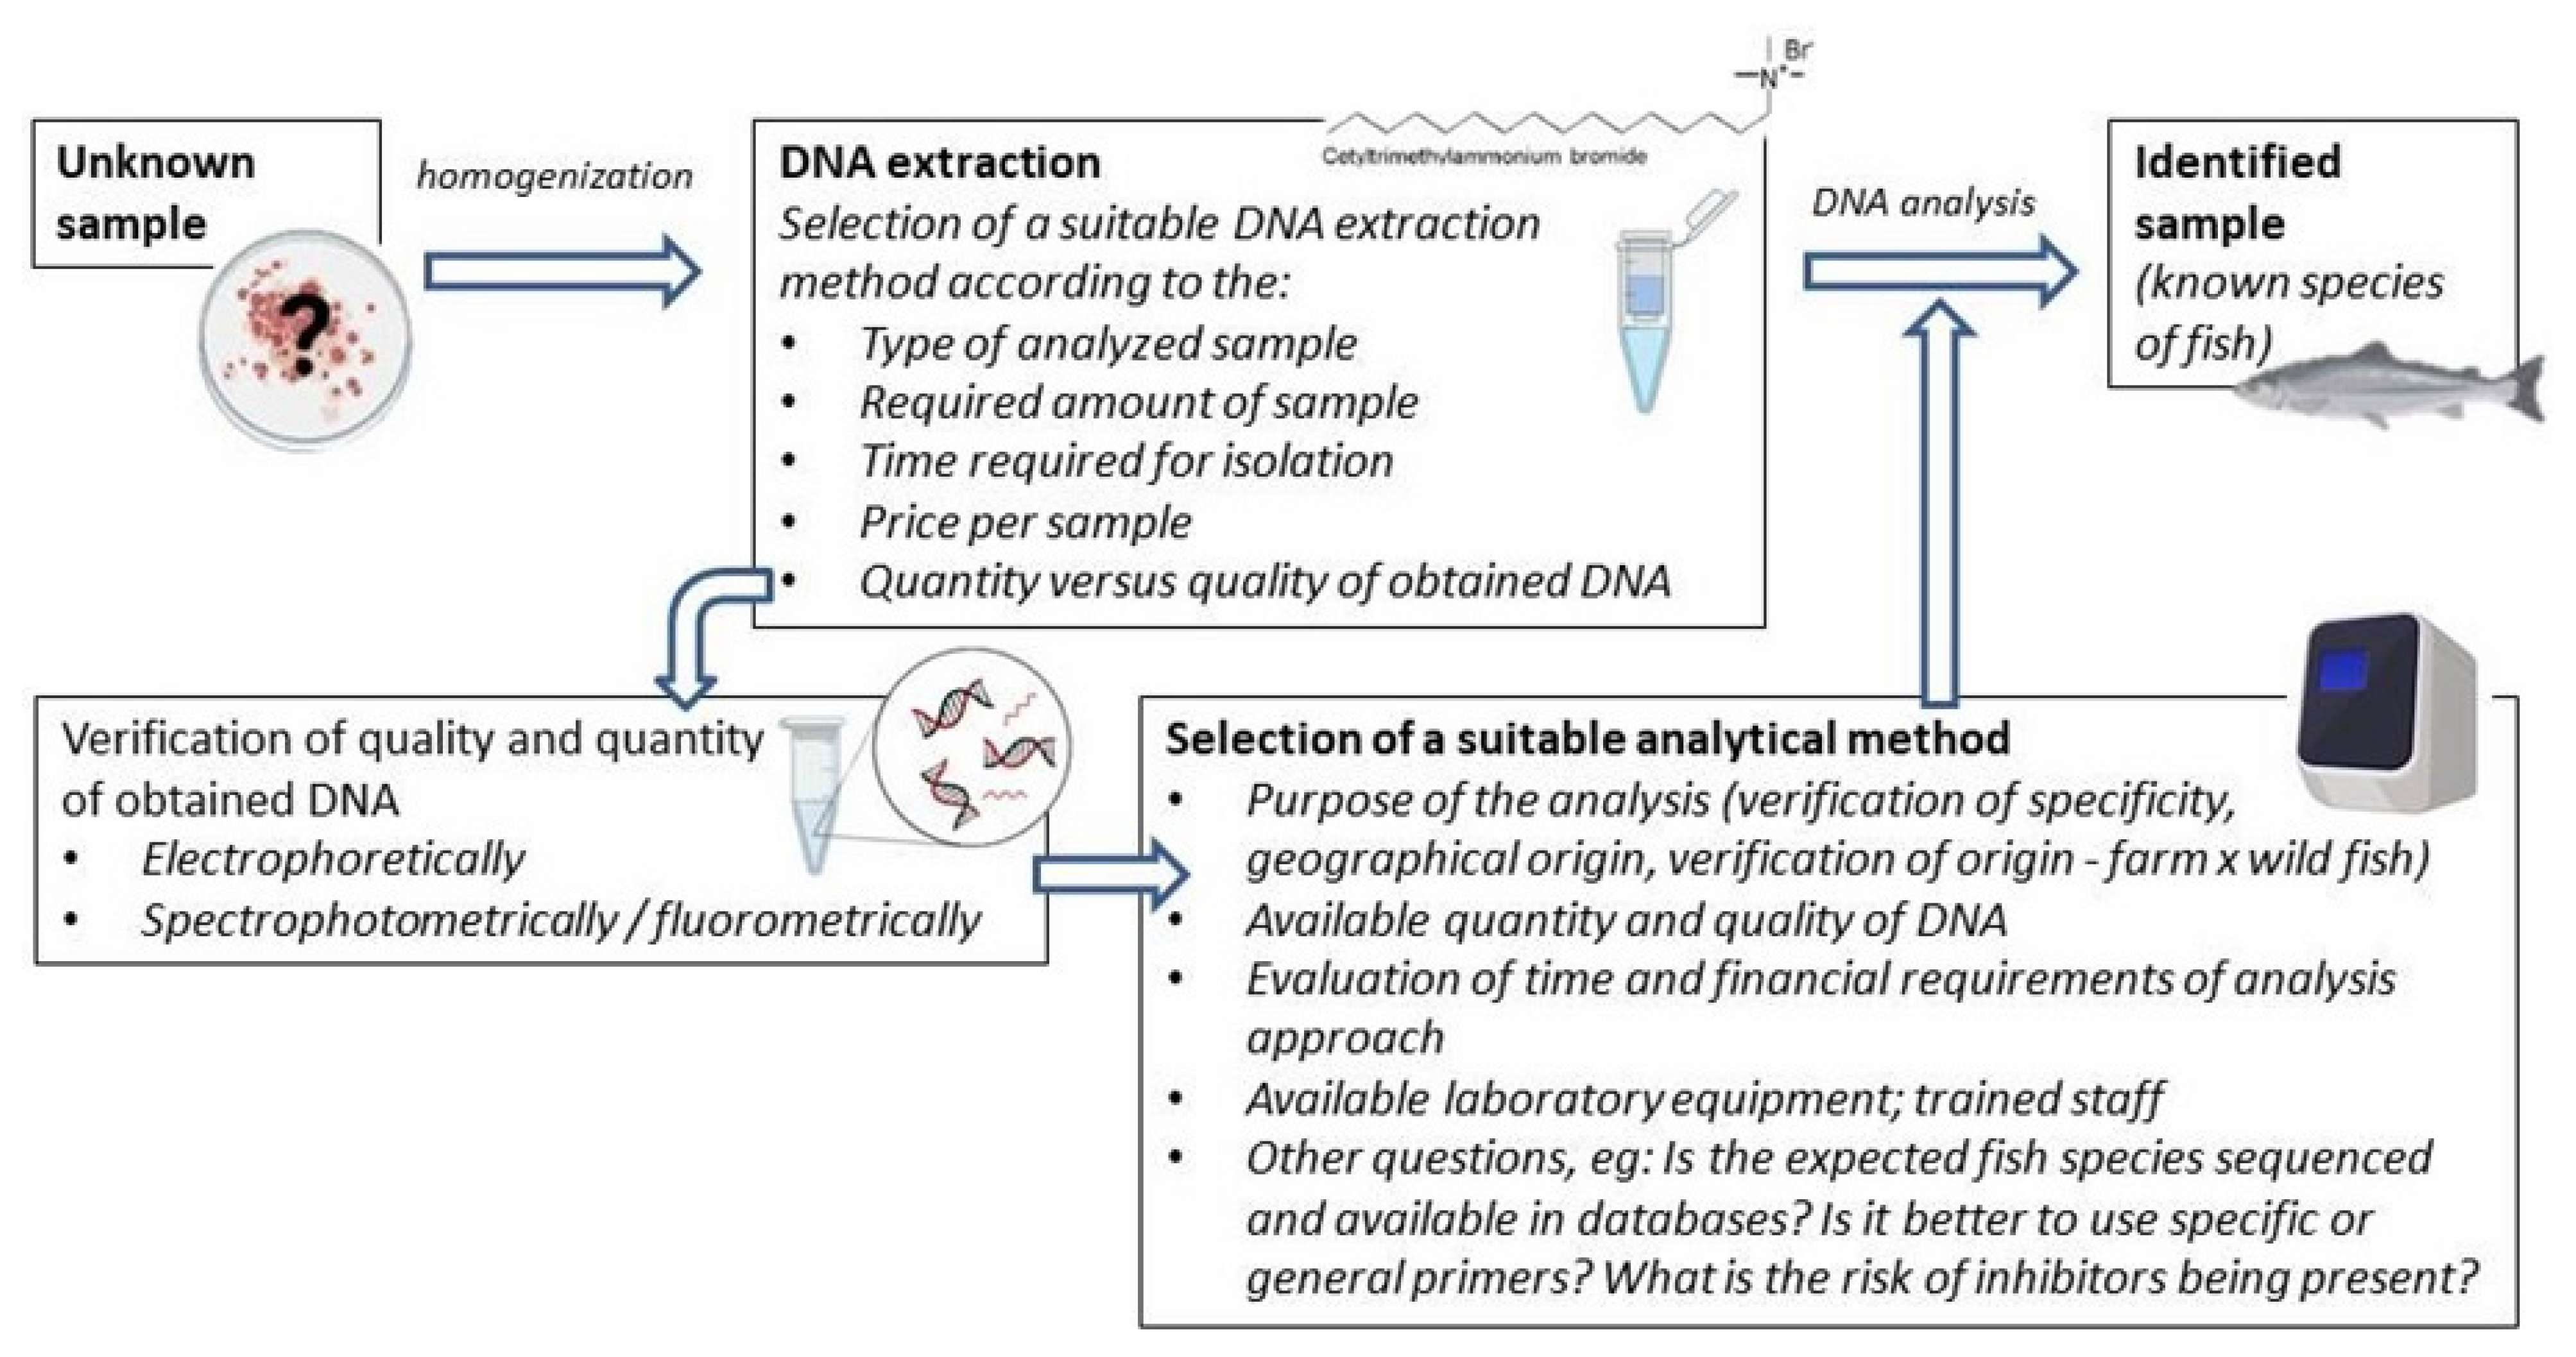
Various methods, differing in their principle and detected target molecules, can be used for fish species identification and adulteration detection. Parvalbumin detection has been preferred, but this is quite demanding compared to other food allergens because of its high biochemical and immunological variability among fish species and differing thermostability. This in itself sidelines the use of some types of methods, e.g., proteomic ones, and favors DNA-based methods, whose target, DNA, is not destroyed by the processing. Using DNA analysis, for example, a common form of adulteration—replacing the species (a more expensive one with a cheaper one)—can be detected. Additionally, DNA-based methods have the potential to detect the consumer being misled about the fish’s origin, another common type of adulteration. This is even more relevant, since genetically modified (GM) fish can be bought on the world market. Even though GM organisms do not pose a threat to public health and their quality is no different, consumers should be informed about the content of GM products, and because the public can be skeptical about GM products, sellers may want to hide this information and deliberately deceive the consumer.

DNA-based methods fish food fraud

1. Introduction

Food adulteration, the act of misleading customers for financial gain, is currently one of the most discussed topics in the field of food analysis. It is a substantial concern that poses significant risks to public health and reduces food quality and nutrition value [1]. Fish and fish products are among the most commonly adulterated foods, which is driven by their increasing consumption worldwide, and fish population decline due to overfishing, along with the subsequent commercial consequences. Additionally, fish are among the most easily adulterated foods because of the morphological changes that occur during processing, which make visual identification impossible [2][3][4][5].
Fish and fishery products are a highly valuable source of nutrients. Their muscle is rich in both macro- and micro-nutrients, especially (i) proteins, (ii) vitamins, (iii) polyunsaturated omega-3 and omega-6 fatty acids important for the human neural system, and (iv) minerals, such as calcium, iodine, zinc, iron, and selenium [6]. Simultaneously, fish meat is usually low in saturated fats, carbohydrates, and cholesterol, and low in purines compared to other types of meat. This all makes fish an irreplaceable dietary component.
Despite all of the benefits of fish consumption, it is necessary to mention some of its risks. In addition to the concern about eating small bones in meat, there is the major issue of food allergy. Fish-induced allergy is a severe worldwide problem, as evidenced by an estimated prevalence of 7% in the pediatric population, often persisting into adulthood with serious symptoms [7][8]. Fish allergy is a pathophysiological immune response to specific proteins mediated by IgE, commonly manifesting as oral allergy syndrome, diarrhea, abdominal pain, rhinitis, angioedema, and several other symptoms, even as life-threatening anaphylaxis [9]. Allergenicity differs across fish species due to the content of specific proteins (main allergens) [10][11]. Parvalbumins are the leading ones; enolases, aldolases and gelatin have also been identified as fish allergens, although their role in fish allergenicity is still not clearly understood [9][12].
Parvalbumins are highly stable proteins with a low molecular weight (10–12 kDa) common in fish muscle [13]. Fish contains both α and β parvalbumins, with most allergens belonging to the β line [14]. The expression of β parvalbumins occurs mainly in the sarcoplasmic part of fish white muscle tissue. This is directly related to the allergenicity of individual species; for example, carp, which is mainly composed of white tissue, contains an up to 100 times higher level of the parvalbumins than tuna (Thunnus) or mackerel (Scomber), which primarily contain red tissue and therefore have a lower allergenicity potential [9]. Furthermore, there are various known paralogs of parvalbumins which cause allergies differently and play a physiological role in fish muscle adaptation to environmental influences. For example, salmon (Salmo) contains only one allergenic parvalbumin isoform, parvalbumin β1 [15]. In addition, food processing may influence fish allergenicity by parvalbumin degradation or oligomerization, which may change the IgE epitope number [9][16][17]. Generally, two conclusions can be drawn on the allergenicity of parvalbumins based on current knowledge: (i) parvalbumins from different species can vary in allergenicity; and (ii) parvalbumin isoforms from the same species can vary [9]. This all encourages consumer demand for a verification of food identity, and food inspection authorities to implement reliable, strict quality control mechanisms [2].

2. Identification of Fish Species

Traditional fish species identification has been based on the qualitative and quantitative analysis of morphological features. Qualitative evaluation is usually focused on elementary characteristics such as fish body shape, fin placement, color, or the position of the mouth and possibly whiskers; quantitative morphological features commonly include the length of various body parts, number of scales, number of vertebrae or bones, etc. All of the above-mentioned characteristics are specific for a certain group of fish, depending on the nature of the species’ environment and the trophic resource use of the species (especially on the method it uses to obtain food). For this reason, it is still one of the methods used for the fast determination of fish species. However, the application of these attributes is not possible for the majority of processed products, in which fish meat is usually mixed with other ingredients and the morphological characteristics cannot be evaluated. Additionally, it is not possible to determine the areas and/or geographical origin of fish in processed products. This all emphasizes the need for the development of reliable analytical methods that enable fish species identification and that can detect food adulteration and consumers being misled.
In general, various methods for the detection of fish adulteration have been developed over the last few decades. These primarily include gas and liquid chromatography [18][19][20], mass spectrometry [21][22], infrared spectroscopy [23], nuclear magnetic resonance (NMR) [24][25], immunochemical methods (e.g., Enzyme-Linked Immuno Sorbent Assay—ELISA) [26], and electrophoresis [18][27]. Each of them is based on a different principle and thus provides certain possibilities for detecting different means of food adulteration. For example, to determine a fish origin region, stable isotopes of calcified structures can be analyzed [28]. Furthermore, the analysis of δ13C isotopes by NMR spectroscopy allows the differentiation between wild and farmed fish [24]. For instance, organically farmed and conventionally farmed salmonid fish can be distinguished by the isotopes δ15N and δ13C [29]. However, species substitution is one of the most common types of fish adulteration, and thus analytical methods enabling fish species identification are of critical importance.
Currently, fish species identification is mostly performed by proteomic and/or genomic methods. Both approaches are reliable for the analysis of fresh or thawed tissue, but also have their specifications and limitations. Protein-based methods may fail to analyze heat-treated or dried samples due to the denaturation of proteins (occurring after the heating at 40–60 °C), causing the loss of their biological functions and changes in many of their properties. Physical and chemical conditions can also damage DNA molecules, but unlike proteins, DNA fragments contain sufficient differences in their sequence that allow species characterization [30][31]. Furthermore, the nucleotide sequence enables the identification of species from all cell types and is independent of the tissue source or sample damage. Other significant benefits of the DNA-based methods include their specificity, sensitivity, and speed [3][4][32]. This has all led to their frequent application and predominance over all of the above-mentioned methods [33][34][35].

3. DNA-Based Methods

Various DNA-based methods are used for fish species identification. Although they are often based on different bases, their implementation includes several similar preparatory steps, such as DNA isolation and in silico analysis using available databases (e.g., designing specific primers). The general procedure is shown in Figure 1.
Figure 1. Scheme of the general procedure using DNA-based methods.
Of the DNA-based methods which have been developed so far, the most significant for fish species identification are the following (sorted alphabetically): Amplified Fragment Length Polymorphism (AFLP), DNA barcoding, Forensically Informative Nucleotide Sequencing (FINS), High-Resolution Melting (HRM) analysis, Polymerase Chain Reaction (PCR), Random Amplified Polymorphic DNA (RAPD), Restriction Fragment Length Polymorphism (RFLP), or Single-Stranded Conformational Polymorphism (SSCP); some of them are already available for commercial applications [3][36][37][38][39]. Over the last few decades, the Loop-Mediated Isothermal Amplification (LAMP) method, commonly used for the detection of a fish virus or seafood species [40][41], has been also used for identifying fish species [42][43][44][45]. Several methodologies have been carried out using either nuclear DNA (nDNA) or mitochondrial DNA (mtDNA). Thus, complex and regularly updated databases of genome sequences facilitating the selection of appropriate target molecules and identification markers are crucial for most of the methods.

3.1. Nucleic Acid Databases

The field of DNA sequencing technology has a rich history. In the past, DNA barcoding and FINS were widely employed, providing information mainly about mtDNA. This was followed by WGS, which together with mtDNA information was able to provide the complete information regarding the organisms studied. The overwhelming production of DNA sequences led to the necessary introduction of nucleic acid databases.
The Fish Barcode of Life Initiative (FISH-BOL), a global effort to coordinate and standardize a reference sequence library for fish species, aimed to create a reliable, fast and cost-effective way to identify fish species based on DNA analysis. For this purpose, a public database of standardized mtDNA reference sequences was created in 2005 [46]. Although it is not complete, and the number of sequenced fish species is constantly growing [37][47], the FISH-BOL website is no longer available today; the obtained sequenced data are available in the Barcode of Life database (BOLD).
Currently, there are several databases of nucleic acid sequences. The most important ones are (i) the European Molecular Biology Laboratory (EMBL), which was established in 1980 as the first nucleotide sequence database in the United Kingdom, and which to this day is publicly available at the website of the European Bioinformatics Institute (http://www.ebi.ac.uk, accessed on 20 October 2022); (ii) the DNA Data Bank of Japan (DDBJ), managed by the Center for Information Biology (CIB), which mainly collects data from Japanese research (publicly available at http://www.ddbj.nig.ac.jp, accessed on 20 October 2022); and (iii) the GenBank database, maintained by the National Center for Biotechnology Information (NCBI), available at http://www.ncbi.nlm.nih.gov, accessed on 20 October 2022.
There are also databases that focus directly on fish nucleotide sequences, such as the European Union database FishTrace (https://fishtrace.jrc.ec.europa.eu/, accessed on 20 October 2022), which is limited to European marine fish species. Unlike FISH-BOL, which focused on COI sequences only, FishTrace includes sequences for both mitochondrial (cytb) and nuclear (rhodopsin) gene. All of the databases contain the same set of information, including species names, collection records or sample identifiers.
Knowledge of a fish genome sequence can significantly facilitate progress in the development of DNA-based identification methods. The first sequenced fish genome was Fugu (Takifugu rubripes) in 2002 [48], and the number of newly sequenced species rose slowly over the next few years. A breakthrough came in 2020, when more than 300 fish genomes were published [49], and this trend has continued to this day. In April 2022, the whole genome sequence (WGS) was available for almost 900 fish species, mainly in the NCBI repository and to a lesser extent also in other repositories, e.g., GigaDB and the ENA. Even though this is an impressive number, it represents less than 3% of the 32,000 total fish species on record [50].

3.2. Mitochondrial and Nuclear Identification Markers

Identification markers are defined as parts of DNA sequences unique to a given species. These markers must meet the basic requirements for analysis. First of all, they must have sufficient specificity for a particular species to be identified. The choice of a suitable marker for a given purpose depends on the requirements, in particular, whether a qualitative or quantitative analysis is being performed. Various mitochondrial and nuclear markers, with different advantages and disadvantages, are currently used for this purpose.
For the identification of fish species, mitochondrial loci have been preferred to nuclear genes because of their features: mitochondrial genes belong to a haploid genome, they are present in high copy numbers (particularly in fish muscle tissues), which provides higher sensitivity of detection, and their mutation rate is greater than that of nuclear genes [51][52][53]. This means that the coalescence of neutral genes will be positively correlated with the adequate population size of the species [54]. Thus, according to population genetics theory, mtDNA should evolve four times faster than the average nuclear gene. Hence, mtDNA can be used to follow divergence in very closely related taxa and even within species. An undeniable advantage of mtDNA is the ability to identify the geographical origin of the individual [55][56].
The most common mitochondrial markers used for fish species identification are the following: (i) the gene for cytochrome-c-oxidase subunit I (COI; EC 7.1.1.9), whose 600-bp-long segment became the basis for taxonomic fish differentiation via DNA barcoding [57][58], and (ii) cytochrome b (cytb; EC 7.1.1.8) [59][60][61]. Due to the presence of a high copy number of mtDNA molecules in the cell (~1000× more than copies of nDNA), their occurrence is also expected in highly processed products [52][62]. Furthermore, mtDNA is thought to be more thermally stable due to the greater internal stability caused by its ring structure [63].
Another disadvantage of mitochondrial markers in comparison with nuclear ones is the impossibility of quantifying DNA, because mtDNA concentrations vary depending on the type of tissue [56][64].
The above-mentioned difficulties can be overcome by amplifying nuclear sequences instead, as they have the advantage of possessing a known haploid genome size and quite a high level of uniqueness, even in orthologs of such markers in closely related fish species [51][65]. This phenomenon, based on an absence of selection pressure on introns as they are spliced out and are not reflected in the resulting protein, allows for a high level of mutations, and therefore early diversification of their sequence after the split into new species [66].
As for nuclear markers, the most frequently used ones for fish authentication are β-actin, which has also become an often-used internal control for mRNA quantification [67][68][69], and parvalbumin [70]. Besides these markers, novel nuclear barcode regions have also been proposed for fish species identification [71]. The length of these nDNA barcodes is generally shorter than that of the mtDNA barcodes: this facilitates the amplification of the DNA even for highly processed food products, as well as their compatibility with the current next-generation sequencing (NGS) technologies, which also allow the identification of species in a mixture [52].
Another frequently used marker for species identification are microsatellites, also called STRs (short tandem repeats) [72] or SSR (simple sequence repeats) [73][74]. Microsatellites are short stretches of DNA composed of repeating specific motifs of nucleotide sequences. These motifs are 1–10 nucleotides long. The majority of microsatellites in the genome (30–60%) are probably dinucleotide repeats; the most common motifs in the vertebrate genome are (AC)n or (AT)n [74].
Microsatellites are considered to be one of the most suitable genetic markers due to their extreme variability (polymorphism), multiallelic nature and codominant inheritance (this makes it possible to distinguish heterozygotes). Another advantage is their abundance across the genome, which requires a small amount of DNA to collect data [73][75]

3.3. DNA-Based Methods

3.3.1. Polymerase Chain Reaction (PCR)

The PCR method is used for the selective amplification of a short region of nucleic acid. It has become very popular and, therefore, has been constantly evolving and improving since its discovery in 1983 [76].
The method has gradually developed into several variants, namely end-point PCR, quantitative PCR with fluorescence detection in real time (qPCR), and digital PCR (dPCR) [77][78][79]. The basic principle of the method remains the same for all variants. In general, specific sequence amplification is based on in vitro enzymatic replication that is repeated cyclically. The amplified region (amplicon) is defined by two short oligonucleotides—PCR primers. Each primer binds to single strand of DNA and, subsequently, allows DNA polymerase to begin synthesizing a strand complementary to it. This creates a double-stranded DNA, which is separated into two single-stranded molecules by following denaturation at high temperature. The amplification process is exponential in nature. After the amplification, the detection of the PCR product depends on the type of PCR used.
The end-point PCR requires post-PCR electrophoretic detection on an agarose gel, which allows identification of amplicons by size. After qPCR, agarose electrophoresis is possible if needed, but not required. The qPCR, and also dPCR, allow the detection and quantification of target DNA in the reaction through the detection of fluorescence signals, which increases the sensitivity of the method. The fluorescence signal is produced by intercalating dye, such as SYBR Green I or Eva Green, or by a fluorescent dye-labeled probe.
The result of each qPCR is an amplification curve showing the increase in fluorescence, and thus the amount of product, in time. In the case of intercalating dye, the specificity can be lower because the dye binds to all double-strand products present in the reaction [78]. Therefore, post-PCR identification of fish species using High-Resolution Melting (HRM) analysis of the amplified gene segment (amplicons) is widely used [39][80][81]. HRM relies on the different melting temperatures (Tm) of amplicons that occur due to minor variations in nucleotide composition, especially on the number of guanine and cytosine, and the length of the sequences. The dsDNA melts as the temperature increases. Thus, the DNA-binding fluorescent intercalation dye is released, and the melting profiles can be recorded and systematically and statistically processed using specific HRM software. Based on the different Tm values and/or the shape of the curve, it is possible to distinguish between closely related species even when a single base variation is present between their dsDNA sequences [82][83][84]. HRM is an advanced method that provides a high level of confidence and accuracy, but it lacks the determination of the precise nucleotide differences in the analyzed amplicons [80][81][84][85][86]

3.3.2. Sequencing Methods

Today, many sequencing technologies exist. Traditional Sanger sequencing, which is limited by its ability to sequence only one DNA fragment at a time and lower sensitivity, has been overtaken by modern approaches using massive parallel sequencing based on NGS. NGS platforms can be roughly divided into long-reading (about 1 kb and above), such as MinION, and short-reading (usually <300 bases/read) sequencing platforms, e.g., Illumina, Ion Torrent, or Pyrosequencing, that provide higher throughput and are most suitable for PCR amplicon sequencing [87][88][89][90].
For fish species identification, Sanger sequencing and the Illumina platform are the most commonly used sequencing techniques. Both sequencing techniques, the Sanger dideoxy method (also known as capillary electrophoresis sequencing) and Illumina NGS, use the principle of amplification, in which DNA polymerase adds fluorescently labeled nucleotides to the growing strand one after the other, and the inserted nucleotide is subsequently identified due to its fluorescent label.
The advantage of Sanger sequencing is its speed and the ability to sequence relatively long fragments (up to 1000 bp). It is also cost effective for low numbers (1–20) of samples. However, it has a lower throughput, detection limit (15–20%) and ability to identify novel variants (so-called discovery power) compared to NGS. Thus, the Sanger method is an effective approach for variant screening studies when the total number of samples is low [91][92].
Illumina has higher mutation resolution, from large chromosomal rearrangements to single nucleotide variants, and better discovery power. This is due to the higher sequencing depth, i.e., the number of times that a given nucleotide in the genome has been read, which provides the higher sensitivity (up to 1%) of the technique. The disadvantages of NGS include the need to analyze multiple samples at once to make the method less time consuming and expensive and the provision of shorter fragments (usually 150–300 bp, depending on the sequencing platform used) [91][93]. Therefore, NGS is a suitable technique for analysis where the massive sequencing of fragments per run or the performance of deeper sequencing to detect novel or rare variants is required.
Other NGS platforms that is possible use for fish species identification include Ion Torrent [94][95] and pyrosequencing [96][97].

3.3.3. DNA Hybridization

Nucleic acid hybridization is based on the specific association (hybridization or renaturation) of complementary nucleotide sequences derived from different molecules of DNA. The basis of hybridization is usually a fluorescently or radioactively (e.g., 32P) labeled probe with a known nucleotide sequence that allows the detection of a complementary sequence. Hybridization is most often performed on carriers (Southern blotting), but hybridization to nucleic acid in intact cells (“in situ” hybridization) is also possible [98][99].
DNA–DNA hybridization is still an important method used in the analysis of evolutionary relationships between organisms. The method uses the reassociation of ssDNA fragments, where heteroduplexes can be formed in a mixture of DNA of different species. Reassociation conditions (e.g., salt concentration, temperature, viscosity, fragment size) affect the possibility of hybrid molecules formation. Under strict conditions (low salt concentration, high temperature), only very similar sequences can be joined; as the conditions are gradually relaxed, more distinct sequences can pair. The greater evolutionary distance between species leads to more differences in the sequences of their DNA.

3.3.4. Methods Using Restriction Enzyme Cleavage

Restriction Fragment Length Polymorphism (RFLP)

RFLP is one way to study species diversity. It refers to variations in their DNA sequences at sites recognized by restriction enzymes. Such variation results in unique patterns of DNA fragments caused by their different lengths between restriction sites. DNA fragments are separated electrophoretically on the basis of length, size or molecular weight, and then transferred to a membrane by Southern blotting. DNA fragments on the membrane hybridize with a labeled DNA probe, allowing visualization of DNA profiles. In the absence of restriction sites, no DNA cleavage occurs. RFLP thus makes it possible to detect both the absence and the presence of such sites.
With PCR expansion, the development of methods combining PCR and restriction digestion (PCR-RFLP) began. The first step in the PCR-RFLP method is to amplify the fragment containing the variation. This is followed by treatment of the PCR products with the appropriate restriction enzyme. Depending on the presence or absence of a restriction site, restriction fragments of different sizes form. Nested PCR can be used to amplify the target region to avoid false-negative results. Thanks to the use of external and nested primers in two consecutive PCRs, this method has higher specificity, and high sensitivity and efficiency. This also allows amplification of the required fragments even at low DNA concentrations [36][100][101].

Amplified Fragment Length Polymorphism (AFLP)

AFLP is a highly sensitive PCR-based method suitable for population studies and for finding genetic variation between closely related species. It is based on four steps: (i) restriction (specific cleavage of total DNA by two restriction endonucleases, most often MseI and EcoRI); (ii) ligation (adapters are attached to all fragments by T4 ligase); (iii) amplification (pre-selective and selective amplification to reduce the number of fragments); and (iv) fragment visualization. AFLP requires initial screening to find the optimal primer combination; specific primers are complementary to the adapters and have an overhang of one to three bases within the studied fragment. Obtained fragments can be separated by electrophoresis on a polyacrylamide gel and visualized autoradiographically. The final visualization can also be performed in an automatic sequencer if fluorescently labeled EcoRI primers are used.

3.3.5. Polymerase Chain Reaction–Single-Strand Conformation Polymorphism (PCR-SSCP)

In PCR-SSCP analysis, the target sequence is amplified and radiolabeled with primers or nucleotides. Subsequently, the amplified fragments are denatured and subjected to polyacrylamide gel electrophoretic analysis under non-denaturing conditions. Alternatively, the products are visualized on a gel using silver staining. Single-stranded DNA (ssDNA) tends to collapse into a spatial structure due to internal complementarity. Even a very small change in sequence can cause a different structural arrangement. Depending on the conformation of the ssDNA molecule, it migrates through the gel at different speeds during electrophoresis. The efficiency of SSCP decreases with increasing length of the analyzed fragment; the highest efficiency of the method is for up to 200 bp [36][102].

3.3.6. Random Amplification of Polymorphic DNA (RAPD)

As the name of the method suggests, RAPD amplifies random sections of DNA. This is a significant difference compared to classical PCR, where a predetermined target fragment is amplified. Another difference is that the RAPD method uses only one short primer prier for amplification, usually 10 nucleotides long. This arbitrary primer often serves as both a forward and reverse primer, and during PCR amplification anneals at random sites in DNA. Variations in the genetic code give rise to unique patterns of DNA fragments in individual species. The obtained amplicons are analyzed by gel electrophoresis. The profile of the unknown sample is then compared with the profiles of species-specific bands, the so-called DNA fingerprints of the species, obtained with the same primer.

3.3.7. Loop-Mediated Isothermal Amplification (LAMP)

LAMP is a gene amplification method that combines speed, high specificity, and simplicity. Due to the constant temperature amplification, the LAMP method, unlike other methods, does not require expensive laboratory equipment. The use of LAMP can thus greatly simplify routine analysis, although primer design is more complex than for PCR. The method uses a combination of two or three primer pairs (outer F3, B3; inner FIP, BIP; loop primers), which allows the reaction to possess high specificity. Both outer and inner primer pairs are necessary for the initial amplification, but only inner primers are important for the cyclic amplification and elongation of emerging DNA. The amount of the target sequence is thus tripled during each half of the cycle. The result of the reaction in the presence of target DNA are lamplicons of various lengths. Loop primers are not necessary for the reaction to work properly, but they increase the rate of exponential amplification, thus reducing the time required for analysis by up to half (approximately 30 min). Unlike the PCR method, which uses a wide range of polymerases, the LAMP method generally recommends Bst polymerase, which has a higher tolerance to inhibitors.

3.3.8. Multi-Analyte Profiling (xMAP)

xMAP technology can be used for high-throughput multiplexing and the simultaneous detection and quantification of a large number of different analytes in a single reaction. Various biomarkers, such as proteins, nucleic acids, and polysaccharides, can be analyzed, as indicated by the “x” in the method name. xMAP is based on the same principles as PCR, ELISA, and flow cytometry. The fluorescence of molecules bound to polystyrene or magnetic microspheres labeled with up to five hundred different fluorescent dyes (so-called spectral code) is measured. A target molecule is bound to each type of microsphere, which can be, inter alia, a DNA probe or an antibody. The beads are read individually using an xMAP instrument. In each of them, the fluorescence is measured after excitation with two lasers in a silica glass cuvette. The first laser excites the red fluorochrome in the bead at 635 nm, thus determining the spectral code, i.e., the type of analyte. The second laser excites the fluorochrome phycoerythrin at 532 nm; the fluorescence intensity is measured, and the amount of analyte can be determined [103].

3.4. Data Analysis

A combination of PCR with subsequent sequencing of the products is often used to identify species. Using this procedure, primer annealing in the expected gene region can be verified, and other nucleotide sequence analyses can be performed, e.g., the detection of nucleotide variations. Methods using this principle include forensic informative nucleotide sequencing and DNA barcoding [3][57][104]. A significant advantage of these methods is that only one universal pair of primers, specific for a selected marker, can be used for multiple animal species. Among the suitable markers, the mitochondrial genes cytb and COI are widely used for fish species identification [105][106]; thus, their sequences are well known, and primer design is relatively fast. On the other hand, complex databases of reference sequences and the amplification of relatively long stretches of DNA (compared to qPCR, for example) are needed for the identification of species in processed products.

3.4.1. DNA Barcoding

Within the sphere of DNA-based fish species identification approaches, a great deal of attention has been devoted to DNA barcoding, which relies on sequence variations within a short and standardized region of the genome. This selected region, designated a “DNA barcode”, is amplified by PCR and then sequenced.
The barcoding method takes advantage of the high rate of mutations in mtDNA, which leads to a divergence of mtDNA between species and at the same time small differences in DNA within one species [56][107]. Currently, the mitochondrial genes coding COI and cytb are the most commonly used because they are considered reliable DNA barcodes for the discrimination of animal species [57][83][107][108][109]. Additionally, the Consortium for the Barcode of Life (BOL; www.ibol.org, accessed on 20 October 2022) is focused on COI gene sequencing to create a barcode database for all eukaryotic species to standardize the species identification process; the selected reference sequence is about 650 bp in length for most species group [57][107].
The functionality of DNA barcoding for fish species identification has been verified in many studies [58][83][110][111][112]. However, this method also has certain limitations. The most serious disadvantage is that it cannot be used for the identification of fish in mixed samples and, further, as with all mitochondrial markers, the inability to quantify the fish DNA content in the sample. When using markers with a longer sequence (>600 bp), identification in processed products can also be problematic due to DNA degradation. Sequencing reliability is also still being discussed [62]. On the other hand, it is a dependable, fast, and cost-effective way to identify fish based on DNA analysis. For the field of ichthyology, FISH-BOL is a powerful tool for a better understanding of the natural history and ecological interactions of different fish species [113][114][115].

3.4.2. Forensically Informative Nucleotide Sequencing (FINS)

The FINS technique, which combines DNA sequencing and phylogenetic analysis, uses a similar principle to that of DNA barcoding. The amplified specific DNA fragment is sequenced, and this informative nucleotide sequence is subsequently identified by phylogenetic analysis using a database of reference sequences which should be obtained from properly identified fresh samples or authentic preserved samples [116]. The results of the analysis are displayed as a phylogenetic tree, where sequences of the same species are grouped into clades. Based on the calculated distances from the reference sequences of known species, unknown species are also included in the phylogenetic tree. This method thus allows the detection of new unexplored species [117]. To achieve high-resolution results, DNA regions with high inter-specific, but low intra-specific, variation are essential. Thus, rapidly evolving regions with many informative sites in DNA sequences, for example, cytb, COI, or 16S rRNA, are usually used as genetic targets [116][118].

3.5. Advantages and Limitations

The methods using restriction cleavage (RFLP, AFLP) benefit from their simplicity, reliability and robustness. However, the high risk of incorrect identification needs to be taken into account due to the insufficient study of related species, which may form the same restriction profile or polymorphism in the analyzed DNA, leading to a change in the restriction site and thus incorrect evaluation of the analysis. As a result, some authors tend to recommend the use of sequencing and phylogenetic analysis techniques [60][119], such as DNA barcoding or FINS. These methods provide a high power of diagnosis, which minimizes the risk of misidentification of the species. When analyzing a species that has not been studied yet, it will be included in the appropriate node in the phylogenetic tree based on its nucleotide sequence. The phylogenetic tree also contains reference sequences of several species; the assignment to a node corresponding to a certain species thus allows the identification of blank samples [117]. However, sequencing-based methods run into limitations in the analysis of processed and/or pooled samples. In this case, species-specific PCR or LAMP seems appropriate. The advantages of the LAMP method compared to PCR are the lower demand for lab equipment and the possibility of shortening the amplification time by up to a third [120], but PCR is a more robust method. PCR and FINS also have high potential for building nucleotide databases. However, the above-mentioned methods (PCR, LAMP, FINS, RFLP) require prior knowledge of the DNA sequence of the analyzed species for the analysis itself, unlike RAPD and AFLP, for example. Next, RAPD and AFLP can be used for the analysis of multiple loci at once. AFLP markers also exhibit much higher variability than, for example, isozymes. However, neither method is very robust against DNA degradation, and they both have low potential for interlaboratory reproducibility. Compared to AFLP and RFLP, RAPD is considered the most reliable method for species identification when the genome sequence is unknown [63][121]. However, for both RAPD and RFLP, intraspecific variation can be problematic, in contrast to the SSCP method, for example. On the other hand, SSCP is more demanding and always requires the presence of a reference sample on the gel together with the analyzed samples. Despite the high sensitivity of SSCP or PCR-SSCP and its capability of intraspecific differentiation, the amount of information obtained from these methods is much lower than with sequencing [30][122][123][124].

3.6. Evidence of Adulteration in Fish by DNA Analysis

The proper labeling of food and food products is important not only for fair trading, but above all for consumer protection. Nevertheless, adulterated products continue to spread in today’s markets. Fish and seafood are some of the products that are widely tampered with to bring down the high price of the raw material. With fish, species replacement, the undeclared addition of water to muscle, or declaring thawed fish to be fresh are the main forms of adulteration found [118][125][126].
Molecular methods for identifying fish species are based on the detection of DNA polymorphism. Therefore, it is necessary to select a segment of DNA that can be detected even in highly processed food products. The amplification of such target DNA sequences by PCR has become popular. PCR is used to determine the DNA present in fresh or frozen meat, but also in processed and multispecies products [33][47][127].
PCR-RFLP has also been successfully used to identify members of the Cyprinidae family. Chen, Hsieh and Hwang [128] found nearly 38% of processed Cyprinidae commercial samples to be adulterated; using the FINS method, it was confirmed that Oreochromis spp. were used as substitutes.

3.7. Detection of Genetic Modifications in Fish

With the development of modern biotechnology, progress is also being made in the preparation of transgenic (with an altered genome containing foreign DNA) and gene-edited (with altered genome without foreign DNA introduction) fish. Fish is an excellent animal model for genetic research because of their characteristics—mainly fast growth rate, high fecundity, and in vitro fertilization [129].
The first transgenic fish, rainbow trout (Oncorhynchus mykiss), was produced in 1984 by Maclean and Talwar [130]. Since then, various fish species have been genetically modified (GM). The GloFish®, an aquarium fish prepared by inserting a plasmid with a gene for a fluorescent protein of different colors (GFP—green; RFP—red; YFP—yellow) with a strong muscle-specific promoter, is probably the best-known example of transgenic fish. It is not an organism intended for human consumption and was not subject to restrictions on the breeding of GM fish by the Food and Drug Administration (FDA) [131][132].
The first transgenic animal approved for human consumption was the AquAdvantage Salmon® (in 2015, USA) [133][134]. GM salmon, like some other GM fish (tilapia, trout, carp, bream), can grow to market size much faster than ordinary species. This is usually achieved by inserting a transgene cassette containing, e.g., the promoter from fish antifreeze protein gene (AFP), together with cDNA coding the fish growth hormone (GH). Debode et al. [135] published two detection methods using qPCR for food-important fish species, one for AquAdvantage® Atlantic salmon and the second for GM coho salmon (Oncorhynchus kisutch; for research purposes developed by Fisheries and Oceans Canada) [135]. For species-specific amplification, primers complementary to exon 5 of GH (nuclear) specific for salmonid species were used. The sequence of the growth hormone genes has also been used in other studies detecting GM fish [136][137]. In a study by Masri, Rast, Ripley, James, Green, Jia and Devlin [136], the DNA was not only isolated from the fish muscle of transgenic Pacific Coho Salmon (Oncorhynchus kisutch), which is a primary source of DNA in a majority of analyses, but DNA from fins, scales, bones, eggs, skin, slime, and blood was also been successfully amplified.
Nowadays, advanced molecular biological techniques such as TALEN or CRISPR are used for fish DNA editing. Thus, various GM fish species are beginning to appear in the world. GM red sea bream (Pagrus major), known under the Japanese name “Madai”, was launched in Japan in 2021 and is very popular in the area. The CRISPR method was used for a knockout of the myostatin protein. This resulted in a significant increase in consumable muscle in GM red sea bream compared to conventional types. Its breeding could thus be part of strategies to ensure sufficient food for the world’s growing population [138]. Furthermore, gene-edited tilapia, labeled as FLT-01, was developed by Intrexon (subsidiary AquaBounty Technologies). This tilapia has a 26-bp deletion in its myostatin gene, which leads to an improvement in feed conversion ratio and an increase in growth [139].

4. Conclusions

Given the current worrying food situation, in particular the lack of food and the economic situation, the adulteration of food can be expected to become more frequent in the near future, including fish meat and fish products, as they comprise one of the most important commodities. At the same time, fish is one of the main sources of allergens, whose content differs among species. Therefore, fast and reliable methods of fish species identification are being sought. The selection of an appropriate method, target molecules, and identification markers are crucial for a successful analysis. Currently DNA-based methods are preferred, since both qualitative and quantitative analyses of fish meat and processed fish products can be performed with their use, and they have very high levels of specificity and sensitivity. However, the methods used can still be improved in terms of their capacity, speed, price per reaction, and laboratory availability worldwide. In addition to the established PCR method and its variants and the PCR associated with the sequencing of the amplified section (barcoding), the LAMP and xMAP methods are promising tools for fish authentication.

References

  1. Goyal, K.; Kumar, P.; Verma, K. Food adulteration detection using artificial intelligence: A systematic review. Arch. Comput. Methods Eng. 2021, 29, 397–426.
  2. Kotsanopoulos, K.V.; Exadactylos, A.; Gkafas, G.A.; Martsikalis, P.V.; Parlapani, F.F.; Boziaris, I.S.; Arvanitoyannis, I.S. The use of molecular markers in the verification of fish and seafood authenticity and the detection of adulteration. Compr. Rev. Food Sci. Food Saf. 2021, 20, 1584–1654.
  3. Rasmussen, R.S.; Morrissey, M.T. DNA-based methods for the identification of commercial fish and seafood species. Compr. Rev. Food Sci. Food Saf. 2008, 7, 280–295.
  4. Civera, T. Species identification and safety of fish products. Vet. Res. Commun. 2003, 27, 481.
  5. Pauly, D.; Christensen, V.; Dalsgaard, J.; Froese, R.; Torres, F., Jr. Fishing down marine food webs. Science 1998, 279, 860–863.
  6. Food and Agriculture Organization of the United Nations. Report of the Fourteenth Session of the Sub-Committee on Fish Trade; COFI:FT/XIV/2014/5; FAO: Rome, Italy, 2014; 86p.
  7. Buyuktiryaki, B.; Masini, M.; Mori, F.; Barni, S.; Liccioli, G.; Sarti, L.; Lodi, L.; Giovannini, M.; du Toit, G.; Lopata, A.L. IgE-mediated fish allergy in children. Medicina 2021, 57, 76.
  8. Moonesinghe, H.; Mackenzie, H.; Venter, C.; Kilburn, S.; Turner, P.; Weir, K.; Dean, T. Prevalence of fish and shellfish allergy: A systematic review. Ann. Allergy Asthma Immunol. 2016, 117, 264–272.e264.
  9. Kuehn, A.; Swoboda, I.; Arumugam, K.; Hilger, C.; Hentges, F. Fish allergens at a glance: Variable allergenicity of parvalbumins, the major fish allergens. Front. Immunol. 2014, 5, 179.
  10. Griesmeier, U.; Vázquez-Cortés, S.; Bublin, M.; Radauer, C.; Ma, Y.; Briza, P.; Fernández-Rivas, M.; Breiteneder, H. Expression levels of parvalbumins determine allergenicity of fish species. Allergy 2010, 65, 191–198.
  11. Lee, P.-W.; Nordlee, J.A.; Koppelman, S.J.; Baumert, J.L.; Taylor, S.L. Measuring parvalbumin levels in fish muscle tissue: Relevance of muscle locations and storage conditions. Food Chem. 2012, 135, 502–507.
  12. Taylor, S.; Kabourek, J.; Hefle, S. Fish allergy: Fish and products thereof. J. Food Sci. 2004, 69, R175–R180.
  13. Sharp, M.F.; Lopata, A.L. Fish allergy: In review. Clin. Rev. Allergy Immunol. 2014, 46, 258–271.
  14. Mukherjee, S.; Bartoš, O.; Zdeňková, K.; Hanák, P.; Horká, P.; Musilova, Z. Evolution of the Parvalbumin Genes in Teleost Fishes after the Whole-Genome Duplication. Fishes 2021, 6, 70.
  15. Saptarshi, S.R.; Sharp, M.F.; Kamath, S.D.; Lopata, A.L. Antibody reactivity to the major fish allergen parvalbumin is determined by isoforms and impact of thermal processing. Food Chem. 2014, 148, 321–328.
  16. Sletten, G.; Van Do, T.; Lindvik, H.; Egaas, E.; Florvaag, E. Effects of industrial processing on the immunogenicity of commonly ingested fish species. Int. Arch. Allergy Immunol. 2010, 151, 223–236.
  17. Aiello, D.; Materazzi, S.; Risoluti, R.; Thangavel, H.; Di Donna, L.; Mazzotti, F.; Casadonte, F.; Siciliano, C.; Sindona, G.; Napoli, A. A major allergen in rainbow trout (Oncorhynchus mykiss): Complete sequences of parvalbumin by MALDI tandem mass spectrometry. Mol. Biosyst. 2015, 11, 2373–2382.
  18. Hubalkova, Z.; Kralik, P.; Tremlova, B.; Rencova, E. Methods of gadoid fish species identification in food and their economic impact in the Czech Republic: A review. Vet. Med. 2007, 52, 273.
  19. Leduc, F.; Krzewinski, F.; Le Fur, B.; N’Guessan, A.; Malle, P.; Kol, O.; Duflos, G. Differentiation of fresh and frozen/thawed fish, European sea bass (Dicentrarchus labrax), gilthead seabream (Sparus aurata), cod (Gadus morhua) and salmon (Salmo salar), using volatile compounds by SPME/GC/MS. J. Sci. Food Agric. 2012, 92, 2560–2568.
  20. Edirisinghe, R.K.; Graffham, A.J.; Taylor, S.J. Characterisation of the volatiles of yellowfin tuna (Thunnus albacares) during storage by solid phase microextraction and GC–MS and their relationship to fish quality parameters. Int. J. Food Sci. Technol. 2007, 42, 1139–1147.
  21. Carrera, M.; Cañas, B.; Gallardo, J.M. Rapid direct detection of the major fish allergen, parvalbumin, by selected MS/MS ion monitoring mass spectrometry. J. Proteom. 2012, 75, 3211–3220.
  22. Carrera, M.; Canas, B.; López-Ferrer, D.; Pineiro, C.; Vázquez, J.; Gallardo, J.M. Fast monitoring of species-specific peptide biomarkers using high-intensity-focused-ultrasound-assisted tryptic digestion and selected MS/MS ion monitoring. Anal. Chem. 2011, 83, 5688–5695.
  23. Alamprese, C.; Casiraghi, E. Application of FT-NIR and FT-IR spectroscopy to fish fillet authentication. LWT-Food Sci. Technol. 2015, 63, 720–725.
  24. Aursand, M.; Standal, I.B.; Praël, A.; McEvoy, L.; Irvine, J.; Axelson, D.E. 13C NMR pattern recognition techniques for the classification of Atlantic salmon (Salmo salar L.) according to their wild, farmed, and geographical origin. J. Agric. Food Chem. 2009, 57, 3444–3451.
  25. Standal, I.B.; Axelson, D.E.; Aursand, M. 13C NMR as a tool for authentication of different gadoid fish species with emphasis on phospholipid profiles. Food Chem. 2010, 121, 608–615.
  26. Asensio, L.; González, I.; García, T.; Martín, R. Determination of food authenticity by enzyme-linked immunosorbent assay (ELISA). Food Control 2008, 19, 1–8.
  27. Martinez, I.; Jakobsen Friis, T. Application of proteome analysis to seafood authentication. Proteomics 2004, 4, 347–354.
  28. Hoffman, J. Tracing the origins, migrations, and other movements of fishes using stable isotopes. In An Introduction to Fish Migration; CRC Press: Boca Raton, FL, USA, 2016; pp. 169–196.
  29. Molkentin, J.; Lehmann, I.; Ostermeyer, U.; Rehbein, H. Traceability of organic fish—Authenticating the production origin of salmonids by chemical and isotopic analyses. Food Control 2015, 53, 55–66.
  30. Akasaki, T.; Yanagimoto, T.; Yamakami, K.; Tomonaga, H.; Sato, S. Species identification and PCR-RFLP analysis of cytochrome b gene in cod fish (order Gadiformes) products. J. Food Sci. 2006, 71, C190–C195.
  31. Moretti, V.; Turchini, G.; Bellagamba, F.; Caprino, F. Traceability issues in fishery and aquaculture products. Vet. Res. Commun. 2003, 27, 497–505.
  32. Mazzeo, M.F.; Siciliano, R.A. Proteomics for the authentication of fish species. J. Proteom. 2016, 147, 119–124.
  33. Hubalkova, Z.; Kralik, P.; Kasalova, J.; Rencova, E. Identification of gadoid species in fish meat by polymerase chain reaction (PCR) on genomic DNA. J. Agric. Food Chem. 2008, 56, 3454–3459.
  34. Hanák, P.; Laknerová, I.; Švátora, M. Second intron in the protein-coding region of the fish parvalbumin gene—A promising platform for polymerase chain reaction-based discrimination of fish meat of various species. J. Food Nutr. Res. 2012, 51, 81–88.
  35. Griffiths, A.M.; Sotelo, C.G.; Mendes, R.; Pérez-Martín, R.I.; Schröder, U.; Shorten, M.; Silva, H.A.; Verrez-Bagnis, V.; Mariani, S. Current methods for seafood authenticity testing in Europe: Is there a need for harmonisation? Food Control 2014, 45, 95–100.
  36. Gil, L.A. PCR-based methods for fish and fishery products authentication. Trends Food Sci. Technol. 2007, 18, 558–566.
  37. Clark, L.F. The current status of DNA barcoding technology for species identification in fish value chains. Food Policy 2015, 54, 85–94.
  38. Fernandes, T.J.; Costa, J.; Carrapatoso, I.; Oliveira, M.B.P.; Mafra, I. Advances on the molecular characterization, clinical relevance, and detection methods of Gadiform parvalbumin allergens. Crit. Rev. Food Sci. Nutr. 2017, 57, 3281–3296.
  39. Tomás, C.; Ferreira, I.; Faria, M. Codfish authentication by a fast short amplicon high resolution melting analysis (SA-HRMA) method. Food Control 2017, 71, 255–263.
  40. Cai, X.; Xu, M.; Wang, Y.; Qiu, D.; Liu, G.; Lin, A.; Tang, J.; Zhang, R.; Zhu, X. Sensitive and rapid detection of Clonorchis sinensis infection in fish by loop-mediated isothermal amplification (LAMP). Parasitol. Res. 2010, 106, 1379–1383.
  41. Caipang, C.M.A.; Haraguchi, I.; Ohira, T.; Hirono, I.; Aoki, T. Rapid detection of a fish iridovirus using loop-mediated isothermal amplification (LAMP). J. Virol. Methods 2004, 121, 155–161.
  42. Lin, T.C.; Hsiao, W.V.; Han, S.J.; Joung, S.J.; Shiao, J.C. A direct multiplex loop-mediated isothermal amplification method to detect three CITES-listed shark species. Aquat. Conserv. Mar. Freshw. Ecosyst. 2021, 31, 2193–2203.
  43. But, G.W.-C.; Wu, H.-Y.; Shao, K.-T.; Shaw, P.-C. Rapid detection of CITES-listed shark fin species by loop-mediated isothermal amplification assay with potential for field use. Sci. Rep. 2020, 10, 4455.
  44. Wang, Y.; Feng, J.; Tian, X. Application of loop-mediated isothermal amplification (LAMP) for rapid detection of Atlantic cod (Gadus morhua), Pacific cod (Gadus macrocephalus) and haddock (Melanogrammus aeglefinus). Mol. Cell. Probes 2019, 47, 101420.
  45. Li, Q.; Cheng, Y.; Xu, W.; Cui, X.; Cao, M.; Xiong, X.; Wang, L.; Xiong, X. Rapid identification of Atlantic salmon (Salmo salar) based on loop-mediated isothermal amplification (LAMP) using self-quenching fluorogenic approach. J. Food Compos. Anal. 2022, 105, 104224.
  46. Hanner, R.; Desalle, R.; Ward, R.D.; Kolokotronis, S.-O. The fish Barcode of Life (FISH-BOL) special issue. Mitochondrial DNA 2011, 22, 1–2.
  47. Böhme, K.; Calo-Mata, P.; Barros-Velázquez, J.; Ortea, I. Review of Recent DNA-Based Methods for Main Food-Authentication Topics. J. Agric. Food Chem. 2019, 67, 3854–3864.
  48. Aparicio, S.; Chapman, J.; Stupka, E.; Putnam, N.; Chia, J.-m.; Dehal, P.; Christoffels, A.; Rash, S.; Hoon, S.; Smit, A. Whole-genome shotgun assembly and analysis of the genome of Fugu rubripes. Science 2002, 297, 1301–1310.
  49. Randhawa, S.S.; Pawar, R. Fish genomes: Sequencing trends, taxonomy and influence of taxonomy on genome attributes. J. Appl. Ichthyol. 2021, 37, 553–562.
  50. Nelson, J.S.; Grande, T.C.; Wilson, M.V. Fishes of the World; John Wiley & Sons: Hoboken, NJ, USA, 2016.
  51. Rehbein, H. Differentiation of fish species by PCR-based DNA analysis of nuclear genes. Eur. Food Res. Technol. 2013, 236, 979–990.
  52. Paracchini, V.; Petrillo, M.; Lievens, A.; Kagkli, D.-M.; Angers-Loustau, A. Nuclear DNA barcodes for cod identification in mildly-treated and processed food products. Food Addit. Contam. Part A 2019, 36, 1–14.
  53. Cline, S.D. Mitochondrial DNA damage and its consequences for mitochondrial gene expression. Biochim. Biophys. Acta (BBA)-Gene Regul. Mech. 2012, 1819, 979–991.
  54. Pamilo, P.; Nei, M. Relationships between gene trees and species trees. Mol. Biol. Evol. 1988, 5, 568–583.
  55. Bermingham, E.; Forbes, S.H.; Friedland, K.; Pla, C. Discrimination between Atlantic salmon (Salmo salar) of North American and European origin using restriction analyses of mitochondrial DNA. Can. J. Fish. Aquat. Sci. 1991, 48, 884–893.
  56. Lencová, S.; Zdeňková, K.; Akhatova, D.; Demnerová, K. Aktuální trendy druhové identifikace rybího masa pomocí molekulárně-biologických metod. Chem. Listy 2019, 113, 292–300.
  57. Hebert, P.D.; Cywinska, A.; Ball, S.L.; DeWaard, J.R. Biological identifications through DNA barcodes. Proc. R. Soc. Lond. B Biol. Sci. 2003, 270, 313–321.
  58. Ward, R.D.; Zemlak, T.S.; Innes, B.H.; Last, P.R.; Hebert, P.D. DNA barcoding Australia’s fish species. Philos. Trans. R. Soc. B Biol. Sci. 2005, 360, 1847–1857.
  59. Hisar, O.; Erdogan, O.; Aksakal, E.; Hisar, S.A. Authentication of fish species using a simple PCR-RFLP method. Isr. J. Aquac.-Bamigdeh 2006, 58, 62–65.
  60. Calo-Mata, P.; Sotelo, C.G.; Pérez-Martín, R.I.; Rehbein, H.; Hold, G.L.; Russell, V.J.; Pryde, S.; Quinteiro, J.; Rey-Méndez, M.; Rosa, C. Identification of gadoid fish species using DNA-based techniques. Eur. Food Res. Technol. 2003, 217, 259–264.
  61. Sevilla, R.G.; Diez, A.; Norén, M.; Mouchel, O.; Jérôme, M.; Verrez-Bagnis, V.; Van Pelt, H.; Favre-Krey, L.; Krey, G.; The Fishtrace Consortium. Primers and polymerase chain reaction conditions for DNA barcoding teleost fish based on the mitochondrial cytochrome b and nuclear rhodopsin genes. Mol. Ecol. Notes 2007, 7, 730–734.
  62. Teletchea, F. Molecular identification methods of fish species: Reassessment and possible applications. Rev. Fish Biol. Fish. 2009, 19, 265–293.
  63. Bossier, P. Authentication of Seafood Products by DNA Patterns. J. Food Sci. 1999, 64, 189–193.
  64. Ballin, N.Z.; Vogensen, F.K.; Karlsson, A.H. Species determination—Can we detect and quantify meat adulteration? Meat Sci. 2009, 83, 165–174.
  65. Mariani, S.; Bekkevold, D. The nuclear genome: Neutral and adaptive markers in fisheries science. In Stock Identification Methods; Elsevier: Amsterdam, The Netherlands, 2014; pp. 297–327.
  66. Akhatova, D.; Laknerova, I.; Zdenkova, K.; Ólafsdo Ttir, G.; Magnúsdó, S.; Piknova, Ľ.; Kyrova, V.; Lerch, Z.; Hanak, P. International interlaboratory study on TaqMan real-time polymerase chain reaction authentication of black seabream (Spondyliosoma cantharus). J. Food Nutr. Res. 2018, 57, 27–37.
  67. Lee, J.-S. The internally self-fertilizing hermaphroditic teleost Rivulus marmoratus (Cyprinodontiformes, Rivulidae) β-actin gene: Amplification and sequence analysis with conserved primers. Mar. Biotechnol. 2000, 2, 161–166.
  68. Sohn, Y.C.; Kobayashi, M.; Aida, K. Regulation of gonadotropin β subunit gene expression by testosterone and gonadotropin-releasing hormones in the goldfish, Carassius auratus. Comp. Biochem. Physiol. Part B Biochem. Mol. Biol. 2001, 129, 419–426.
  69. Wang, Y.; Ge, W. Gonadotropin regulation of follistatin expression in the cultured ovarian follicle cells of zebrafish, Danio rerio. Gen. Comp. Endocrinol. 2003, 134, 308–315.
  70. Prado, M.; Ortea, I.; Vial, S.; Rivas, J.; Calo-Mata, P.; Barros-Velázquez, J. Advanced DNA-and protein-based methods for the detection and investigation of food allergens. Crit. Rev. Food Sci. Nutr. 2016, 56, 2511–2542.
  71. Paracchini, V.; Petrillo, M.; Lievens, A.; Gallardo, A.P.; Martinsohn, J.T.; Hofherr, J.; Maquet, A.; Silva, A.P.B.; Kagkli, D.M.; Querci, M. Novel nuclear barcode regions for the identification of flatfish species. Food Control 2017, 79, 297–308.
  72. Edwards, A.; Civitello, A.; Hammond, H.A.; Caskey, C.T. DNA typing and genetic mapping with trimeric and tetrameric tandem repeats. Am. J. Hum. Genet. 1991, 49, 746.
  73. Tautz, D. Hypervariability of simple sequences as a general source for polymorphic DNA markers. Nucleic Acids Res. 1989, 17, 6463–6471.
  74. Tóth, G.; Gáspári, Z.; Jurka, J. Microsatellites in different eukaryotic genomes: Survey and analysis. Genome Res. 2000, 10, 967–981.
  75. Litt, M.; Luty, J.A. A hypervariable microsatellite revealed by in vitro amplification of a dinucleotide repeat within the cardiac muscle actin gene. Am. J. Hum. Genet. 1989, 44, 397.
  76. Lauerman, L.H. Advances in PCR technology. Anim. Health Res. Rev. 2004, 5, 247–248.
  77. Rahman, M.T.; Uddin, M.S.; Sultana, R.; Moue, A.; Setu, M. Polymerase chain reaction (PCR): A short review. Anwer Khan Mod. Med. Coll. J. 2013, 4, 30–36.
  78. Kubista, M.; Andrade, J.M.; Bengtsson, M.; Forootan, A.; Jonák, J.; Lind, K.; Sindelka, R.; Sjöback, R.; Sjögreen, B.; Strömbom, L. The real-time polymerase chain reaction. Mol. Asp. Med. 2006, 27, 95–125.
  79. Dingle, T.C.; Sedlak, R.H.; Cook, L.; Jerome, K.R. Tolerance of Droplet-Digital PCR vs Real-Time Quantitative PCR to Inhibitory Substances. Clin. Chem. 2013, 59, 1670–1672.
  80. Fernandes, T.J.; Costa, J.; Oliveira, M.B.P.; Mafra, I. COI barcode-HRM as a novel approach for the discrimination of hake species. Fish. Res. 2018, 197, 50–59.
  81. Fernandes, T.J.; Costa, J.; Oliveira, M.B.P.; Mafra, I. DNA barcoding coupled to HRM analysis as a new and simple tool for the authentication of Gadidae fish species. Food Chem. 2017, 230, 49–57.
  82. Silva, A.J.; Hellberg, R.S. DNA-based techniques for seafood species authentication. In Advances in Food and Nutrition Research; Elsevier: Amsterdam, The Netherlands, 2021; Volume 95, pp. 207–255.
  83. Fernandes, T.J.; Amaral, J.S.; Mafra, I. DNA barcode markers applied to seafood authentication: An updated review. Crit. Rev. Food Sci. Nutr. 2021, 61, 3904–3935.
  84. Druml, B.; Cichna-Markl, M. High resolution melting (HRM) analysis of DNA—Its role and potential in food analysis. Food Chem. 2014, 158, 245–254.
  85. Fernandes, T.J.; Silva, C.R.; Costa, J.; Oliveira, M.B.P.; Mafra, I. High resolution melting analysis of a COI mini-barcode as a new approach for Penaeidae shrimp species discrimination. Food Control 2017, 82, 8–17.
  86. Verrez-Bagnis, V.; Sotelo, C.G.; Mendes, R.; Silva, H.; Kappel, K.; Schröder, U. Methods for seafood authenticity testing in Europe. In Bioactive Molecules in Food; Springer: Berlin/Heidelberg, Germany, 2019; pp. 2063–2117.
  87. Whitford, W.; Hawkins, V.; Moodley, K.S.; Grant, M.J.; Lehnert, K.; Snell, R.G.; Jacobsen, J.C. Proof of concept for multiplex amplicon sequencing for mutation identification using the MinION nanopore sequencer. Sci. Rep. 2022, 12, 8572.
  88. Slatko, B.E.; Gardner, A.F.; Ausubel, F.M. Overview of Next-Generation Sequencing Technologies. Curr. Protoc. Mol. Biol. 2018, 122, e59.
  89. Fakruddin, M.; Chowdhury, A. Pyrosequencing an alternative to traditional Sanger sequencing. Am. J. Biochem. Biotechnol. 2012, 8, 14–20.
  90. Liu, L.; Li, Y.; Li, S.; Hu, N.; He, Y.; Pong, R.; Lin, D.; Lu, L.; Law, M. Comparison of next-generation sequencing systems. J. Biomed. Biotechnol. 2012, 2012, 251364.
  91. Illumina. Sequencing and Array-Based Solutions for Genetic Research. Available online: https://www.illumina.com (accessed on 21 May 2022).
  92. Canadian Agency for Drugs Technologies in Health. Next Generation DNA Sequencing: A Review of the Cost Effectiveness and Guidelines; Canadian Agency for Drugs and Technologies in Health: Ottawa, ON, Canada, 2014; 19p.
  93. Young, A.D.; Gillung, J.P. Phylogenomics—Principles, opportunities and pitfalls of big-data phylogenetics. Syst. Entomol. 2020, 45, 225–247.
  94. Xie, Z.; Yu, C.; Guo, L.; Li, M.; Yong, Z.; Liu, X.; Meng, Z.; Lin, H. Ion Torrent next-generation sequencing reveals the complete mitochondrial genome of black and reddish morphs of the Coral Trout Plectropomus leopardus. Mitochondrial DNA Part A 2016, 27, 609–612.
  95. Adelyna, M.N.; Jung, H.; Chand, V.; Mather, P.; Azizah, M.S. A genome survey sequence (GSS) analysis and microsatellite marker development for Indian mackerel, Rastrelliger kanagurta, using Ion Torrent technology. Meta Gene 2016, 10, 67–72.
  96. De Battisti, C.; Marciano, S.; Magnabosco, C.; Busato, S.; Arcangeli, G.; Cattoli, G. Pyrosequencing as a tool for rapid fish species identification and commercial fraud detection. J. Agric. Food Chem. 2014, 62, 198–205.
  97. Keller, I.; Taverna, A.; Seehausen, O. A pyrosequencing assay for the rapid discrimination of mitochondrial lineages in the Salmo trutta species complex. Mol. Ecol. Resour. 2011, 11, 196–199.
  98. Levsky, J.M.; Singer, R.H. Fluorescence in situ hybridization: Past, present and future. J. Cell Sci. 2003, 116, 2833–2838.
  99. Bayani, J.; Squire, J.A. Fluorescence in situ Hybridization (FISH). Curr. Protoc. Cell Biol. 2004, 23, 22.4.1–22.4.52.
  100. Zhang, J.; Huang, H.; Cai, Z.; Huang, L. Species identification in salted products of red snappers by semi-nested PCR-RFLP based on the mitochondrial 12S rRNA gene sequence. Food Control 2006, 17, 557–563.
  101. Pardo, M.A.; Pérez-Villareal, B. Identification of commercial canned tuna species by restriction site analysis of mitochondrial DNA products obtained by nested primer PCR. Food Chem. 2004, 86, 143–150.
  102. Hayashi, K. PCR-SSCP: A method for detection of mutations. Genet. Anal. Biomol. Eng. 1992, 9, 73–79.
  103. Earley, M.C.; Vogt, R.F., Jr.; Shapiro, H.M.; Mandy, F.F.; Kellar, K.L.; Bellisario, R.; Pass, K.A.; Marti, G.E.; Stewart, C.C.; Hannon, W.H. Report from a workshop on multianalyte microsphere assays. Cytom. (Clin. Cytom.) 2002, 50, 239–242.
  104. Bartlett, S.; Davidson, W. FINS (forensically informative nucleotide sequencing): A procedure for identifying the animal origin of biological specimens. Biotechniques 1992, 12, 408–411.
  105. Espiñeira, M.; Vieites, J.M.; Santaclara, F.J. Development of a genetic method for the identification of salmon, trout, and bream in seafood products by means of PCR–RFLP and FINS methodologies. Eur. Food Res. Technol. 2009, 229, 785–793.
  106. Jérôme, M.; Martinsohn, J.T.; Ortega, D.; Carreau, P.; Verrez-Bagnis, V.R.; Mouchel, O. Toward fish and seafood traceability: Anchovy species determination in fish products by molecular markers and support through a public domain database. J. Agric. Food Chem. 2008, 56, 3460–3469.
  107. Hebert, P.D.; Ratnasingham, S.; De Waard, J.R. Barcoding animal life: Cytochrome c oxidase subunit 1 divergences among closely related species. Proc. R. Soc. Lond. Ser. B Biol. Sci. 2003, 270, S96–S99.
  108. Mueller, S.; Handy, S.M.; Deeds, J.R.; George, G.O.; Broadhead, W.J.; Pugh, S.E.; Garrett, S.D. Development of a COX1 based PCR-RFLP method for fish species identification. Food Control 2015, 55, 39–42.
  109. Hellberg, R.S.; Kawalek, M.D.; Van, K.T.; Shen, Y.; Williams-Hill, D.M. Comparison of DNA extraction and PCR setup methods for use in high-throughput DNA barcoding of fish species. Food Anal. Methods 2014, 7, 1950–1959.
  110. Delrieu-Trottin, E.; Williams, J.T.; Pitassy, D.; Driskell, A.; Hubert, N.; Viviani, J.; Cribb, T.H.; Espiau, B.; Galzin, R.; Kulbicki, M. A DNA barcode reference library of French Polynesian shore fishes. Sci. Data 2019, 6, 114.
  111. Sarmiento-Camacho, S.; Valdez-Moreno, M. DNA barcode identification of commercial fish sold in Mexican markets. Genome 2018, 61, 457–466.
  112. Jin, L.; Yu, J.; Yuan, X.; Du, X. Fish classification using DNA barcode sequences through deep learning method. Symmetry 2021, 13, 1599.
  113. Ward, R.D.; Hanner, R.; Hebert, P.D. The campaign to DNA barcode all fishes, FISH-BOL. J. Fish Biol. 2009, 74, 329–356.
  114. Steinke, D.; Hanner, R. The FISH-BOL collaborators’ protocol. Mitochondrial DNA 2011, 22, 10–14.
  115. Ivanova, N.V.; Zemlak, T.S.; Hanner, R.H.; Hebert, P.D. Universal primer cocktails for fish DNA barcoding. Mol. Ecol. Notes 2007, 7, 544–548.
  116. Li, M.; Zhang, K.Y.-B.; But, P.P.-H.; Shaw, P.-C. Forensically informative nucleotide sequencing (FINS) for the authentication of Chinese medicinal materials. Chin. Med. 2011, 6, 42.
  117. Santaclara, F.J.; Espiñeira, M.; Vieites, J.M. Genetic identification of squids (families Ommastrephidae and Loliginidae) by PCR–RFLP and FINS methodologies. J. Agric. Food Chem. 2007, 55, 9913–9920.
  118. Hellberg, R.S.R.; Morrissey, M.T. Advances in DNA-based techniques for the detection of seafood species substitution on the commercial market. JALA J. Assoc. Lab. Autom. 2011, 16, 308–321.
  119. Sotelo, C.G.; Calo-Mata, P.; Chapela, M.J.; Pérez-Martín, R.I.; Rehbein, H.; Hold, G.L.; Russell, V.J.; Pryde, S.; Quinteiro, J.; Izquierdo, M. Identification of flatfish (Pleuronectiforme) species using DNA-based techniques. J. Agric. Food Chem. 2001, 49, 4562–4569.
  120. Notomi, T.; Mori, Y.; Tomita, N.; Kanda, H. Loop-mediated isothermal amplification (LAMP): Principle, features, and future prospects. J. Microbiol. 2015, 53, 1–5.
  121. Liu, Z.J.; Cordes, J. DNA marker technologies and their applications in aquaculture genetics. Aquaculture 2004, 238, 1–37.
  122. Rehbein, H.; Kress, G.; Schmidt, T. Application of PCR-SSCP to species identification of fishery products. J. Sci. Food Agric. 1997, 74, 35–41.
  123. Lockley, A.; Bardsley, R. DNA-based methods for food authentication. Trends Food Sci. Technol. 2000, 11, 67–77.
  124. Mackie, I.; Pryde, S.E.; Gonzales-Sotelo, C.; Medina, I.; Pérez-Martın, R.; Quinteiro, J.; Rey-Mendez, M.; Rehbein, H. Challenges in the identification of species of canned fish. Trends Food Sci. Technol. 1999, 10, 9–14.
  125. Čížková, H. Falšování Potravin; Verlag Dashöfer: Hamburg, Germany, 2019.
  126. Chiesa, L.M.; Pavlovic, R.; Nobile, M.; Di Cesare, F.; Malandra, R.; Pessina, D.; Panseri, S. Discrimination between Fresh and Frozen-Thawed Fish Involved in Food Safety and Fraud Protection. Foods 2020, 9, 1896.
  127. Monteiro, C.S.; Deconinck, D.; Eljasik, P.; Sobczak, M.; Derycke, S.; Panicz, R.; Kane, N.; Mazloomrezaei, M.; Devlin, R.; Faria, M.A. A fast HRMA tool to authenticate eight salmonid species in commercial food products. Food Chem. Toxicol. 2021, 156, 112440.
  128. Chen, C.-H.; Hsieh, C.-H.; Hwang, D.-F. Species identification of Cyprinidae fish in Taiwan by FINS and PCR–RFLP analysis. Food Control 2012, 28, 240–245.
  129. Wang, Y.; Hamid, N.; Jia, P.P.; Pei, D.S. A comprehensive review on genetically modified fish: Key techniques, applications and future prospects. Rev. Aquac. 2021, 13, 1635–1660.
  130. Maclean, N.; Talwar, S. Injection of cloned genes into rainbow trout eggs. J. Embryol. Exp. Morphol. 1984, 82, 187–200.
  131. Debode, F.; Marien, A.; Ledoux, Q.; Janssen, E.; Ancion, C.; Berben, G. Detection of ornamental transgenic fish by real-time PCR and fluorescence microscopy. Transgenic Res. 2020, 29, 283–294.
  132. Gong, Z.; Ju, B.; Wan, H. Green fluorescent protein (GFP) transgenic fish and their applications. Genetica 2001, 111, 213–225.
  133. Tonelli, F.M.; Lacerda, S.M.; Tonelli, F.C.; Costa, G.M.; de Franca, L.R.; Resende, R.R. Progress and biotechnological prospects in fish transgenesis. Biotechnol. Adv. 2017, 35, 832–844.
  134. Green, D.P. Genetically Engineered Salmon Approved for Food by US FDA. J. Aquat. Food Prod. Technol. 2016, 25, 145–146.
  135. Debode, F.; Janssen, E.; Marien, A.; Devlin, R.H.; Lieske, K.; Mankertz, J.; Berben, G. Detection of transgenic Atlantic and Coho salmon by real-time PCR. Food Anal. Methods 2018, 11, 2396–2406.
  136. Masri, S.; Rast, H.; Ripley, T.; James, D.; Green, M.; Jia, X.; Devlin, R.H. Detection of genetically modified coho salmon using polymerase chain reaction (PCR) amplification. J. Agric. Food Chem. 2002, 50, 3161–3164.
  137. Hafsa, A.B.; Nabi, N.; Zellama, M.S.; Said, K.; Chaouachi, M. A new specific reference gene based on growth hormone gene (GH1) used for detection and relative quantification of Aquadvantage® GM salmon (Salmo salar L.) in food products. Food Chem. 2016, 190, 1040–1045.
  138. Kishimoto, K.; Washio, Y.; Yoshiura, Y.; Toyoda, A.; Ueno, T.; Fukuyama, H.; Kato, K.; Kinoshita, M. Production of a breed of red sea bream Pagrus major with an increase of skeletal muscle mass and reduced body length by genome editing with CRISPR/Cas9. Aquaculture 2018, 495, 415–427.
  139. Hallerman, E. Genome editing in cultured fishes. CABI Agric. Biosci. 2021, 2, 46.
More
Information
Contributors MDPI registered users' name will be linked to their SciProfiles pages. To register with us, please refer to https://encyclopedia.pub/register : , , , , , ,
View Times: 1.5K
Revisions: 3 times (View History)
Update Date: 20 Feb 2023
1000/1000