Your browser does not fully support modern features. Please upgrade for a smoother experience.

Submitted Successfully!
Thank you for your contribution! You can also upload a video entry or images related to this topic.
For video creation, please contact our Academic Video Service.
| Version | Summary | Created by | Modification | Content Size | Created at | Operation |
|---|---|---|---|---|---|---|
| 1 | Dingchen Wu | -- | 1061 | 2022-12-07 14:08:58 | | | |
| 2 | Camila Xu | + 7 word(s) | 1068 | 2022-12-08 01:27:26 | | |
Video Upload Options
We provide professional Academic Video Service to translate complex research into visually appealing presentations. Would you like to try it?
Cite
If you have any further questions, please contact Encyclopedia Editorial Office.
Wu, D.; Wei, M.; Tian, R.; Zheng, S.; He, J. Supercritical Carbon Dioxide Flow and Heat Transfer Characteristics. Encyclopedia. Available online: https://encyclopedia.pub/entry/38206 (accessed on 08 February 2026).
Wu D, Wei M, Tian R, Zheng S, He J. Supercritical Carbon Dioxide Flow and Heat Transfer Characteristics. Encyclopedia. Available at: https://encyclopedia.pub/entry/38206. Accessed February 08, 2026.
Wu, Dingchen, Mingshan Wei, Ran Tian, Siyu Zheng, Jundi He. "Supercritical Carbon Dioxide Flow and Heat Transfer Characteristics" Encyclopedia, https://encyclopedia.pub/entry/38206 (accessed February 08, 2026).
Wu, D., Wei, M., Tian, R., Zheng, S., & He, J. (2022, December 07). Supercritical Carbon Dioxide Flow and Heat Transfer Characteristics. In Encyclopedia. https://encyclopedia.pub/entry/38206
Wu, Dingchen, et al. "Supercritical Carbon Dioxide Flow and Heat Transfer Characteristics." Encyclopedia. Web. 07 December, 2022.
Copy Citation
Supercritical carbon dioxide (SCO2) is widely used in many fields of energy and power engineering, such as nuclear reactors, solar thermal power generation systems, and refrigeration systems. In practical applications, SCO2 undergoes a cooling process significantly when it is cooled near the pseudo–critical point.
cooling condition
cooler/condenser
heat transfer enhancement/deterioration
1. Introduction
In recent years, with the growing concern about the environment and climate change, new environmentally friendly and low–carbon technologies or technologies that can utilize renewable energy have been widely developed [1]. Carbon dioxide is a safe, nontoxic, nonflammable, economical, and resource–rich natural working medium widely applied in energy systems. It can be used as a refrigerant for refrigeration systems [2], air conditioners [3], heat pumps [4], and other devices in a trans–critical state [5], as well as an adequate working fluid for systems such as thermal power plants [6], advanced nuclear reactors [7], waste heat recovery [8], and solar thermal power generation [9]. In these systems and cycles, the condensers or coolers undergo a supercritical heat transfer process, which plays an essential role in cycle efficiency. Therefore, the study of supercritical cooling heat transfer process is very important for the design of a supercritical heat exchanger [10].
Reviews of the SCO2 have been carried out by scholars. Duffey and Pioro [11] performed a comprehensive review of SCO2 flows in horizontal, vertical, and other geometrical tubes. Three modes of heat transfer were proposed in this research, namely normal heat transfer (NHT), heat transfer deterioration (HTD), and heat transfer enhancement (HTE), and they were defined by the expected heat transfer coefficient values. Cabeza et al. [12], Fang et al. [13], Huang et al. [14], and Cheng et al. [15] performed comprehensive review works on the experimental data of SCO2 heat transfer and pressure drop characteristics. Rao et al. [16], Li et al. [17], and Ehsan et al. [18] conducted a detailed review of heat transfer characteristics, correlations, and the effects of different operating parameters with SCO2 under heating and cooling conditions of channels and tubes. Wang et al. [19] reviewed the simulation techniques used in turbulent SCO2 flow and discussed their advantages, shortcomings, and applicability. In addition, the research on heat transfer deterioration in vertical tubes [20] and the judgment of buoyancy criteria [21] were also reviewed.
2. Thermal–Physical Properties of SCO2
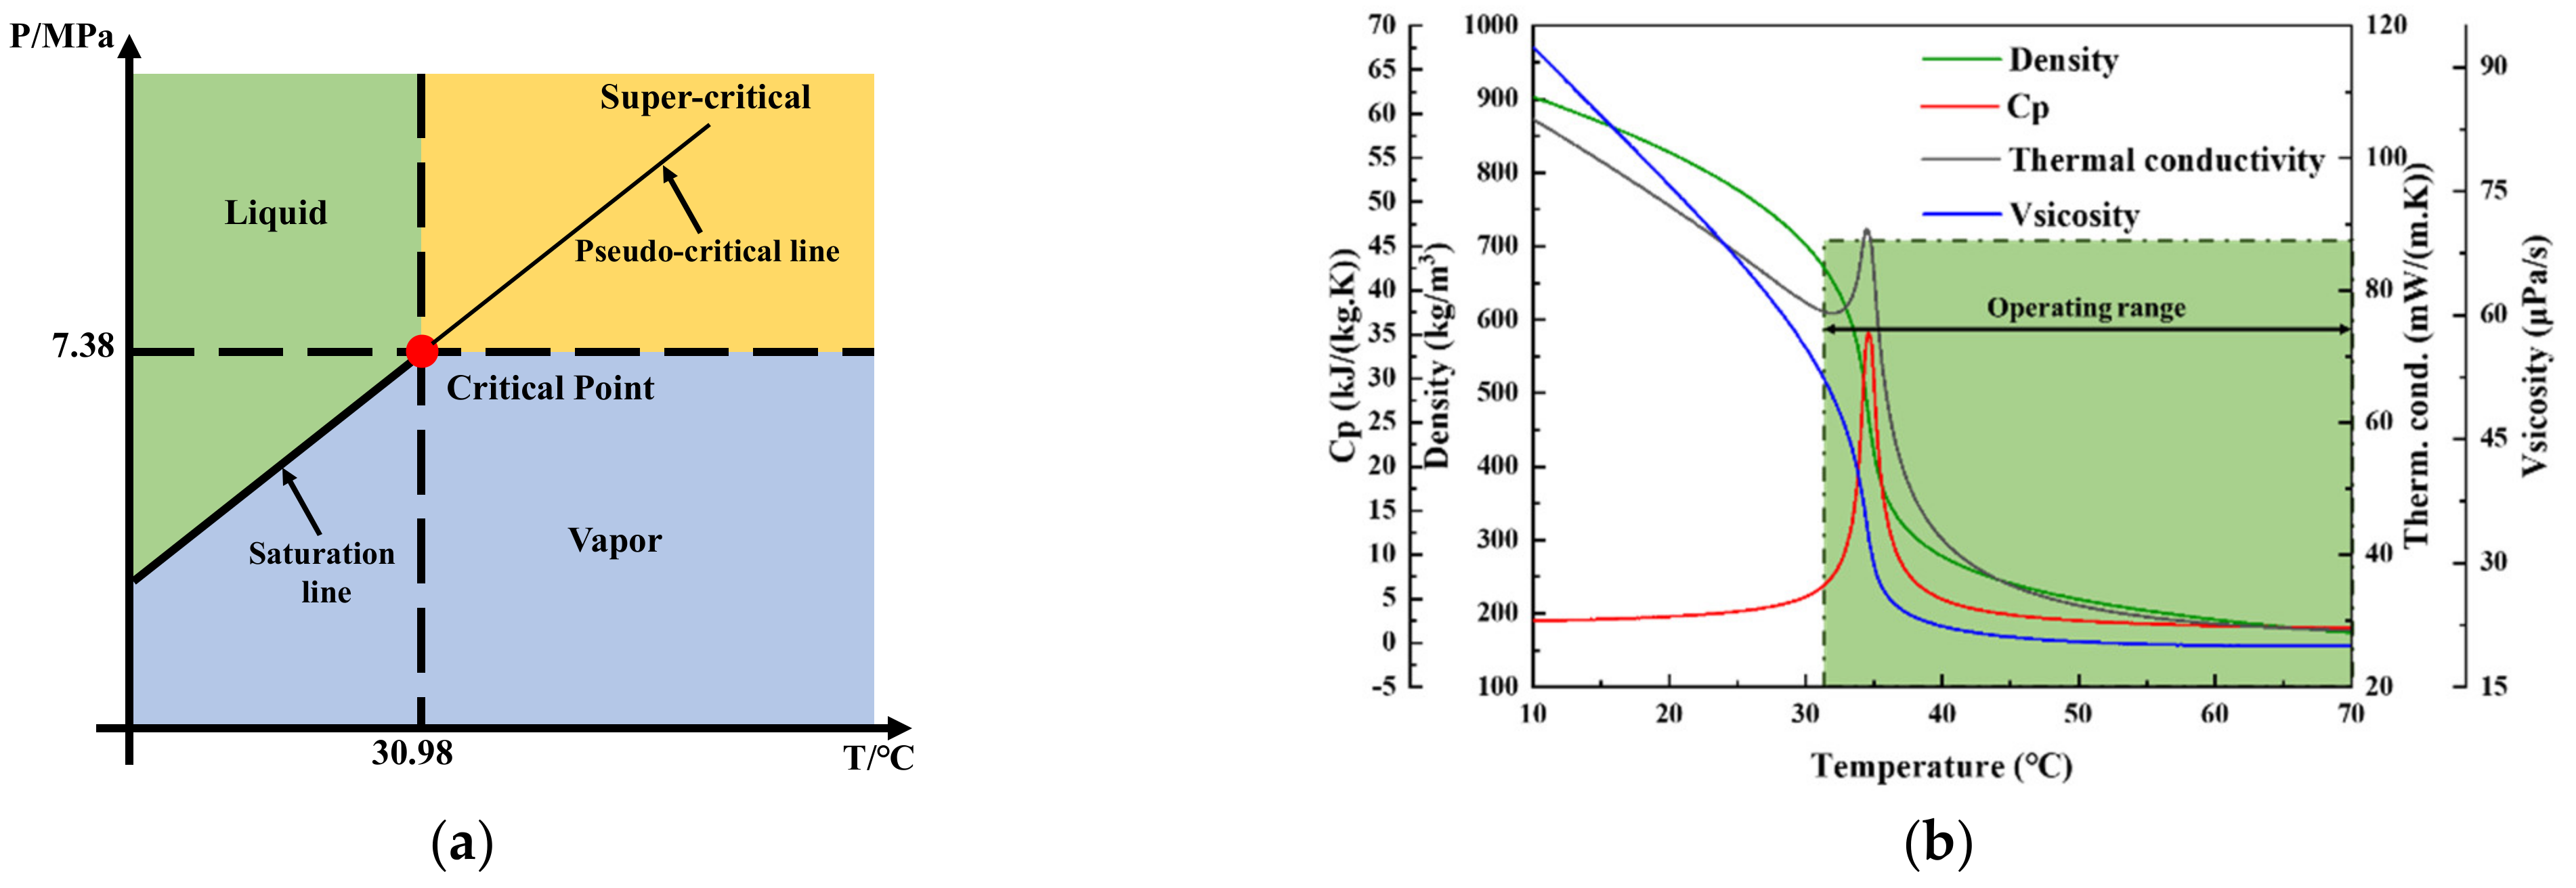
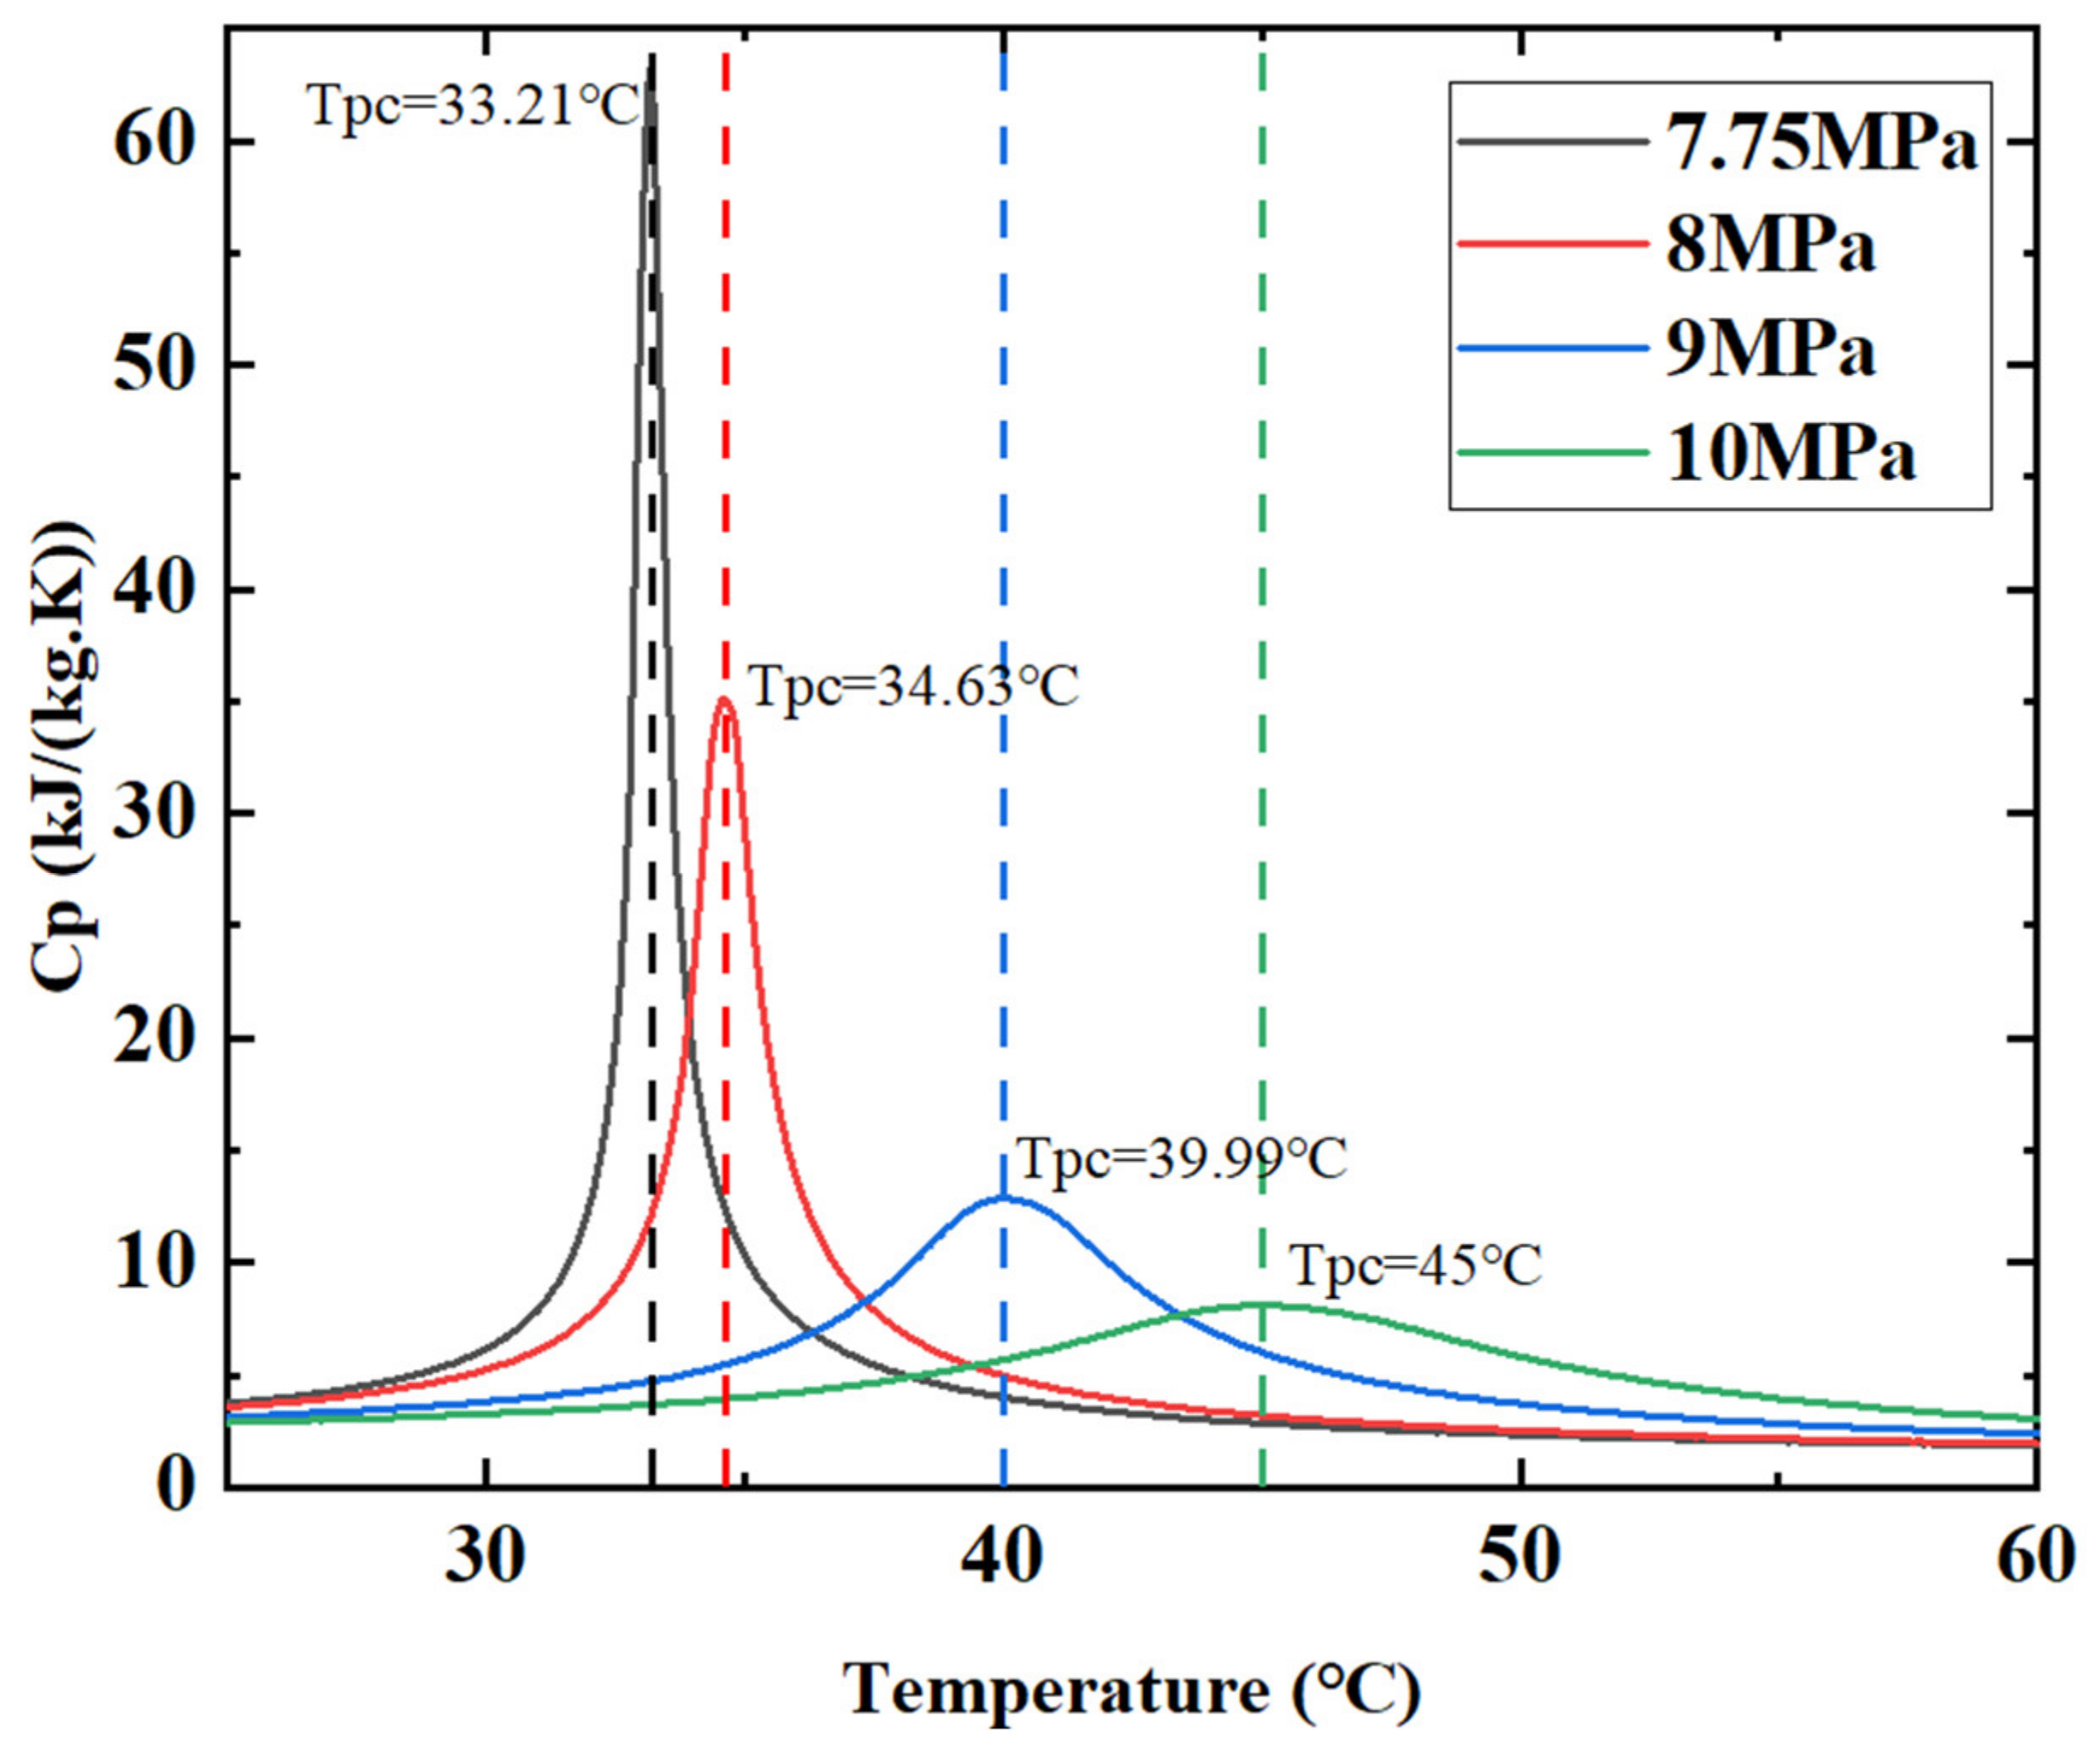
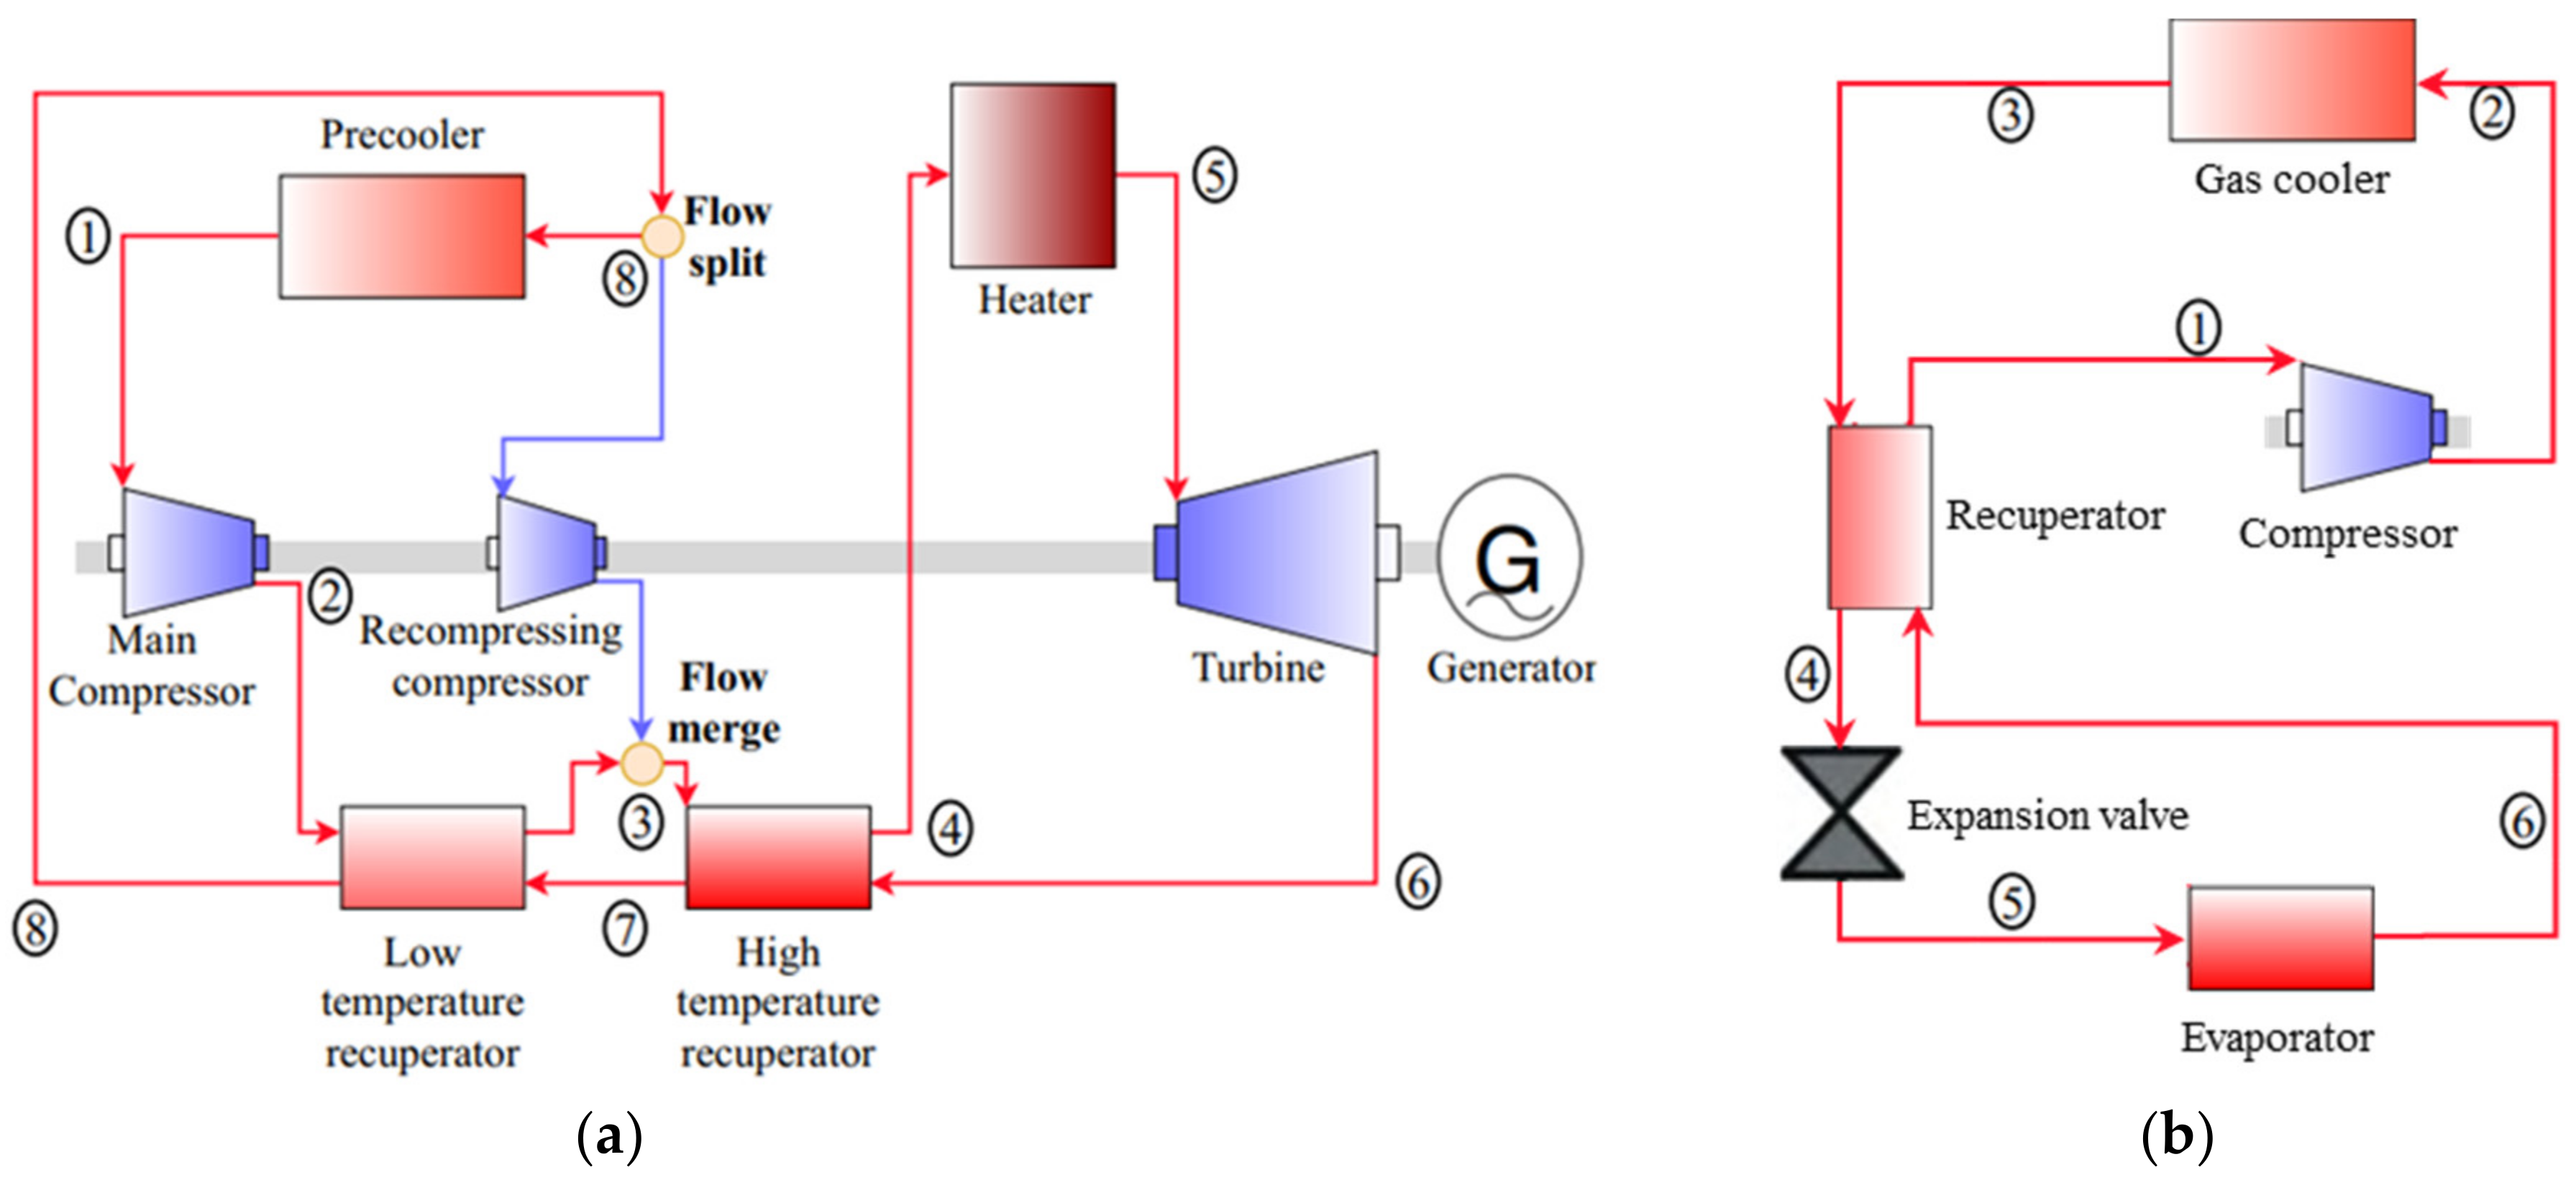
Supercritical fluid is a type of fluid that reaches or exceeds the critical temperature and pressure. Liquids and gases enter the supercritical stage when heated above the critical temperature Tc and compressed above the critical pressure Pc. Above the critical temperature (Tc = 30.98 °C) and critical pressure (Pc = 7.38 MPa), CO2 goes into the supercritical state. Working in this state, CO2 does not undergo a phase transition (Figure 1a). Thermo–physical parameters of SCO2, e.g., the density and dynamic viscosity, change dramatically when approaching the critical point, as shown in Figure 1b. This is the notable feature of SCO2 compared to constant–property fluids. The isobaric–specific heat of SCO2 peaks at the pseudo–critical temperature (Tpc). The rapid and nonlinear changes in the specific heat of SCO2 against the temperature at several supercritical pressures are shown in Figure 2. The pseudo–critical temperature Tpc of SCO2 increases when the working pressure increases. Far from the critical point, however, the change has been less pronounced. When SCO2 is cooling, the initial performance change is small and, when the temperature reaches the Tpc, the performance changes drastically. As the working pressure approaches Pc, the specific heat peak becomes sharper, which makes the heat transfer coefficient increase significantly. Compared with supercritical water, SCO2 is more suitable as a heat transfer fluid because of its lower critical parameters and lower specific volume values. In a typical SCO2 recompression Brayton cycle, as shown in Figure 3a, the cooling process 8–1 makes the density and specific heat of CO2 increase rapidly during cooling near Tc, causing the compressor to deliver a high–density fluid. Therefore, the compression of the high–density fluid by the compressor reduces power consumption and improves the overall thermal performance of the cycle. In the trans–critical CO2 cycle, process 2–3 in Figure 3b is also the cooling process above the Pc, and the heat transfer process at this stage will affect the performance of the whole cycle. Tpc can be written and calculated as an algebraic function of the working pressure. The unit of working pressure is bar and the unit of result temperature is Celsius [22].

Figure 1. CO2 p–T diagram (a) and variation in thermo–physical properties for SCO2 in 8 MPa (b).

Figure 2. Variation in heat capacity for SCO2 with pressure and temperature.

Figure 3. Schematic diagram of a typical SCO2 recompression Brayton cycle (a) and a trans–critical CO2 cycle (b).
3. Flow and Heat Transfer Characteristics of Supercritical Carbon Dioxide under Cooling Conditions in Energy and Power Systems
The effects of parameters such as mass flow, pressure, pipe diameter, and buoyancy on flow heat transfer under different channel types have been studied in experiments—the heat transfer coefficient increases as the flow rate increases under cooling conditions. The thermo–physical properties of SCO2 change drastically near the pseudo–critical point and, the closer to the critical point, the larger the peak value of physical property change. The heat transfer coefficient reaches a more significant peak value in the pseudo–critical region when the operating pressure is close to Pc. Nu decreases with the decrease in tube diameter. The pressure drop exhibits a trend consistent with the heat transfer coefficient.
In terms of numerical research, most simulation works were based on the commercial software FLUENT or CFX. Detailed velocity, temperature, and turbulence distribution information under different channel types were obtained, and unique phenomena, such as secondary flow and changes in buoyancy along the flow process, were analyzed. However, the RANS model cannot give reliable results quantitatively, and the performance of the same RANS model under different operating conditions varies greatly. Therefore, it is not easy to achieve model generality. Although DNS can only be carried out at low Re at present, it can study the unsteady flow characteristics of SCO2 turbulent flow with strong buoyancy in the tubes and create a database for establishing new turbulence models.
A large number of heat transfer correlations have been established. These correlations are fairly predictable within their corresponding parameter ranges but, so far, there is no general correlation that can be used for the entire SCO2 cooling operating range. Establishing a general correlation requires a clearer understanding of the SCO2 cooling process.
References
- Tafur-Escanta, P.; Valencia-Chapi, R.; López-Guillem, M.; Fierros-Peraza, O.; Muñoz-Antón, J. Electrical energy storage using a supercritical CO2 heat pump. Energy Rep. 2022, 8, 502–507.
- Muhammad, H.A.; Cho, J.; Cho, J.; Choi, B.; Roh, C.; Ishfaq, H.A.; Lee, G.; Shin, H.; Baik, Y.-J.; Lee, B. Performance improvement of supercritical carbon dioxide power cycle at elevated heat sink temperatures. Energy 2022, 239, 122216.
- Han, S.H.; Choi, Y.D.; Shin, J.K.; Kim, Y.C.; Kim, M.S. Turbulent heat transfer of supercritical carbon dioxide in square cross–sectional duct flow. J. Mech. Sci. Technol. 2008, 22, 2563–2577.
- Zamengo, M.; Yoshida, K.; Morikawa, J. Numerical evaluation of a Carnot battery system comprising a chemical heat storage/pump and a Brayton cycle. J. Energy Storage 2021, 41, 102955.
- Bianchi, G.; Besagni, G.; Tassou, S.A.; Markides, C.N. Overview and outlook of research and innovation in energy systems with carbon dioxide as the working fluid. Appl. Therm. Eng. 2021, 195, 117180.
- He, F.; Liu, X.; Wang, M.; Zhou, S.; Heydarian, D. Energy, exergy, exergoeconomic, and environmental analyses and multi–objective optimization of a biomass–to–energy integrated thermal power plant. Alex. Eng. J. 2022, 61, 5629–5648.
- Fan, G.; Du, Y.; Li, H.; Dai, Y. Off–design behavior investigation of the combined supercritical CO2 and organic Rankine cycle. Energy 2021, 237, 121529.
- Zhao, Z.; Shi, X.; Zhang, M.; Ouyang, T. Multi–scale assessment and multi–objective optimization of a novel solid oxide fuel cell hybrid power system fed by bio–syngas. J. Power Sources 2022, 524, 231047.
- Cao, Y.; Li, P.; Qiao, Z.; Ren, S.; Si, F. A concept of a supercritical CO2 Brayton and organic Rankine combined cycle for solar energy utilization with typical geothermal as auxiliary heat source: Thermodynamic analysis and optimization. Energy Rep. 2022, 8, 322–333.
- Baik, S.; Kim, S.G.; Lee, J.; Lee, J.I. Study on CO2—Water printed circuit heat exchanger performance operating under various CO2 phases for S–CO2 power cycle application. Appl. Therm. Eng. 2017, 113, 1536–1546.
- Duffey, R.B.; Pioro, I.L. Experimental heat transfer of supercritical carbon dioxide flowing inside channels (survey). Nucl. Eng. Des. 2005, 235, 913–924.
- Cabeza, L.F.; de Gracia, A.; Fernández, A.I.; Farid, M.M. Supercritical CO2 as heat transfer fluid: A review. Appl. Therm. Eng. 2017, 125, 799–810.
- Fang, X.; Xu, Y.; Su, X.; Shi, R. Pressure drop and friction factor correlations of supercritical flow. Nucl. Eng. Des. 2012, 242, 323–330.
- Huang, D.; Wu, Z.; Sunden, B.; Li, W. A brief review on convection heat transfer of fluids at supercritical pressures in tubes and the recent progress. Appl. Energy 2016, 162, 494–505.
- Cheng, L.; Ribatski, G.; Thome, J.R. Analysis of supercritical CO2 cooling in macro– and micro–channels. Int. J. Refrig. 2008, 31, 1301–1316.
- Rao, N.T.; Oumer, A.N.; Jamaludin, U.K. State–of–the–art on flow and heat transfer characteristics of supercritical CO2 in various channels. J. Supercrit. Fluids 2016, 116, 132–147.
- Li, W.; Yu, Z. Heat exchangers for cooling supercritical carbon dioxide and heat transfer enhancement: A review and assessment. Energy Rep. 2021, 7, 4085–4105.
- Ehsan, M.M.; Guan, Z.; Klimenko, A.Y. A comprehensive review on heat transfer and pressure drop characteristics and correlations with supercritical CO2 under heating and cooling applications. Renew. Sustain. Energy Rev. 2018, 92, 658–675.
- Wang, J.; Guan, Z.; Gurgenci, H.; Sun, Y.; Hooman, K. A comprehensive review on numerical approaches to simulate heat transfer of turbulent supercritical CO2 flows. Numer. Heat Transf. Part B Fundam. 2020, 77, 349–400.
- Xie, J.; Liu, D.; Yan, H.; Xie, G.; Boetcher, S.K.S. A review of heat transfer deterioration of supercritical carbon dioxide flowing in vertical tubes: Heat transfer behaviors, identification methods, critical heat fluxes, and heat transfer correlations. Int. J. Heat Mass Transf. 2020, 149, 119223.
- Huang, D.; Li, W. A brief review on the buoyancy criteria for supercritical fluids. Appl. Therm. Eng. 2018, 131, 977–987.
- Liao, S.M.; Zhao, T.S. Measurements of Heat Transfer Coefficients from Supercritical Carbon Dioxide Flowing in Horizontal Mini/Micro Channels. J. Heat Transf. 2002, 124, 413–420.
More
Information
Subjects:
Engineering, Mechanical
Contributors
MDPI registered users' name will be linked to their SciProfiles pages. To register with us, please refer to https://encyclopedia.pub/register
:
View Times:
3.6K
Revisions:
2 times
(View History)
Update Date:
08 Dec 2022
Notice
You are not a member of the advisory board for this topic. If you want to update advisory board member profile, please contact office@encyclopedia.pub.
OK
Confirm
Only members of the Encyclopedia advisory board for this topic are allowed to note entries. Would you like to become an advisory board member of the Encyclopedia?
Yes
No
${ textCharacter }/${ maxCharacter }
Submit
Cancel
Back
Comments
${ item }
|
More
No more~
There is no comment~
${ textCharacter }/${ maxCharacter }
Submit
Cancel
${ selectedItem.replyTextCharacter }/${ selectedItem.replyMaxCharacter }
Submit
Cancel
Confirm
Are you sure to Delete?
Yes
No


