 +1 credit
| Version | Summary | Created by | Modification | Content Size | Created at | Operation |
|---|---|---|---|---|---|---|
| 1 | Aurora Savino | + 2092 word(s) | 2092 | 2020-12-17 06:44:51 | | | |
| 2 | Vicky Zhou | Meta information modification | 2092 | 2020-12-18 03:18:56 | | |
Video Upload Options
Biological systems respond to perturbations through the rewiring of molecular interactions, organised in gene regulatory networks (GRNs). Among these, the increasingly high availability of transcriptomic data makes gene co-expression networks the most exploited ones. Differential co-expression networks are useful tools to identify changes in response to an external perturbation, such as mutations predisposing to cancer development, and leading to changes in the activity of gene expression regulators or signalling. They can help explain the robustness of cancer cells to perturbations and identify promising candidates for targeted therapy, moreover providing higher specificity with respect to standard co-expression methods.
1. Introduction: Biological Networks
Biological systems are complex in nature, their behaviour being governed by the interactions of many molecular components (e.g., coding and non-coding RNAs, proteins), through several regulatory layers [1] (e.g., promoter binding, miRNA–mRNA interaction, post-translational modifications). Cancer is no exception, being the result of multiple perturbations within a single cell that also affect cell–cell and cell–microenvironment communication. Each perturbation does not act in isolation but is influenced and in turn influences the whole system, with reciprocal relationships occurring between most components [2].
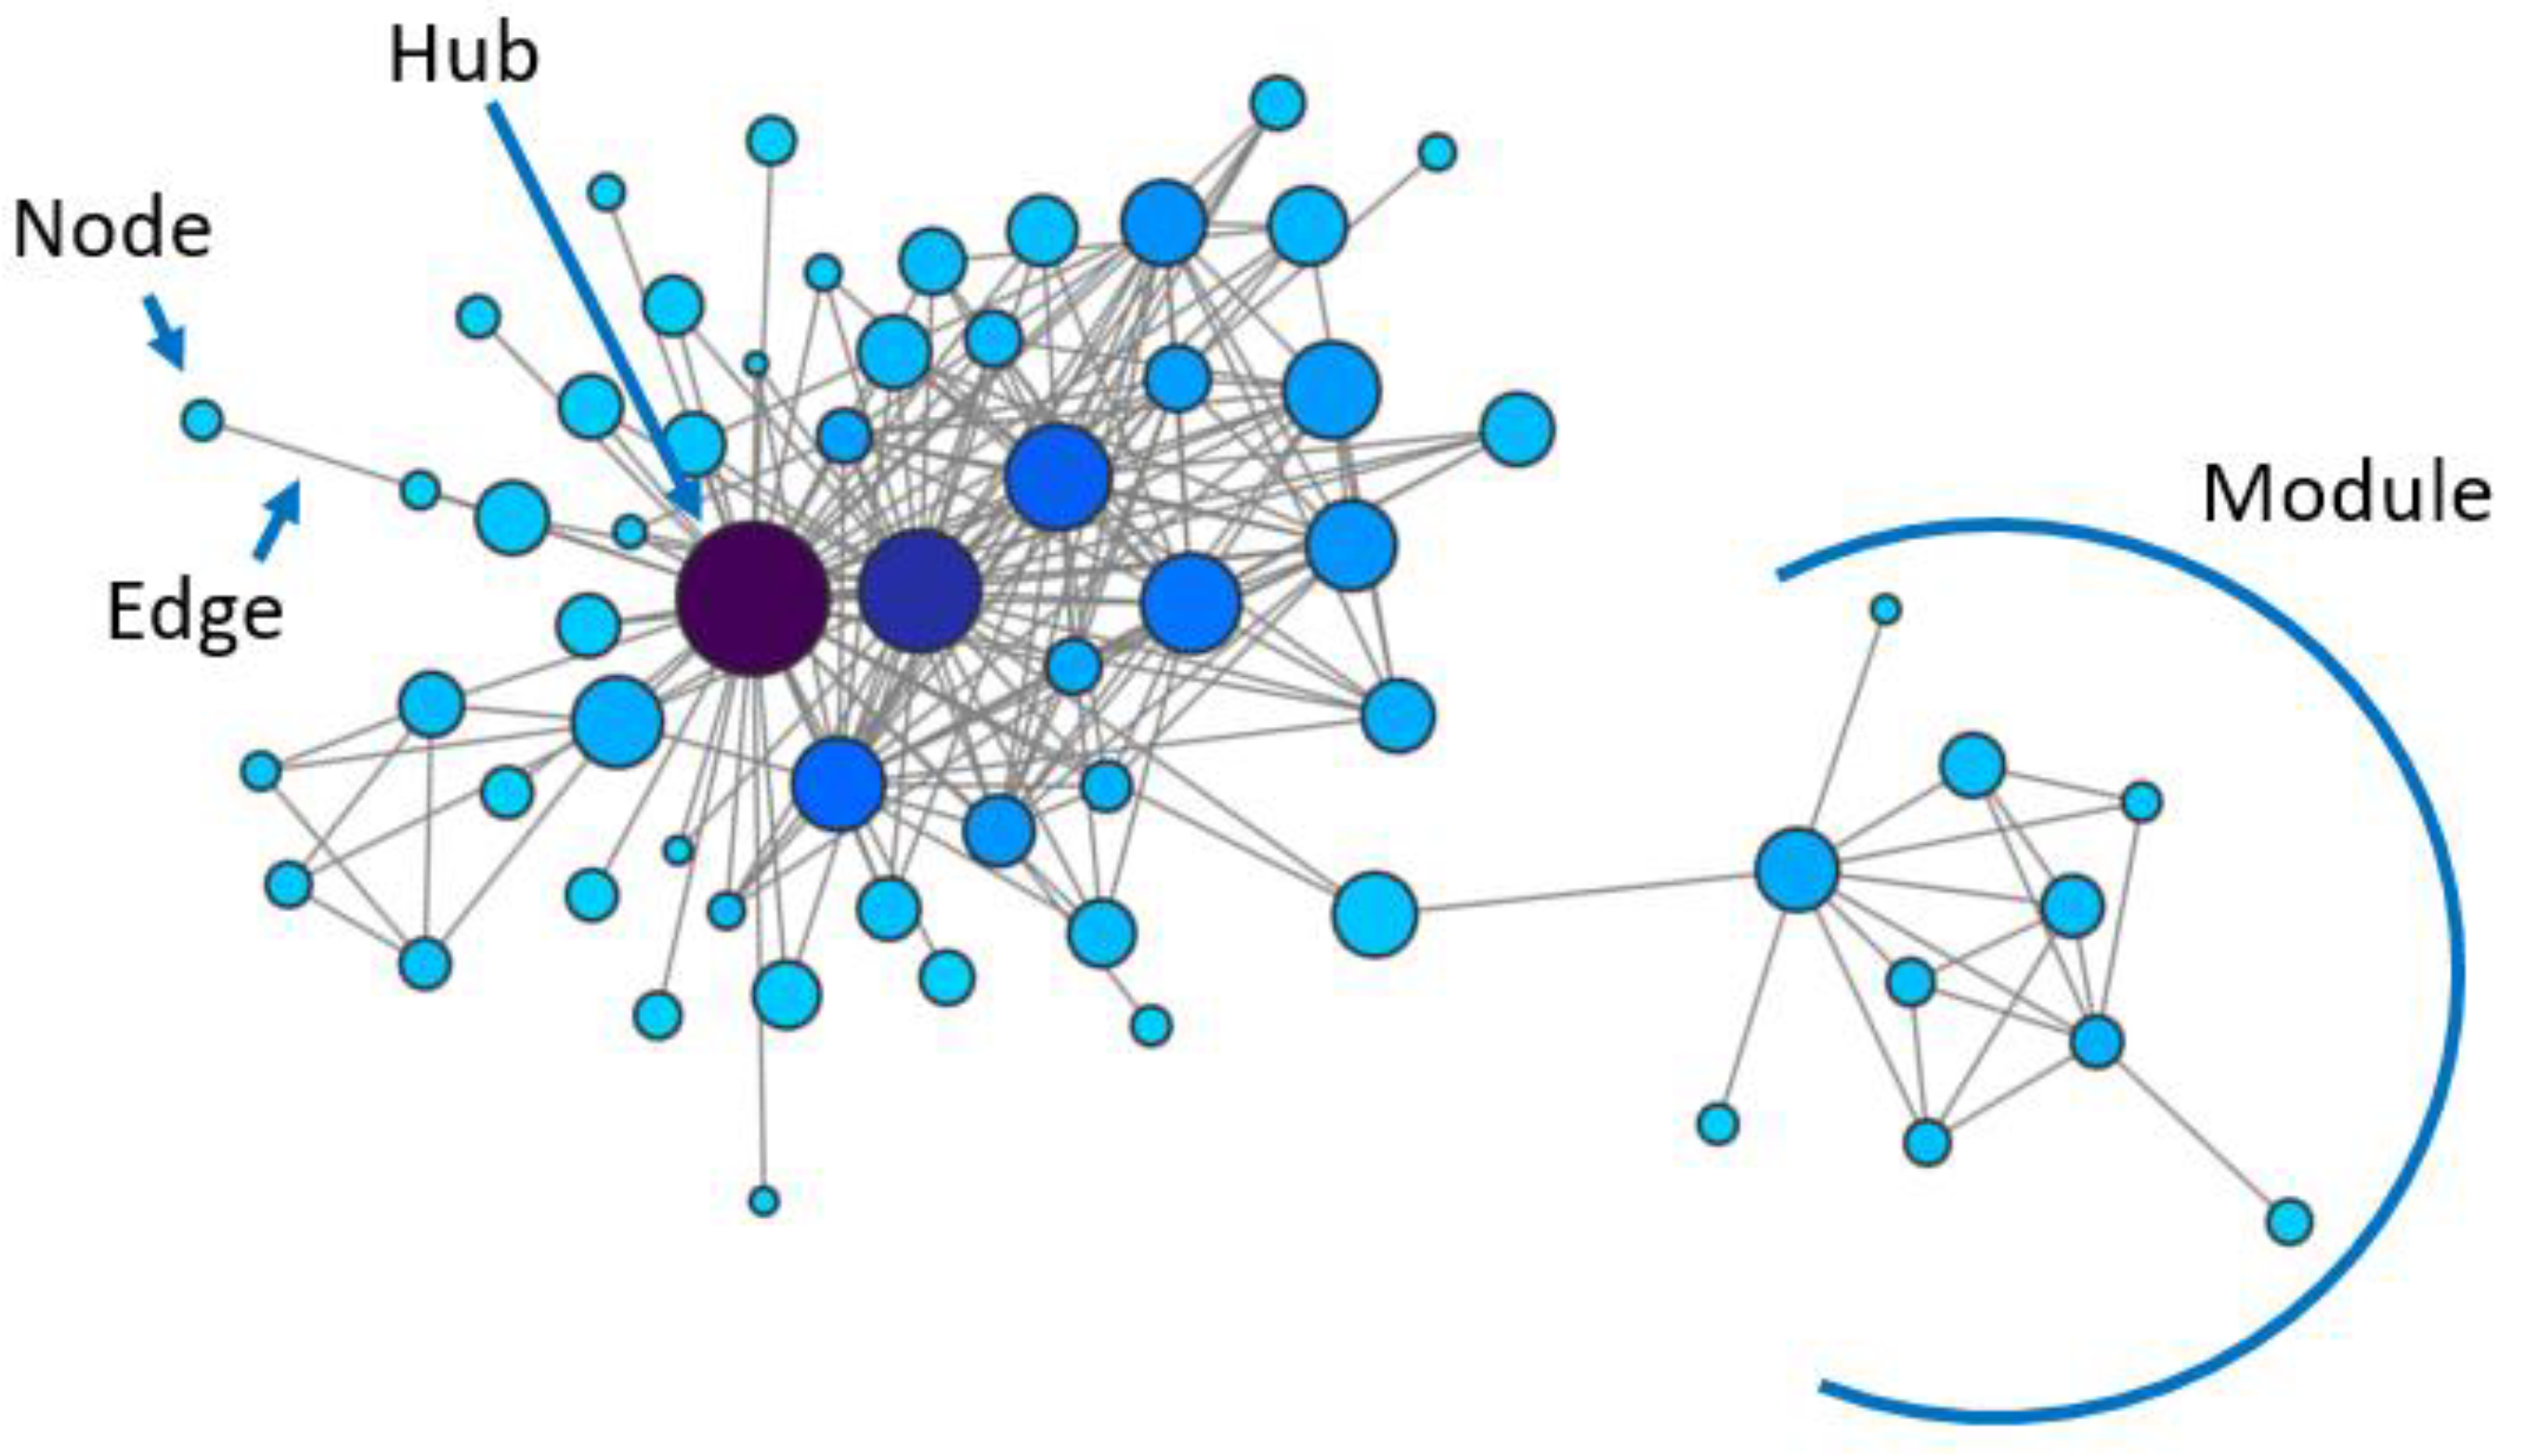
Therefore, accurately depicting a biological system such as a cancer cell requires knowledge about elements’ interactions, and in particular about the regulatory layer described as gene regulatory networks (GRNs). Gene regulatory networks, like all biological networks, represent biological components as nodes and their interactions, either physical or functional, as edges (Figure 1). GRNs are the ideal reconstruction of interactions between genetic elements, comprising the activity of transcription factors (TFs) on their targets’ expression, post-translational modifications influencing a protein’s impact on other elements of the network, epigenetic modifications altering transcription and many additional levels of regulation. While the overall goal of most biological network studies is the inference of GRNs, this is a complex and laborious task that is generally approached by setting some simplifying assumptions and by analysing one kind of relationship at a time, based on physical or other kinds of interactions, as described below.
One caveat is that, despite the general assumption that physical or genetic interactions indicate shared functions or belonging to the same molecular pathway(s), this is not necessarily true, since the information used for edges’ inference is not a direct measure of a functional relationship. Moreover, each network type estimates only part of the overall GRN structure (e.g., transcriptional regulation, protein–protein interactions), losing the information hidden to the specific data type used for its construction, which could be revealed by combining the results obtained with additional data sources.
The most frequently studied biological networks based on physical interactions are protein–protein interaction (PPI) networks, where nodes are proteins and links indicate direct binding, but the binding of a TF to its targets’ promoters can also be represented in a network. A particular type of biological network is pathways, curated and deposited in repositories such as KEGG (Kyoto Encyclopedia of Genes and Genomes) [3], where nodes can be either proteins or small molecules and edges indicate a variety of interactions, among which are enzymatic reactions. Genetic interactions such as synthetic lethal interactions can also be studied as networks [4], assuming them to indicate that the two genes belong to the same pathway. Additionally, methods have been developed to build a variety of biological networks based on metabolic, single nucleotide polymorphisms (SNPs) and phenotypic data (reviewed in [5]).
High-throughput gene expression assays are often used to infer functional relationships between genes from correlations between their expression levels, building the so-called gene co-expression networks (Figure 1). The potential relevance of this method to estimate GRNs is supported by the knowledge that genes with similar transcriptional expression profiles are likely to be regulated through the same mechanisms and to participate in the same functions, or to physically interact [6][7][8][9]. This information can also be combined with other information such as, for example, transcription factor binding and/or PPIs, to obtain a more complete and accurate representation of molecular elements’ interrelationships [10]. Specific open-access databases have been created to store physical and functional networks.
2. Differential Co-Expression Networks in Cancer
2.1. Global Topological Features of Cancer Networks Show Increasingly High Entropy
From the analysis of topological differences between cancer and normal tissue co-expression networks, some general principles have emerged. In particular, network entropy (disorder), measured with different metrics, has been shown to increase in cancer [11][12][13], paralleling an overall decreased connectivity [14]. Interestingly, entropy is even higher in tumours that metastasise, at least in the breast [15]. This observation may help in explaining the underlying principles of cancer adaptability and resistance to perturbations, such as treatments with drugs and hypoxia. In fact, the entropy is correlated with the system’s robustness [16]. In line with this idea, cancer cell lines resistant to three different tyrosine kinase inhibitors have been shown to display higher network entropy than their sensitive counterparts [17]. This could be interpreted as cancer displaying a higher number of interconnections and possible regulatory relationships for each gene, which makes the whole network resistant to single nodes’ and edges’ disruptions. Moreover, the relationship between entropy and robustness can inform about promising drug targets, represented by low-entropy genes [11][18]; interestingly, entropy usually decreases for up-regulated genes in a cancer’s networks [11]. A second important concept arising from these studies is the differential usage of nodes and edges in cancer: a cancer’s networks tend to be less hub dependent, displaying signalling shortcuts in comparison with normal tissues [19][20]. These features, observed in 13 different cancer types, are suggestive of facilitated crosstalk between biological processes that are usually not interconnected, again supporting a higher robustness of cancer networks.
Although both higher entropy and connectivity between pathways can be interpreted as a weakening of tight regulatory rules, improving tumour adaptability, they could also reflect higher cellular heterogeneity. This idea has been confirmed by Park et al. [21], who assessed network entropy related to cells’ heterogeneity and the number of subclones, making use of single-cell data, tumour purity estimates and clonal evolution in xenograft models. Additionally, signalling entropy has been shown to be an estimate for tumour stemness [22], and to be a prognostic measure across several epithelial cancers.
Interpreting network entropy as linked with tumour heterogeneity would help in explaining why it often decreases in cancer at advanced stages [17], confirmed by the observation that initial tumour heterogeneity is subsequently reduced by clonal selection and expansion in the process of metastasis [23].
2.2. Pathways Dysregulated in Cancer
The detection of co-expression modules has been widely applied to retrieve gene categories relevant to cancer, identifying modules shared across cancer types [24]. Nevertheless, condition-specific modules detected through differential co-expression allow the study of features characterising, for example, a disease state or different stages of the same disease, and have been shown to outperform single-condition co-expression modules in identifying characterising features of the studied biological system [25]. The analysis of the differential co-regulation of groups of genes (modules or pathways) has been carried out either exclusively using unbiased network properties or feeding prior knowledge-related gene lists to the network structure. This latter approach, despite its higher robustness and interpretability, has been employed only in a few studies [26][27][28][29][30] and needs to be better explored, while the unbiased analysis has also been amply applied to cancer, as described thoroughly below.
DC modules in cancer biology have been applied to the comparison of tumour and normal tissue, identifying tumour-specific modules in hepatocellular carcinoma, uveal melanoma and ovarian and prostate cancer [31][32][33]. In 12 cancer types, cancer-specific modules were shown to have prognostic value [34], while three independent studies reported immune response-related modules to be differentially co-regulated between ER+ and ER- breast cancer [35][36][37]. Immune-related modules are also differentially connected in non-small cell lung cancer when compared to normal tissue [38], possibly regulated through a miRNA-mediated mechanism. Interestingly, an independent report found an enrichment for targets of miRNAs related with cancer in two co-expression modules more strongly connected in lung cancer than in normal tissue [39]. Methods to identify modules that are differentially co-expressed across multiple networks find a particularly interesting application in the study of cancer stage-specific regulatory relationships [40][41][42]. In breast cancer, dynamically co-regulated modules improve the prediction of stage, and their hubs are enriched in signalling protein domains [41]. This observation confirms the idea that context-specific hubs are signalling or regulatory molecules that tune the activity of constitutive hubs, grouped in modules of genes with similar functions [43]. Only in a few cases has validation of in silico predictions been provided. Recently, however, the potential of differential co-expression in driving testable hypotheses has been demonstrated in an inclusive analysis of astrocytoma progression that integrated mRNA expression, ChIP-seq and copy number variation (CNV) data [44]. Indeed, the authors were able to identify a cell cycle-enriched module predicted to be affected by resveratrol and to experimentally validate their prediction.
Finally, specific comparisons allow for the investigation of regulatory differences between tumours classified according to various parameters: survival time [45], angiogenic features [46], type of treatment [47] and genomic stress [48]. A comprehensive study compared high and low genomic stress tumours in 15 cancer types, identifying 101 modules activated by genomic stress based on CNV, expression data, and PPI networks [48]. Within these, up-regulated hubs have been proposed as non-oncogene addiction genes for further functional studies. In the same vein, the differential co-expression module multivariate analysis method MultiDCox has been applied to breast cancer, revealing gene sets associated with mutant p53, ER status and grade [49].
2.3. Differentially Co-Regulated Genes
In cancer biology, “single-gene” approaches have been applied to prostate [50][51], gastric [52], liver [31][53], bladder [54][55], thyroid [56] and lung [57] tumours and glioblastoma [58], comparing the connectivity of genes between normal and cancerous tissue. This led to the identification of several gene lists not shared between different cancer types, as also confirmed by a systematic study performed on 12 cancer types [34]. Despite the gene-centred approach, in all studies, the genes with the strongest evidence for differential connectivity were analysed as a whole and often corresponded to previously known and druggable targets [31][34][52]. Despite the lack of a systematic study to compare the functional enrichment of DC genes across cancer types, recurrent Gene Ontology categories comprise cell cycle, apoptosis, and immune system-related genes [50][31][53][56][57][59]. Depending on the researcher’s interest, the search for DC genes can be restricted to selected gene lists [60][61]. For example, focussing on metabolic genes, a signature of genes suggestive of mitochondrial dysfunction was found to be differentially connected in seven cancer types [61]. Again, this approach can inform about differences in connectivity, allowing the grouping of samples based on any feature of interest. The comparison of patients responsive and non-responsive to a specific treatment is particularly promising to understand the rearrangement of gene networks leading to drug resistance. Through this means, well-known genes have been confirmed to confer platinum resistance (e.g., CCNE2, AKT1 and MYC), and the additional role of FGFR1 and TSC2 has been proposed [62].
The “gene-specific” approach finds a particularly interesting application in investigating the gene network neighbourhood of a pre-specified gene of interest, such as the tumour suppressors p53 or PTEN [35][51]. The opposing roles of the same gene in different cellular contexts, a widespread feature of cancer genes (e.g., Wnt5a, TGFbeta or p63 context-specific oncogenic and tumour-suppressive activity [63][64][65]) can be elucidated by this means. Surprisingly, only NOTCH1 has been investigated by differential co-expression, in lung adenocarcinoma (LUAD) and lung squamous cell carcinoma (LUSC) [66], predicting and then validating it as a pro-proliferative factor in LUAD, while acting as a tumour suppressor in LUSC.
2.4. Regulatory Mechanisms
Differential co-expression indicates changes in regulatory relationships between genes. This change can be mediated by a transcriptional regulatory mechanism that can be directly appreciated in transcriptional data (e.g., expression levels of a transcription factor or cofactor), as assessed in a set of works aiming at reconstructing GRNs [67][68][69][70]. Alternatively, changes can pertain to a different layer of molecular regulation (e.g., microRNA, DNA methylation, genomic mutations) and are hence not directly derived from transcriptional data. In any case, the integration of diverse data types regarding different regulatory layers can greatly improve the discovery and interpretation of altered gene regulatory networks, as reported in a comparative study showing an improved performance of almost all tested methods when integrating mRNA and miRNA data [71].
Indeed, the most explored of these layers is the regulatory activity of miRNAs on mRNAs, lncRNAs and mRNA–lncRNA crosstalk. In fact, it has been shown that RNA molecules sharing miRNA response elements (MREs) can communicate with each other by competing for common miRNAs (competing endogenous RNAs–ceRNAs-) [72]. The mRNA–miRNA–lncRNA connection implies a correlation of mRNA–lncRNA in the presence of a common regulatory miRNA, and no correlation in its absence.
References
- Barabási, A.-L.; Oltvai, Z.N. Network Biology: Understanding the Cell’s Functional Organization. Nat. Rev. Genet. 2004, 5, 101–113.
- Huang, S.; Ingber, D.E. A Non-Genetic Basis for Cancer Progression and Metastasis: Self-Organizing Attractors in Cell Regulatory Networks. Breast Dis. 2006, 26, 27–54.
- Kanehisa, M.; Goto, S. KEGG: Kyoto Encyclopedia of Genes and Genomes. Nucleic Acids Res. 2000, 28, 27–30.
- Srivas, R.; Shen, J.P.; Yang, C.C.; Sun, S.M.; Li, J.; Gross, A.M.; Jensen, J.; Licon, K.; Bojorquez-Gomez, A.; Klepper, K.; et al. A Network of Conserved Synthetic Lethal Interactions for Exploration of Precision Cancer Therapy. Mol. Cell 2016, 63, 514–525.
- Conte, F.; Fiscon, G.; Licursi, V.; Bizzarri, D.; D’Antò, T.; Farina, L.; Paci, P. A Paradigm Shift in Medicine: A Comprehensive Review of Network-Based Approaches. Biochim. Biophys. Acta Gene Regul. Mech. 2020, 1863, 194416.
- Derisi, J.L.; Iyer, V.R.; Brown, P. Exploring the Metabolic and Genetic Control of Gene Expression on a Genomic Scale. Science 1997, 278, 680–686.
- Jansen, R.; Greenbaum, D.; Gerstein, M. Relating Whole-Genome Expression Data with Protein-Protein Interactions. Genome Res. 2002, 12, 37–46.
- Ge, H.; Liu, Z.; Church, G.M.; Vidal, M. Correlation between Transcriptome and Interactome Mapping Data from Saccharomyces Cerevisiae. Nat. Genet. 2001, 29, 482–486.
- Kemmeren, P.; Van Berkum, N.L.; Vilo, J.; Bijma, T.; Donders, R.; Brazma, A.; Holstege, F.C.P. Protein Interaction Verification and Functional Annotation by Integrated Analysis of Genome-Scale Data. Mol. Cell 2002, 9, 1133–1143.
- Holding, A.N.; Giorgi, F.M.; Donnelly, A.; Cullen, A.E.; Nagarajan, S.; Selth, L.A.; Markowetz, F. VULCAN Integrates ChIP-Seq with Patient-Derived Co-Expression Networks to Identify GRHL2 as a Key Co-Regulator of ERa at Enhancers in Breast Cancer. Genome Biol. 2019, 20, 1–16.
- West, J.; Bianconi, G.; Severini, S.; Teschendorff, A.E. Differential Network Entropy Reveals Cancer System Hallmarks. Sci. Rep. 2012, 2.
- Sandhu, R.; Georgiou, T.; Reznik, E.; Zhu, L.; Kolesov, I.; Senbabaoglu, Y.; Tannenbaum, A. Graph Curvature for Differentiating Cancer Networks. Sci. Rep. 2015, 5, 1–13.
- Ayyildiz, D.; Gov, E.; Sinha, R.; Arga, K.Y. Ovarian Cancer Differential Interactome and Network Entropy Analysis Reveal New Candidate Biomarkers. Omi. A J. Integr. Biol. 2017, 21, 285–294.
- Anglani, R.; Creanza, T.M.; Liuzzi, V.C.; Piepoli, A.; Panza, A.; Andriulli, A.; Ancona, N. Loss of Connectivity in Cancer Co-Expression Networks. PLoS ONE 2014, 9, e0087075.
- Teschendorff, A.E.; Severini, S. Increased Entropy of Signal Transduction in the Cancer Metastasis Phenotype. BMC Syst. Biol. 2010, 4.
- Demetrius, L.; Manke, T. Robustness and Network Evolution—An Entropic Principle. Phys. Stat. Mech. Appl. 2005, 346, 682–696.
- Cheng, F.; Liu, C.; Shen, B.; Zhao, Z. Investigating Cellular Network Heterogeneity and Modularity in Cancer: A Network Entropy and Unbalanced Motif Approach. BMC Syst. Biol. 2016, 10.
- Carels, N.; Tilli, T.M.; Tuszynski, J.A. Optimization of Combination Chemotherapy Based on the Calculation of Network Entropy for Protein-Protein Interactions in Breast Cancer Cell Lines. EPJ Nonlinear Biomed. Phys. 2015, 3.
- Schramm, G.; Kannabiran, N.; König, R. Regulation Patterns in Signaling Networks of Cancer. BMC Syst. Biol. 2010, 4.
- Wong, S.W.H.; Cercone, N.; Jurisica, I. Comparative Network Analysis via Differential Graphlet Communities. Proteomics 2015, 15, 608–617.
- Park, Y.; Lim, S.; Nam, J.W.; Kim, S. Measuring Intratumor Heterogeneity by Network Entropy Using RNA-Seq Data. Sci. Rep. 2016, 6, 1–12.
- Banerji, C.R.S.; Severini, S.; Caldas, C.; Teschendorff, A.E. Intra-Tumour Signalling Entropy Determines Clinical Outcome in Breast and Lung Cancer. PLoS Comput. Biol. 2015, 11, 1–23.
- Klein, C.A. Selection and Adaptation during Metastatic Cancer Progression. Nature 2013, 501, 365–372.
- Yang, Y.; Han, L.; Yuan, Y.; Li, J.; Hei, N.; Liang, H. Gene Co-Expression Network Analysis Reveals Common System-Level Properties of Prognostic Genes across Cancer Types. Nat. Commun. 2014, 5, 3231.
- Basha, O.; Argov, C.M.; Artzy, R.; Zoabi, Y.; Hekselman, I.; Alfandari, L.; Chalifa-Caspi, V.; Yeger-Lotem, E. Differential Network Analysis of Multiple Human Tissue Interactomes Highlights Tissue-Selective Processes and Genetic Disorder Genes. Bioinformatics 2020.
- Choi, Y.; Kendziorski, C. Statistical Methods for Gene Set Co-Expression Analysis. Bioinformatics 2009, 25, 2780–2786.
- Zhang, J.; Li, J.; Deng, H.W. Identifying Gene Interaction Enrichment for Gene Expression Data. PLoS ONE 2009, 4, e0008064.
- Hung, J.H.; Whitfield, T.W.; Yang, T.H.; Hu, Z.; Weng, Z.; DeLisi, C. Identification of Functional Modules That Correlate with Phenotypic Difference: The Influence of Network Topology. Genome Biol. 2010, 11.
- Khosravi, P.; Gazestani, V.H.; Law, B.; Bader, G.D.; Sadeghi, M. Comparative Analysis of Co-Expression Networks Reveals Molecular Changes during the Cancer Progression. IFMBE Proc. 2015, 51, 1481–1487.
- Liu, Y.; Koyutürk, M.; Barnholtz-Sloan, J.S.; Chance, M.R. Gene Interaction Enrichment and Network Analysis to Identify Dysregulated Pathways and Their Interactions in Complex Diseases. BMC Syst. Biol. 2012, 6.
- Yu, H.; Lin, C.C.; Li, Y.Y.; Zhao, Z. Dynamic Protein Interaction Modules in Human Hepatocellular Carcinoma Progression. BMC Syst. Biol. 2013, 7, 1–13.
- Amgalan, B.; Lee, H. WMAXC: A Weighted Maximum Clique Method for Identifying Condition-Specific Sub-Network. PLoS ONE 2014, 9, e0104993.
- Han, L.; Chen, C.; Liu, C.H.; Zhang, M.; Liang, L. Revealing Differential Modules in Uveal Melanoma by Analyzing Differential Networks. Mol. Med. Rep. 2017, 15, 2261–2266.
- Gulfidan, G.; Turanli, B.; Beklen, H.; Sinha, R.; Arga, K.Y. Pan-Cancer Mapping of Differential Protein-Protein Interactions. Sci. Rep. 2020, 10, 1–13.
- McKenzie, A.T.; Katsyv, I.; Song, W.M.; Wang, M.; Zhang, B. DGCA: A Comprehensive R Package for Differential Gene Correlation Analysis. BMC Syst. Biol. 2016, 10, 1–25.
- Bhuva, D.D.; Cursons, J.; Smyth, G.K.; Davis, M.J. Differential Co-Expression-Based Detection of Conditional Relationships in Transcriptional Data: Comparative Analysis and Application to Breast Cancer. Genome Biol. 2019, 20, 1–21.
- Zhu, L.; Ding, Y.; Chen, C.-Y.; Wang, L.; Huo, Z.; Kim, S.; Sotiriou, C.; Oesterreich, S.; Tseng, G.C. MetaDCN: Meta-Analysis Framework for Differential Co-Expression Network Detection with an Application in Breast Cancer. Bioinformatics 2016, 33, 1121–1129.
- Amar, D.; Shamir, R. Constructing Module Maps for Integrated Analysis of Heterogeneous Biological Networks. Nucleic Acids Res. 2014, 42, 4208–4219.
- Amar, D.; Safer, H.; Shamir, R. Dissection of Regulatory Networks That Are Altered in Disease via Differential Co-Expression. PLoS Comput. Biol. 2013, 9, e1002955.
- Liu, B.; Zhang, Z.; Dai, E.N.; Tian, J.X.; Xin, J.Z.; Xu, L. Modeling Osteosarcoma Progression by Measuring the Connectivity Dynamics Using an Inference of Multiple Differential Modules Algorithm. Mol. Med. Rep. 2017, 16, 1047–1054.
- Ma, X.; Sun, P.; Qin, G. Identifying Condition-Specific Modules by Clustering Multiple Networks. IEEE/ACM Trans. Comput. Biol. Bioinform. 2018, 15, 1636–1648.
- Ma, X.; Gao, L.; Tan, K. Modeling Disease Progression Using Dynamics of Pathway Connectivity. Bioinformatics 2014, 30, 2343–2350.
- Taylor, I.W.; Linding, R.; Warde-Farley, D.; Liu, Y.; Pesquita, C.; Faria, D.; Bull, S.; Pawson, T.; Morris, Q.; Wrana, J.L. Dynamic Modularity in Protein Interaction Networks Predicts Breast Cancer Outcome. Nat. Biotechnol. 2009, 27, 199–204.
- Laaniste, L.; Srivastava, P.K.; Stylianou, J.; Syed, N.; Cases-Cunillera, S.; Shkura, K.; Zeng, Q.; Rackham, O.J.L.; Langley, S.R.; Delahaye-Duriez, A.; et al. Integrated Systems-Genetic Analyses Reveal a Network Target for Delaying Glioma Progression. Ann. Clin. Transl. Neurol. 2019, 6, 1616–1638.
- Jin, N.; Wu, H.; Miao, Z.; Huang, Y.; Hu, Y.; Bi, X.; Wu, D.; Qian, K.; Wang, L.; Wang, C.; et al. Network-Based Survival-Associated Module Biomarker and Its Crosstalk with Cell Death Genes in Ovarian Cancer. Sci. Rep. 2015, 5, 1–12.
- Padi, M.; Quackenbush, J. Detecting Phenotype-Driven Transitions in Regulatory Network Structure. NPJ Syst. Biol. Appl. 2018, 4.
- Zhou, J.; Chen, C.; Li, H.F.; Hu, Y.J.; Xie, H.L. Revealing Radiotherapy- and Chemoradiation-Induced Pathway Dynamics in Glioblastoma by Analyzing Multiple Differential Networks. Mol. Med. Rep. 2017, 16, 696–702.
- Hjaltelin, J.X.; Izarzugaza, J.M.G.; Jensen, L.J.; Russo, F.; Westergaard, D.; Brunak, S. Identification of Hyper-Rewired Genomic Stress Non-Oncogene Addiction Genes across 15 Cancer Types. NPJ Syst. Biol. Appl. 2019, 5.
- Liany, H.; Rajapakse, J.C.; Karuturi, R.K.M. MultiDCoX: Multi-Factor Analysis of Differential Co-Expression. BMC Bioinform. 2017, 18.
- Mo, W.; Fu, X.; Han, X.T.; Yang, G.Y.; Zhang, J.G.; Guo, F.H.; Huang, Y.; Mao, Y.M.; Li, Y.; Xie, Y. A Stochastic Model for Identifying Differential Gene Pair Co-Expression Patterns in Prostate Cancer Progression. BMC Genom. 2009, 10, 1–16.
- Lai, Y.; Wu, B.; Chen, L.; Zhao, H. A Statistical Method for Identifying Differential Gene-Gene Co-Expression Patterns. Bioinformatics 2004, 20, 3146–3155.
- Cao, M.S.; Liu, B.Y.; Dai, W.T.; Zhou, W.X.; Li, Y.X.; Li, Y.Y. Differential Network Analysis Reveals Dysfunctional Regulatory Networks in Gastric Carcinogenesis. Am. J. Cancer Res. 2015, 5, 2605–2625.
- Wang, Y.; Jiang, T.; Li, Z.; Lu, L.; Zhang, D.; Wang, X.; Tan, J. Analysis of Differentially Co-Expressed Genes Based on Microarray Data of Hepatocellular Carcinoma. Neoplasma 2013, 60, 607–616.
- Deng, S.P.; Zhu, L.; Huang, D.S. Mining the Bladder Cancer-Associated Genes by an Integrated Strategy for the Construction and Analysis of Differential Co-Expression Networks. BMC Genom. 2015, 16, 1–10.
- Pan, Q.; Hu, T.; Andrew, A.S.; Karagas, M.R.; Moore, J.H. Bladder Cancer Specific Pathway Interaction Networks; The MIT Press: Cambridge, MA, USA, 2013; pp. 94–101.
- Xu, X.; Long, H.; Xi, B.; Ji, B.; Li, Z.; Dang, Y.; Jiang, C.; Yao, Y.; Yang, J. Molecular Network-Based Drug Prediction in Thyroid Cancer. Int. J. Mol. Sci. 2019, 20, 263.
- Fu, S.; Pan, X.; Fang, W. Differential Co-Expression Analysis of a Microarray Gene Expression Profiles of Pulmonary Adenocarcinoma. Mol. Med. Rep. 2014, 10, 713–718.
- Ha, M.J.; Baladandayuthapani, V.; Do, K.A. DINGO: Differential Network Analysis in Genomics. Bioinformatics 2015, 31, 3413–3420.
- Gill, R.; Datta, S.; Datta, S. Differential Network Analysis in Human Cancer Research. Curr. Pharm. Des. 2014, 20, 4–10.
- Zhang, Q. A Powerful Nonparametric Method for Detecting Differentially Co-Expressed Genes: Distance Correlation Screening and Edge-Count Test. BMC Syst. Biol. 2018, 12, 1–16.
- Reznik, E.; Sander, C. Extensive Decoupling of Metabolic Genes in Cancer. PLoS Comput. Biol. 2015, 11, e1004176.
- Zhang, X.F.; Ou-Yang, L.; Zhao, X.M.; Yan, H. Differential Network Analysis from Cross-Platform Gene Expression Data. Sci. Rep. 2016, 6, 1–12.
- Asem, M.S.; Buechler, S.; Wates, R.B.; Miller, D.L.; Stack, M.S. Wnt5a Signaling in Cancer. Cancers 2016, 8, 79.
- Chen, Y.; Peng, Y.; Fan, S.; Li, Y.; Xiao, Z.X.; Li, C. A Double Dealing Tale of P63: An Oncogene or a Tumor Suppressor. Cell. Mol. Life Sci. 2018, 75, 965–973.
- Bach, D.H.; Park, H.J.; Lee, S.K. The Dual Role of Bone Morphogenetic Proteins in Cancer. Mol. Ther. Oncol. 2018, 8, 1–13.
- Sinicropi-Yao, S.L.; Amann, J.M.; Lopez, D.L.Y.; Cerciello, F.; Coombes, K.R.; Carbone, D.P. Co-Expression Analysis Reveals Mechanisms Underlying the Varied Roles of NOTCH1 in NSCLC. J. Thorac. Oncol. 2019, 14, 223–236.
- Wang, K.; Saito, M.; Bisikirska, B.C.; Alvarez, M.J.; Lim, W.K.; Rajbhandari, P.; Shen, Q.; Nemenman, I.; Basso, K.; Margolin, A.A.; et al. Genome-Wide Identification of Post-Translational Modulators of Transcription Factor Activity in Human B Cells. Nat. Biotechnol. 2009, 27, 829–837.
- Hansen, M.; Everett, L.; Singh, L.; Hannenhalli, S. Mimosa: Mixture Model of Co-Expression to Detect Modulators of Regulatory Interaction. Algorithms Mol. Biol. 2010, 5, 1–9.
- Shimamura, T.; Matsui, Y.; Kajino, T.; Ito, S.; Takahashi, T.; Miyano, S. GIMLET: Identifying Biological Modulators in Context-Specific Gene Regulation Using Local Energy Statistics. In Lecture Notes Computer Science (Including Its Subseries Lecture Notes in Artificial Intelligence (LNAI) and Lecture Notes in Bioinformatics); Springer: New York, NY, USA, 2019; Volume 10834, pp. 124–137.
- Babur, Ö.; Demir, E.; Gönen, M.; Sander, C.; Dogrusoz, U. Discovering Modulators of Gene Expression. Nucleic Acids Res. 2010, 38, 5648–5656.
- Lichtblau, Y.; Zimmermann, K.; Haldemann, B.; Lenze, D.; Hummel, M.; Leser, U. Comparative Assessment of Differential Network Analysis Methods. Brief. Bioinform. 2017, 18, 837–850.
- Salmena, L.; Poliseno, L.; Tay, Y.; Kats, L.; Pandolfi, P.P. A CeRNA Hypothesis: The Rosetta Stone of a Hidden RNA Language? Cell 2011, 146, 353–358.

