
| Version | Summary | Created by | Modification | Content Size | Created at | Operation |
|---|---|---|---|---|---|---|
| 1 | wajahat Tareen | + 4293 word(s) | 4293 | 2020-12-17 04:52:29 | | | |
| 2 | Camila Xu | Meta information modification | 4293 | 2020-12-17 09:09:21 | | | | |
| 3 | Guido Rubino | Meta information modification | 4293 | 2023-10-31 15:23:57 | | |
Video Upload Options
EVs or Plug-In EVs (PEVs) are powered by rechargeable batteries and classified in the green technology vehicles, which will replace the Internal Combustion Engine (ICE). The transferring technologies from petroleum-based transportation to green transportation has a number of benefits in several areas like economic, environment, and technical support.
1. Introduction
Global climate change, fossil fuel depletion, increasing prices, and energy security have carried the significant changes in power and mobility sector. The mobility sector consumes around one-fifth of global energy consumption [1]. The road transportation in European Union (EU) is recognized as one of the major sources of CO2 emissions and it degrades the air quality level below EU standards. Therefore, it is estimated that if the economic growth of EU continues at the current rate, the emissions will increase up to 50% (compared to 1990) by 2020 [2]. Several steps are being commenced to accelerate the shift to decarbonize the transportation sector. In this direction, the EU has made legislation to achieve 30% reduction in CO2 emissions up to 2030 by increasing the penetration of Electric Vehicles (EVs) in the transportation network [3].
According to Eurostat [4], the transport sector marked up to 85% of total EU’s oil imports by the end of 2015. This has stressed the EU economy by paying an ample amount on petroleum imports. The inclusion of EVs in the transportation sector will not only reduce oil consumption, but also saves millions of Euros financed to keep the environment healthy. This step will regulate the EU’s economy. The additional economic benefits of EVs are in terms of new business avenues and employment opportunities in the manufacturing and service industries. In a study [5], it is projected that due to emergence of EVs, the European economy will be able to accommodate 206,000 people with jobs by the end of 2030. Thus, a sustainable technology will lead to sustainable economy. The carbonized vehicles on the roads are responsible for the 12% of EU carbon emissions and contribute to the global climate change [6]. The reduction in carbon emissions and other pollutants are the key drivers for EVs adoption in EU countries. The EU six-year plan targets the 18–40% CO2 reduction (compare to 2007) in the transportation sector by encouraging more EVs on the road [6]. Besides making a mark in the economy and environment protection, the EVs also provide technical support to the electric grid. These services include voltage support to the grid, frequency regulations, energy storage for grid, peak shaving, and load flattening [7]. The voltage of the network may drop due to faults or feeding a suddenly introduced large load. The EVs equipped with voltage droop control system can maintain the system voltage quality. Similarly, frequency violation caused by mismatch of active power generation and demand can be avoided with its frequency droop control mechanism. Besides voltage and frequency regulation service, the EVs are also useful for managing the peak demand. The distribution system experiences a varying load and peak demand that can be managed by discharging the power stored in the vehicle’s battery without network reinforcement. In conclusion, all the benefits stated above motivate EVs’ adoption at large scale. In this race, the European countries look very active to promote the EVs through their policies including tax rebate and public subsidies. Therefore, the EV volume on the road will increase in coming years and will lead to achieving the benefits.
On the other hand, the wide spread adoption of the EVs is accompanied by numerous challenges such as in context from energy, transportation, and industries. The EV charging activities either performed at home or at a public charging station require the development of charging platforms and infrastructure for EVs. Additionally, the high penetration of EVs in the distribution network causes the high capital investment of smart grid technologies. Therefore, the charging operation of EVs consumes a relatively large amount of electricity due to the considerable size of EVs’ battery charging time. Oppositely, the simultaneous or uncoordinated charging of EVs clusters considerably increases electricity consumption, which causes an unexpected peak on the system and leads to over loading of distribution network, resulting in the voltage quality degradation, power loss increment, and dispatch of uneconomical energy sources [8]. There exist two potential solutions to manage the growing charging demand of EVs without making a compromise on network operational performance, and each solution has its own operating domain. Firstly, the Supply Side Control Action (SSCA) is refers to increasing and managing the generation capacity of the system to meet the peak demand caused by simultaneous charging of electric vehicles. This is an expensive approach and needs modern gradation of grid infrastructure. Secondly, the Demand Side Control Action (DSCA), which is the alternate solution to control the charging demand of EVs, is concealed in demand response program. It refers to the steps taken by utilities and consumers with dynamic pricing to influence the electricity consumption for the sake of optimal billing [9]. Figure 1 shows the hierarchical flow of our survey, which mainly focuses on EVs charge scheduling environment, i.e., the pricing policies designed by the utilities and the optimization tools along with the optimization objectives require to accomplish an optimal EVs charging schedule.
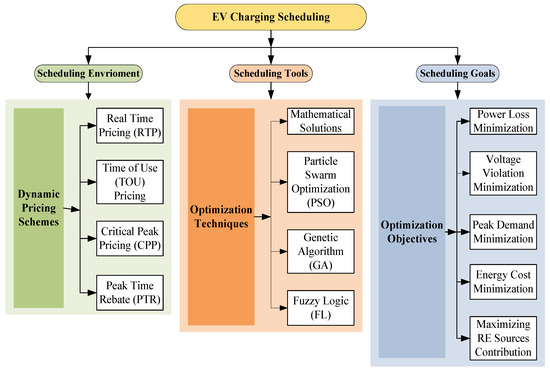
Figure 1. Order of literature survey on EV charging.
From a utilities prospective, the EVs’ charging is a typical demand side management subject and can be effectively realized by dynamic electricity pricing, which directly influences the charging activities. Electricity pricing policies can motivate the EV customers to shape their charging demand in response to the price signal, which could not only eradicate the adverse impacts on the distribution network, but also diminish the customer’s electricity billing. The EVs’ charging can be scheduled by dynamic electricity pricing policies such as Time of Use (ToU), Real Time Pricing (RTP), and Critical Peak Pricing (CPP). These pricing policies influence the charging behavior of EV customers, thus offering the coordination flexibility of charging activity.
There exist a number of surveys in the literature related to EVs’ charge scheduling. The surveys [10][11][12] mainly focus on the optimization techniques and objectives employed for smart charging of EVs. In [10], the authors provide a comprehensive review on EV charging while covering the centralized, decentralized, and hybrid control frameworks that lack in [11][12][13][14]. In [13], the authors mainly focus on the objectives of EVs. The optimization tools to achieve these objectives are not part of this study. Our study mainly differs from [10][11][12][13][14] in terms of its focus on dynamic electricity pricing policies, which cannot be ignored when dealing with smart charging scheduling of electric vehicles. Concentrating on each pricing policy, we have presented a survey of optimization techniques and their objectives employed to achieve an optimal charging schedule. This study is mainly concerned with optimal scheduled charging of EVs in the context of dynamic electricity pricing policies including RTP, CPP, and ToU. An optimal scheduled charging of electric vehicles involves the objectives and the optimization techniques used to achieve target. Within the domain of individual pricing policy, we have also explored various optimization techniques employed during EV charging to achieve objective functions such as charging cost minimization, profit maximization, power loss minimization, voltage profile improvement, and load leveling.
2. Smart Grid and EV Charging
The traditional electricity grid has been facing the challenge of managing the increasing electricity consumption effectively. With the development of technology, the existing grids are transforming into a self-regulated grid called Smart Grid (SG). The SG network is an intelligent electricity grid equipped with information and communication (ICT) facilities. The SG network provides a controlled environment to coordinate EVs’ charging operation [15][16], enable large integration of renewable energy sources and flatten their variability [17], and support the vehicle to grid (V2G) feature for grid support services including frequency tuning and load regulation [18]. Various attributes of Smart Grid at different levels of electricity network are summarized in Figure 2. All these attributes are about smart grid technology, which sets an efficient and sustainable energy system to facilitate (1) individual customers regulating their electricity consumption against varying electricity prices and (2) utilities and grid operators monitoring and controlling their generation resources and network assets for optimized network operation. Smart grid has a comprehensive charging facility including advanced metering infrastructure, which allows the bidirectional communication between electricity customers and aggregator to schedule the charging/discharging activities. An aggregator is an intermediate entity that manages the communication and electricity distribution between the group of electricity users (EV charging customers) and utility, as highlighted in Figure 3. The major role of the aggregator is between load devices and dispatcher to establish and monitor market supply and demand [19]. In a cooperative set-up, an aggregator coordinates and schedules the EV charging to minimize the overall charging cost [20]. The EV aggregator persuades or allots the charging load to level the off-peak loading occurs at power grid and also improves the load curve by consuming the surplus power during the off-peak hours [21].
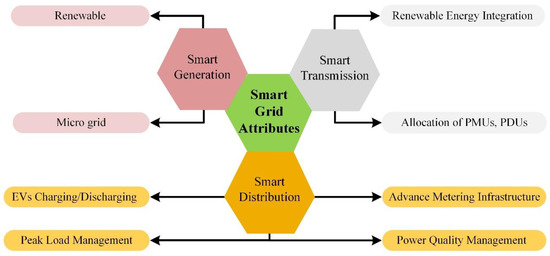
Figure 2. Various attributes of smart grid technology.
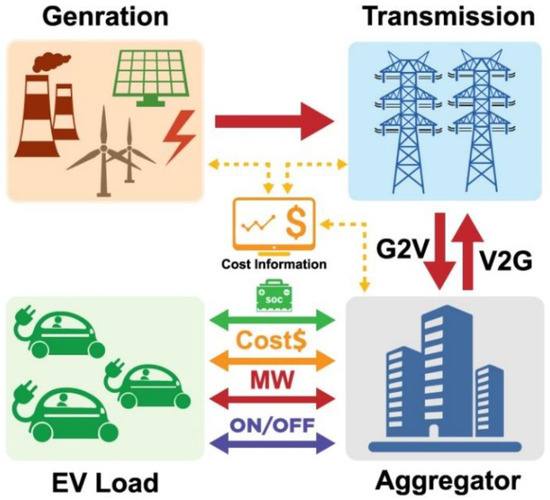
Figure 3. The EVs aggregators’ role in the energy market.
The information shared by the EVs to the aggregator includes EVs’ current location, battery’s State of Charge (SOC), required SOC, maximum battery’s charging capacity, and the time frame to achieve requested SOC level. The aggregator is an additional entity between utility and electricity customers who control the EVs’ charging activities, keeping in view the interest of both parties: the customers and the utility [22]. The aggregator/grid operator and the customers share information with each other the following communication protocol defined by Society Automotive Engineer (SAE) J2836/1 and J2847/1 standards [23]. Different communication layers including ZigBee, Wi-Fi, Power Line Carrier (PLC), Digital Subscriber Line (DSL), and Cellular Network (CN) are used to communicate with the smart grid [24].
2.1. EV Charging International Standards
The EV charging can be done either at home or at public charging station located at shopping malls, restaurants, workplaces, etc. There are three different modes of charging of EVs, as defined by the SAE standards. Two modes, namely mode 1 and mode 2, are for Alternating Current (AC) type charging, and mode 3 is for Direct Current (DC) type charging. These charging modes are being implemented in many European countries, Japan, and the United States [25]. The charging standards and different level charging stations are designed according to the charging characteristics modes stated in Table 1. For home-based charging, Mode 1, also called AC Charging Level 1, is used. It functions at 120 V AC voltage and is developed by making a small change in household wiring. It is a low cost charging setup but involves high charging time, i.e., 12–16 h to reach 100% SOC. Besides home based charging, EVs can also be charged at charging stations positioned at public places. The public charging stations use Mode 2 and offer a relatively fast charging rate. However, it is expensive to install Mode 2 charging infrastructure and has considerable impact on the utility. In addition to AC charging facility, a DC charging arrangement also exists commercially. The Mode 3 charging is the DC fast charging, which is accomplished with an off-board supply unit. It has power rating 80–200 kW and can charge the vehicles in short time of around 30 min; however, it significantly affects the utility’s maximum demand rates and encompasses the highest cost of installation.
Table 1. Distinct charging modes and their characteristics.
| Charging Mode |
Charging Characteristics | Advantages | Disadvantages | |||||
|---|---|---|---|---|---|---|---|---|
| Charging Outlets |
Voltage Rating (V) |
Current Rating (A) |
Power Rating (kW) |
Supply Connection | Charging Period (Hour) |
|||
| Mode 1 | Domestic | 120 VAC | 12–16 | 1.4–1.9 | Single phase | 6–10 | Low installation cost Less impact on utility |
Slow charging rate Long charging period |
| Mode 2 | Domestic, Public | 240 VAC | 80 | 19.2 | Single/Three phase | 1–3 | Fast charging time Energy efficient |
High installation cost Impact on the utility |
| Mode 3 | Public | 480 VDC | 80–200 | 20–120 | Three phase | 0.5 | Very fast charging time High energy efficient |
High installation cost High impact on the utility |
2.2. Coordinated EV Charging Framework
A random or uncoordinated EV charging approach imposes negative impacts on the distribution grid including real power loss increment, sever voltage variation, over loading of the network, grid reinforcement, and expensive charging operation [8][26][27]. The coordinated charging can improve a utility’s operational performance by smartly managing EV charging load and can minimize the charging cost by adopting dynamic pricing policies. In a smart grid environment, the coordinated EV charging operation can be accomplished in two ways: 1) centralized framework and 2) decentralized framework. In either control framework, the charging activities are managed by an agent called an aggregator [22]. An aggregator is the interfacing body between EV customers and the distribution network operator, which optimally fulfills the charging demand of the customers without compromising on network constraints [18]. The aggregator involvement enables the customers to link with the electricity market and it upholds their financial interests. Similarly, the aggregator equally works for the network operators to optimize their network performance. Besides controlling charging operation of EVs, the aggregator also contributes in voltage and frequency support, load balancing, and power loss reduction by controlling discharging operation of EV batteries. The operation, i.e., charging/discharging, is controlled either centrally or in a distributed manner as discussed in the following sections.
The centralized EV charging control is also called the direct control charging architecture [14], as shown in Figure 4. The aggregator is exclusively responsible for ensuring coordinated process for EV charging, keeping in view the benefits of both the parties, i.e., network operator and the charging customers. The centralized framework offers full support to the ancillary services. However, it involves higher order complexity and can entertain a limited number of charging customers [28]. The computational complexity is more for this framework, as it involves large volume of data [29]. With reference to [30], this approach requires a large number of conditions to schedule the charging load, which results in lesser flexibility. In a decentralized charging control frame work, the power of making a decision about EV charging is distributed among individual EV customers [31], as shown in Figure 5. Although this control logic empowers the customers to take their charging decisions, this may not guarantee to optimal solution for distribution network, because the aggregators cannot directly regulate the charging activities. They can only change the customers’ charging behavior by offering attractive incentives through dynamic electricity pricing schemes [32]. For real time coordination, EV arrival is considered as a random variable; therefore, a framework having higher degree of scalability is very important. The decentralized model offers greater scalability in this regard [33]. A comparison of centralized versus distributed logic used to control EV charging activities is presented in Table 2. Compared to centralized charging control, the distributed framework is more flexible, scale-able, and empowers the customers in decision-making process of EVs charging. Therefore, it is highly acknowledged in EV charging scheduling control design.
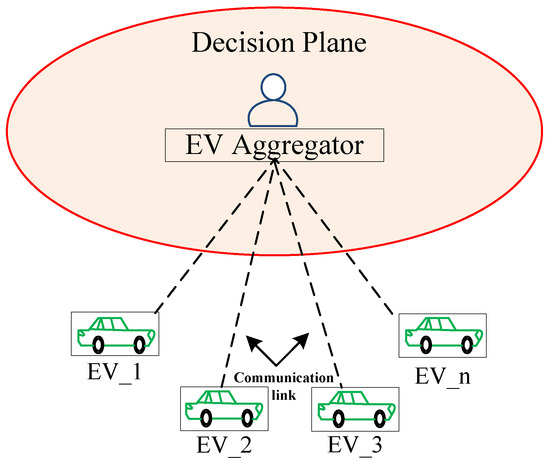
Figure 4. Centralized EV charging control.
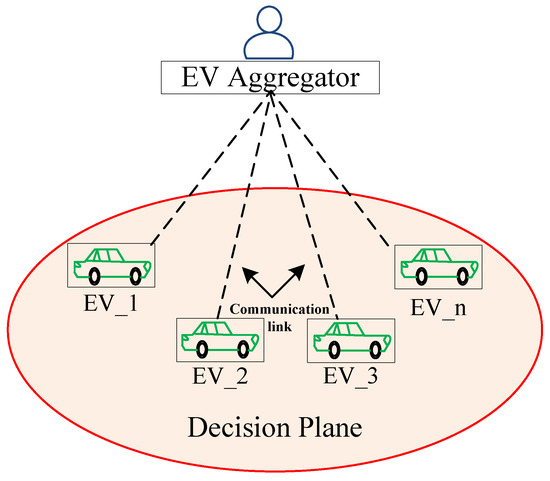
Figure 5. Decentralized EV charging control.
Table 2. Comparison of centralized and distributed EV charging control.
| Characteristics | Charging Control Logic | |
|---|---|---|
| Centralized | Distributed | |
| Charging Decision | The aggregator | The EV customer |
| Control Action | Direct control | Price-Based Control |
| Ancillary Services | Fully supported | Partially supported |
| Computational Complexity | More | Less |
| Flexibility | Less | More |
| Scalability | Less | More |
3. Dynamic Electricity Pricing Policies
Electricity billing recovers the cost of supplied electric energy and ensures the reasonable profit. This cost includes expenses by retailer or utility to provide electricity service (generation, transmission, and distribution) and fixed cost [34]. Each customer of electricity is charged with a certain amount based on usage of per kWh, known as a tariff, in order to recover this cost. Market-based cost of energy and administration-based price consist of tax, surcharge, and network charges (transmission and distribution), which are two major part of the tariff. The conventional tariffs, flat tariff, block rate tariff, simple tariff, two-part tariff, power factor tariff, and maximum demand tariff, are not sufficient for handling of modern complex network of smart grid and Intelligent Electronic Devices (IEDs) [35].
According to some recent surveys, residential building customers are responsible for 30% of carbon emissions and 40% of global energy consumption [20]. According to a US Department of Energy (DoE) survey in 2009, residential and commercial users consume 40% of total power consumption [36]. The world power consumption is growing rapidly, as it is expected this factor will rise by approximately 53% by 2035 [20]. According to International Energy Agency (IEA), this demand of electricity will increase up to 60% by 2040 [37]. In order to reduce these impacts, electricity suppliers provide customers with a different Demand Side Management (DSM) program. DSM is major part of smart pricing in order to operate the system efficiently by optimizing electricity usage and also cost minimization through modification of load curve shaped by six basic load shaping methods, which are load shifting, strategic conservation, peak clipping, strategic growth, and valley filling [20].
The demand response program is actually a change in usage of electricity by the end user from their regular load pattern in response to electricity price changing over time, or due to the incentive payments introduced to reduce electricity usage during the high wholesale market prices (market-driven DSM), or when network reliability is endangered (network-driven DSM) [34]. The important task of demand response (DR) management is to switch electricity consumers from a flat rate tariff to peak and off-peak pricing [35]. The DR is categorized into two parts: the interruptible program, which is Direct Control, and price based program which is the Indirect Control program. Load shedding, intended brown out, and Direct Load Control (DLC) are part of the controllable method engaged for reliable electricity supply. In order to maintain the system reliability, direct reduction of electricity consumption is practiced by scheduling load into different zones of a large area, known as load shedding. The second approach is DLC, which refers to direct control of operator to the load, which enables it to alternate load according to system requirements. Sometimes, the system operator marginally reduces voltage frequency within limitations to equate electricity generation and transport capacity, which is called brown out [36]. DLC is incentive-based DSM in which the electricity provider acquires control of electrical equipment installed in customer premises and schedules according to contractual terms to reduce the load on short announcement for peak duration, and in return, customers are rewarded with incentive money. It is very difficult to run DLC efficiently without creating trouble for the electricity customers. Although customers are incentivized for this inconvenience, restriction to utilize the facility at that moment when it is needed the most (e.g., urgent EVs charging) induces large discomfort. Another peak is again observed in the load demand, as large EVs fleets are connected simultaneously to recharge their EVs, when event is turned on, known as rebound effect or payback [36][37]. The indirect control type of DR, which is based on price, encourages customers to alternate their normal routine of electricity consumption as per the price signal. The time-based DR provides an opportunity to the customer to choose the time of use according to pricing signal. There are several dynamic pricing types based on usage and time [38], as highlighted in Figure 6. Our focus is on the non-dispatchable DR program, which is based on dynamic electricity pricing schemes.
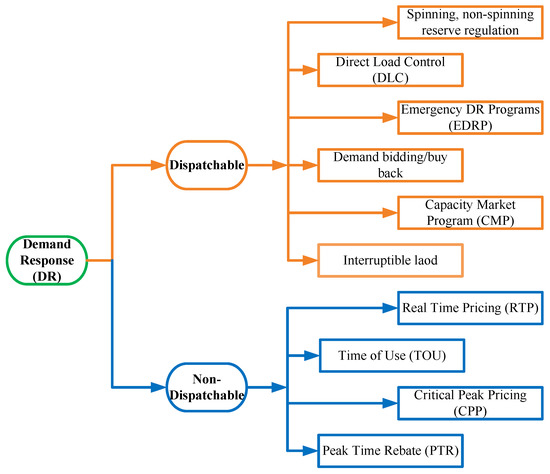
Figure 6. Classification of DR programs.
Most of the conventional tariff schemes are based on static pricing arrangements, which mean price does not change with the change in electricity demand, whereas modern tariff is based on dynamic pricing policies (e.g., CPP, RTP, ToU, PTR, etc.), which means prices vary according to demand [39][40]. A dynamic pricing scheme provides a chance to shrink their electricity bills by shifting load to off-peak hours. A dynamic pricing scheme is adopted to attain several goals listed in Figure 7. The response of domestic customers towards the dynamic pricing is negative, because it is possibly too difficult for an individual to respond according to changing price due to unawareness of billing. An International Business Machine (IBM) survey in 2011 reveals that 30% customers did not understand the basics of electricity billing [41]. Enabling automation technology helps customers significantly to respond quickly to pricing signal, as manually it’s very difficult to manage loads for the uninformed individual. Study [35] presents a recent survey of 3863 residential electricity customers in China, and it shows that about 67% of energy users are ready to accept dynamic pricing. Recent research shows peak load reduction up to 30% by using dynamic pricing. Different experiment results are documented that show 4% reduction to 8% increment in electricity billing; however, more renewable energy (RE) integration in the grid can result in further reduction in electricity consumption cost [42]. From the perspective of willingness to pay for quality services, a customer may be willing to pay one and half times more than current billing [39]. In the following subsections, we will discuss major dynamic pricing schemes including Real Time Pricing (RTP), Time of Use (ToU), Critical Peak Pricing (CPP), and Peak Time Rebates (PTR). Every pricing scheme type has its own benefits and drawbacks; our study will highlight the objectives, optimization methods, and a comparison of different pricing schemes.
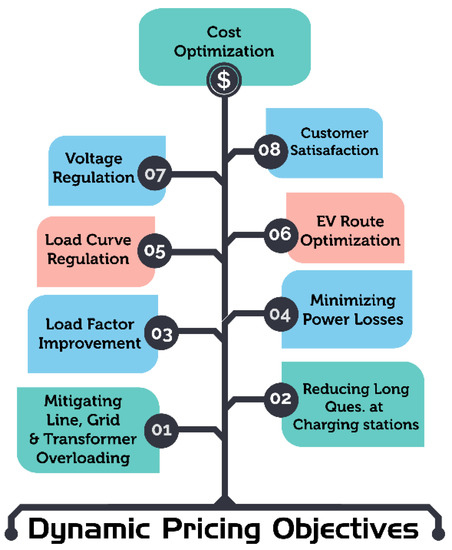
Figure 7. Various objectives of dynamic electricity pricing.
3.1. Real Time Pricing (RTP)
This dynamic pricing type, which seems superior to all other schemes, is RTP and is defined as “a varying rate that allows prices to be adjusted regularly in a consistent interval of hour or few minutes to reflect real time structure” [43]. The change in price in such a small interval of time makes this scheme most uncertain and risky for the customers; however, it is very beneficial for utilities. The efficiency of the pricing scheme is increased, because change in price in small intervals reflects the actual cost of supply [39]. In smart grid infrastructure, utility can obtain the desired load curve by adjusting the electricity price intelligently for an individual customer [44]. There are two major limitations of RTP deployment in the current grid system. Firstly, customers are not very educated about the billing, and they do not know how to deal with frequently changing rates. Secondly, the existing infrastructure and automation system of residential and commercial buildings is not effective to ride this new system [45]. In order to resolve these issues, RTP is used with Inclining Block Rate (IBR) and an automatic residential energy consumption scheduling framework [46]. RTP with feedback information of energy usage and saving devices proves beneficial to obtain optimal results. The installation of IHD (in home display) provides information to users of electricity consumption and market price, which can make customers more informed and decisive about their energy usage [47].
3.2. Time of Use (ToU)
The ToU is defined as “time block rates of electricity” and these rates are announced significantly in advance by utilities based on historical conditions rather than current load curve. The ToU pricing offers various electricity tariffs to customers with different time periods in the 24 h. The ToU is usually based on three time periods according to load: off peak, mid peak, and full peak. During the off-peak period, electric supply capacity is greater than demand, so ToU cost becomes low. At mid peak, capacity and demand are very close, which provides moderate pricing. Electric load becomes very high during peak hours. In order to meet this peak demand, utilities need to run less efficient and expensive peaking power plants such as diesel, coal, and petrol-based units, etc. Furthermore, in order to encounter peak demand, it requires development of the existing system and new power plants. As the electricity supply increases, technical losses of a system also increase, which cause higher peak rates [17][38]. Infrastructural variations and indirect control pricing seems advantageous to lessen the massive influence of EV charging on the power system. As the ToU has just high rates during the peak time and low rates in the off-peak period, only the ToU tariff is not capable of reducing the EV charging load. It may happen that simultaneously large fleets of EVs come into charging mode in the off-peak period, causing another peak or rebound effect [48]. Another variation of ToU is super-peak ToU, in which the peak window is much shorter, about 4 h, in order to give a strong price signal [39].
3.3. Critical Peak Pricing (CPP)
The CPP resembles to ToU pricing, but it is based on forecasting of high demand periods and advertised in a much shorter time as compared to ToU. CPP responds appropriately on the basis of present conditions, rather than relying on historic data. The comparative analysis of CPP and ToU shows that CPP has much higher prices than ToU, whereas the effectiveness of ToU at peak load reduction is lesser than CPP [49]. Days of CPP are divided into two categories: critical days and non-critical days. The critical days can be calculated using different algorithms like Particle Swarm Optimization (PSO), which helps to trigger the peak prices by CPP dynamic decision model. This model is very helpful in the improvement of load curve and electricity bills reduction [50].
3.4. Peak Time Rebates (PTR)
In this pricing scheme, customers are provided with rebates for using electricity under a certain preset limit in peak hours [39]. In the first three schemes, utilities charge more during peak hours as compared to the off-peak period; however, in PTR, customers are rewarded for load reduction during peak hours. The comparative analysis shows that in RTP, CPP, and ToU the customers view the peak load shifting to off-peak hours as loss, while in PTR, they view it as gain [51]. The cost-effectiveness of PTR is largely dependent on Customer Baseline Load (CBL) estimation. Therefore, PTR is costlier for electricity providers to implement, as it requires the development of appropriate precise CBL estimation [49]. Tariff representation of different dynamic pricing policies is summarized in Figure 8. The RTP scheme is highly unstable compared to other schemes, and it offers great flexibility to customers to regulate their consumption. Compared to the flat rate pricing policy, the dynamic pricing policies are a more attractive and economical choice for the customers. The comparative analysis of different pricing policies considering different aspects is presented in Table 3. The authors have analyzed the various dynamic policies based on different considerations. The analysis reveals that in all considerations, the RTP pricing scheme proves a more promising solution than other schemes, except in billing instability [52].
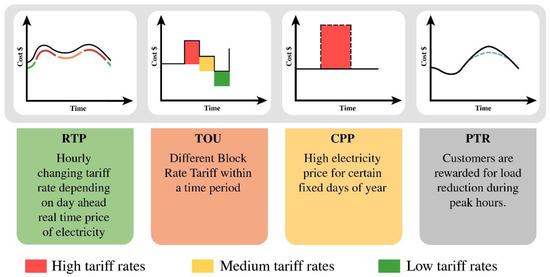
Figure 8. Tariff representation of different electricity pricing schemes.
Table 3. Comparison of different pricing schemes.
| Considerations | RTP | ToU | CPP | PTR | Flat Rate |
|---|---|---|---|---|---|
| Economic efficiency | **** | *** | *** | *** | ** |
| Bill steadiness | ** | *** | *** | **** | **** |
| System complexity | **** | *** | *** | *** | ** |
| Price uncertainty | **** | ** | *** | *** | ** |
| Fairness | **** | *** | *** | ** | * |
| Risk incentive | **** | *** | **** | ** | * |
***** Very High, **** High, *** Medium, ** Low, * Very Low.
References
- Nanaki, E.A.; Koroneos, C.J. Climate change mitigation and deployment of electric vehicles in urban areas. Renew. Energy 2016, 99, 1153–1160. [Google Scholar] [CrossRef]
- EUR-Lex. Results of the Review of the Community Strategy to Reduce CO2 Emissions from Passenger Cars and Light-Commercial Vehicles-Impact Assessment. 2007. Available online: https://eur-lex.europa.eu/legal-content/EN/TXT/?uri=CELEX%3A52007SC0060 (accessed on 1 March 2019).
- OECD. Nordic EV Outlook 2018-Insights from Leaders in Electric Mobility. 2018. Available online: http://www.oecd.org/finland/nordic-ev-outlook-2018-9789264293229-en.html (accessed on 1 March 2019).
- European Alternative Fuel Observatory. The Transition to a Zero Emission Vehicles Fleet for Cars in the EU by 2050. Available online: http://www.eafo.eu/sites/default/files/The%20transition%20to%20a%20ZEV%20fleet%20for%20cars%20in%20the%20EU%20by%202050%20EAFO%20study%20November%202017.pdf (accessed on 2 March 2019).
- Cambridge Econometrics. Low-Carbon Cars in Europe: A Socio-Economic Assessment. 2018. Available online: https://www.camecon.com/wp-content/uploads/2018/02/Fuelling-Europes-Future-2018-v1.0.pdf (accessed on 2 March 2019).
- European Commission. Reducing CO2 Emission from Passenger Cars. Available online: https://ec.europa.eu/clima/policies/transport/vehicles/cars_en/ (accessed on 2 March 2019).
- David, A.O.; Al-Anbagi, I. EVs for frequency regulation: Cost benefit analysis in a smart grid environment. IET Electr. Syst. Transp. 2017, 7, 310–317. [Google Scholar] [CrossRef]
- Deilami, S.; Masoum, A.S.; Moses, P.S.; Masoum, M.A. Real-time coordination of plug-in electric vehicle charging in smart grids to minimize power losses and improve voltage profile. IEEE Trans. Smart Grid 2011, 2, 456–467. [Google Scholar] [CrossRef]
- Siano, P. Demand response and smart grids—A survey. Renew. Sustain. Energy Rev. 2014, 30, 461–478. [Google Scholar] [CrossRef]
- Amjad, M.; Ahmad, A.; Rehmani, M.H.; Umer, T. A review of EVs charging: From the perspective of energy optimization, optimization approaches, and charging techniques. Transp. Res. Part D Transp. Environ. 2018, 62, 386–417.
- Tan, K.M.; Ramachandaramurthy, V.K.; Yong, J.Y. Integration of electric vehicles in smart grid: A review on vehicle to grid technologies and optimization techniques. Renew. Sustain. Energy Rev. 2016, 53, 720–732. [Google Scholar] [CrossRef]
- Yang, Z.; Li, K.; Foley, A. Computational scheduling methods for integrating plug-in electric vehicles with power systems: A review. Renew. Sustain. Energy Rev. 2015, 51, 396–416. [Google Scholar] [CrossRef]
- Rahman, I.; Vasant, P.M.; Singh, B.S.M.; Abdullah-Al-Wadud, M.; Adnan, N. Review of recent trends in optimization techniques for plug-in hybrid, and electric vehicle charging infrastructures. Renew. Sustain. Energy Rev. 2016, 58, 1039–1047. [Google Scholar] [CrossRef]
- García-Villalobos, J.; Zamora, I.; Martín, J.I.S.; Asensio, F.J.; Aperribay, V. Plug-in electric vehicles in electric distribution networks: A review of smart charging approaches. Renew. Sustain. Energy Rev. 2014, 38, 717–731. [Google Scholar] [CrossRef]
- Zhang, C.; Huang, Q.; Tian, J.; Chen, L.; Cao, Y.; Zhang, R. Smart grid facing the new challenge: The management of electric vehicle charging loads. Energy Procedia 2011, 12, 98–103. [Google Scholar] [CrossRef]
- Amin, A.; Tareen, W.U.K.; Usman, M.; Memon, K.A.; Horan, B.; Mahmood, A.; Mekhilef, S. An Integrated Approach to Optimal Charging Scheduling of Electric Vehicles Integrated with Improved Medium-Voltage Network Reconfiguration for Power Loss Minimization. Sustainability 2020, 12, 9211. [Google Scholar] [CrossRef]
- Phuangpornpitak, N.; Tia, S. Opportunities and challenges of integrating renewable energy in smart grid system. Energy Procedia 2013, 34, 282–290. [Google Scholar] [CrossRef]
- Sundstrom, O.; Binding, C. Flexible charging optimization for electric vehicles considering distribution grid constraints. IEEE Trans. Smart Grid 2011, 3, 26–37. [Google Scholar] [CrossRef]
- Taheri, N.; Entriken, R.; Ye, Y. A dynamic algorithm for facilitated charging of plug-in electric vehicles. IEEE Trans. Smart Grid 2013, 4, 1772–1779. [Google Scholar] [CrossRef]
- Abushnaf, J.; Rassau, A.; Górnisiewicz, W. Impact of dynamic energy pricing schemes on a novel multi-user home energy management system. Electr. Power Syst. Res. 2015, 125, 124–132.
- Jian, L.; Zheng, Y.; Shao, Z. High efficient valley-filling strategy for centralized coordinated charging of large-scale electric vehicles. Appl. Energy 2017, 186, 46–55.
- Bessa, R.J.; Matos, M.A. Economic and technical management of an aggregation agent for electric vehicles: A literature survey. Eur. Trans. Electr. Power 2012, 22, 334–350. [Google Scholar] [CrossRef]
- IEEE Standard Association. IEEE Standard Technical Specifications of a DC Quick Charger for Use with Electric Vehicles. 2018. Available online: https://ieeexplore.ieee.org/document/7400449 (accessed on 10 March 2019).
- Mwasilu, F.; Justo, J.J.; Kim, E.-K.; Do, T.D.; Jung, J.-W. Electric vehicles and smart grid interaction: A review on vehicle to grid and renewable energy sources integration. Renew. Sustain. Energy Rev. 2014, 34, 501–516. [Google Scholar] [CrossRef]
- Yong, J.Y.; Ramachandaramurthy, V.K.; Tan, K.M.; Mithulananthan, N. A review on the state-of-the-art technologies of electric vehicle, its impacts and prospects. Renew. Sustain. Energy Rev. 2015, 49, 365–385.
- Deilami, S.; Masoum, A.S.; Moses, P.S.; Masoum, M.A. Voltage profile and THD distortion of residential network with high penetration of Plug-in Electrical Vehicles. In Proceedings of the 2010 IEEE PES Innovative Smart Grid Technologies Conference Europe (ISGT Europe), Gothenberg, Sweden, 11–13 October 2010; pp. 1–6. [Google Scholar]
- Hilshey, A.D.; Hines, P.D.; Rezaei, P.; Dowds, J.R. Estimating the impact of electric vehicle smart charging on distribution transformer aging. IEEE Trans. Smart Grid 2012, 4, 905–913.
- Zakariazadeh, A.; Jadid, S.; Siano, P. Multi-objective scheduling of electric vehicles in smart distribution system. Energy Convers. Manag. 2014, 79, 43–53. [Google Scholar] [CrossRef]
- Arif, A.; Babar, M.; Ahamed, T.I.; Al-Ammar, E.; Nguyen, P.; Kamphuis, I.R.; Malik, N. Online scheduling of plug-in vehicles in dynamic pricing schemes. Sustain. Energy Grids Netw. 2016, 7, 25–36. [Google Scholar] [CrossRef]
- Hu, Z.; Zhan, K.; Zhang, H.; Song, Y. Pricing mechanisms design for guiding electric vehicle charging to fill load valley. Appl. Energy 2016, 178, 155–163. [Google Scholar] [CrossRef]
- Mierau, M.; Kohrs, R.; Wittwer, C. A distributed approach to the integration of electric vehicles into future smart grids. In Proceedings of the 2012 3rd IEEE PES Innovative Smart Grid Technologies Europe (ISGT Europe), Berlin, Germany, 14–17 October 2012; pp. 1–7. [Google Scholar]
- Ma, Z.; Callaway, D.S.; Hiskens, I.A. Decentralized charging control of large populations of plug-in electric vehicles. IEEE Trans. Control Syst. Technol. 2011, 21, 67–78. [Google Scholar] [CrossRef]
- Vandael, S.; Boucké, N.; Holvoet, T.; Deconinck, G. Decentralized demand side management of plug-in hybrid vehicles in a smart grid. In Proceedings of the First International Workshop on Agent Technologies for Energy Systems (ATES 2010), Toronto, ON, Canada, 9–14 May 2010; pp. 67–74. [Google Scholar]
- Soares, J.; Ghazvini, M.A.F.; Borges, N.; Vale, Z. Dynamic electricity pricing for electric vehicles using stochastic programming. Energy 2017, 122, 111–127. [Google Scholar] [CrossRef]
- Yang, Y.; Wang, M.; Liu, Y.; Zhang, L. Peak-off-peak load shifting: Are public willing to accept the peak and off-peak time of use electricity price? J. Clean. Prod. 2018, 199, 1066–1071.
- Uddin, M.; Romlie, M.F.; Abdullah, M.F.; Halim, S.A.; Kwang, T.C. A review on peak load shaving strategies. Renew. Sustain. Energy Rev. 2018, 82, 3323–3332. [Google Scholar] [CrossRef]
- Eid, C.; Koliou, E.; Valles, M.; Reneses, J.; Hakvoort, R. Time-based pricing and electricity demand response: Existing barriers and next steps. Util. Policy 2016, 40, 15–25.
- Nazar, N.; Abdullah, M.; Hassan, M.; Hussin, F. Time-based electricity pricing for Demand Response implementation in monopolized electricity market. In Proceedings of the 2012 IEEE Student Conference on Research and Development (SCOReD), Pulau Pinang, Malaysia, 5–6 December 2012; pp. 178–181.
- Dutta, G.; Mitra, K. A literature review on dynamic pricing of electricity. J. Oper. Res. Soc. 2017, 68, 1131–1145. [Google Scholar] [CrossRef]
- Simshauser, P.D.D. On the Inequity of Flat-Rate Electricity Tariffs. AGL Applied Economic and Policy Working Paper 2014. 2014. Available online: https://ideas.repec.org/a/aen/journl/ej37-3-simshauser.html (accessed on 6 August 2020).
- Latinopoulos, C.; Sivakumar, A.; Polak, J. Response of electric vehicle drivers to dynamic pricing of parking and charging services: Risky choice in early reservations. Transp. Res. Part C Emerg. Technol. 2017, 80, 175–189. [Google Scholar] [CrossRef]
- Tareen, W.U.K.; Waqar, A.; Mekhilef, S.; Nakaoka, M.; Seyedmahmoudian, M.; Horan, B.; Memon, M.A.; Baig, N.A. Mitigation of Power Quality Issues Due to High Penetration of Renewable Energy Sources in Electric Grid Systems Using Three-Phase APF/STATCOM Technologies: A Review. Energies 2018, 11, 1491. [Google Scholar] [CrossRef]
- Korolko, N.; Sahinoglu, Z. Robust optimization of EV charging schedules in unregulated electricity markets. IEEE Trans. Smart Grid 2015, 8, 149–157. [Google Scholar] [CrossRef]
- Soltani, N.Y.; Kim, S.-J.; Giannakis, G.B. Real-time load elasticity tracking and pricing for electric vehicle charging. IEEE Trans. Smart Grid 2014, 6, 1303–1313. [Google Scholar] [CrossRef]
- Nezamoddini, N.; Wang, Y. Real-time electricity pricing for industrial customers: Survey and case studies in the United States. Appl. Energy 2017, 195, 1023–1037.
- Mohsenian-Rad, A.-H.; Leon-Garcia, A. Optimal residential load control with price prediction in real-time electricity pricing environments. IEEE Trans. Smart Grid 2010, 1, 120–133. [Google Scholar] [CrossRef]
- Campillo, J.; Dahlquist, E.; Wallin, F.; Vassileva, I. Is real-time electricity pricing suitable for residential users without demand-side management? Energy 2016, 109, 310–325.
- Bitencourt, L.d.A.; Borba, B.S.; Maciel, R.S.; Fortes, M.Z.; Ferreira, V.H. Optimal EV charging and discharging control considering dynamic pricing. In Proceedings of the 2017 IEEE Manchester PowerTech, Manchester, UK, 18–22 June 2017; pp. 1–6.
- Newsham, G.R.; Bowker, B.G. The effect of utility time-varying pricing and load control strategies on residential summer peak electricity use: A review. Energy Policy 2010, 38, 3289–3296. [Google Scholar] [CrossRef]
- Yin, Y.; Zhou, M.; Li, G. Dynamic decision model of critical peak pricing considering electric vehicles’ charging load. In Proceedings of the International Conference on Renewable Power Generation (RPG 2015), Beijing, China, 17–18 October 2015.
- Mohajeryami, S.; Schwarz, P.; Baboli, P.T. Including the behavioral aspects of customers in demand response model: Real time pricing versus peak time rebate. In Proceedings of the 2015 North American Power Symposium (NAPS), Charlotte, NC, USA, 4–6 October 2015; pp. 1–6.
- Faruqui, A.; Palmer, J. The discovery of price responsiveness—A survey of experiments involving dynamic pricing of electricity. SSRN Electron. J. 2012.


