Your browser does not fully support modern features. Please upgrade for a smoother experience.
Submitted Successfully!
 +1 credit
Thank you for your contribution! You can also upload a video entry or images related to this topic.
For video creation, please contact our Academic Video Service.
| Version | Summary | Created by | Modification | Content Size | Created at | Operation |
|---|---|---|---|---|---|---|
| 1 | Mona Dabiri | -- | 2098 | 2022-11-23 19:40:58 | | | |
| 2 | Catherine Yang | Meta information modification | 2098 | 2022-11-24 02:38:27 | | |
Video Upload Options
We provide professional Academic Video Service to translate complex research into visually appealing presentations. Would you like to try it?
Cite
If you have any further questions, please contact Encyclopedia Editorial Office.
Dabiri, M.; Jehangir, M.; Khoshpouri, P.; Chalian, H. Imaging of Hypersensitivity Pneumonitis. Encyclopedia. Available online: https://encyclopedia.pub/entry/36134 (accessed on 06 June 2026).
Dabiri M, Jehangir M, Khoshpouri P, Chalian H. Imaging of Hypersensitivity Pneumonitis. Encyclopedia. Available at: https://encyclopedia.pub/entry/36134. Accessed June 06, 2026.
Dabiri, Mona, Maham Jehangir, Pegah Khoshpouri, Hamid Chalian. "Imaging of Hypersensitivity Pneumonitis" Encyclopedia, https://encyclopedia.pub/entry/36134 (accessed June 06, 2026).
Dabiri, M., Jehangir, M., Khoshpouri, P., & Chalian, H. (2022, November 23). Imaging of Hypersensitivity Pneumonitis. In Encyclopedia. https://encyclopedia.pub/entry/36134
Dabiri, Mona, et al. "Imaging of Hypersensitivity Pneumonitis." Encyclopedia. Web. 23 November, 2022.
Copy Citation
Hypersensitivity pneumonitis (HP) is a complicated and heterogeneous interstitial lung disease (ILD) caused by an excessive immune response to an inhaled antigen in susceptible individuals. HP, also previously known as extrinsic allergic alveolitis, is the culmination of a dysregulated immune response to a provocative inhaled antigen appearing as inflammation and/or fibrosis of the lung parenchyma and small airways.
hypersensitivity pneumonitis
thoracic imaging
fibrotic HP
1. Chest HRCT Scanning Protocol
The suggested scanning protocol for suspected HP examination is provided in the ATS/ERS/JRS/ALAT diagnosis-of-IPF guidelines [1]. It is based on high-resolution scanning of the chest, with particular care paid to parameter selection to ensure motion-free images and appropriate image quality at a low radiation dosage. Three sets of images are usually obtained for HRCT evaluation of ILD: (A) Axial scan in supine position after deep inspiration, for which helical (volumetric CT) acquisition is recommended. (B) Axial scan in supine position after prolonged expiration, for which one can employ volumetric scanning or incremental scanning. (C) Axial scan in prone position after deep inspiration which can also be obtained via volumetric or incremental scanning.
Incremental scanning in the prone position and expiratory phase imaging should be obtained with non-irradiated increments of 10–20 mm or more to decrease the radiation dose. Nominal slice thickness for axial and helical CT should be 1.5 mm or less. Gantry rotation speed of 1 s or less is acceptable. In volumetric acquisition, highest pitch, shortest rotation time, and sub-millimetric collimation should be used. Tube potential and tube current should be according to patient’s size, which is typically 120 kVp (kilovolt peak) and 240 mAs (milliampere-seconds) and/or less. For patients with a lower body size, lower tube potential (100 kVp) is recommended. Tube current modulation is used to decrease radiation exposure [2][3]. In order to solve image noise, iterative reconstruction techniques (with special caution) should be utilized [4]. Utilizing the high-spatial-frequency reconstruction algorithm (e.g., bone algorithm) is recommended. However, using a sharp reconstruction algorithm should be inhibited as it can create image noise [5]. Except for air trapping, which is an expiratory HRCT finding, all signs of lung infiltration can be seen on inspiratory images [2]. For accurate lung parenchyma and small airway evaluation, intravenous iodinated contrast should not be administered [6].
2. HRCT for Diagnosis of HP
There is a large spectrum of sensitivity and specificity in both BAL, tissue sampling, and serologic findings in HP. In addition, obtaining a thorough history of exposures to related antigens is difficult [7]. Therefore, this highlights the significance of HRCT for radiologists and pulmonologists, so that they can recognize fibrotic and non-fibrotic HP. HRCT is preferable due to its sensitivity to detect and evaluate lung abnormalities through suggesting radiographic patterns and distinguishing fibrosis [6]. Typical HP, Compatible with HP, and Indeterminate for HP are the classification schemes proposed by the ATS/JRS/ALAT Clinical Practice guideline for HRCT patterns related with NFHP and FHP [2].
The usual computed tomography (CT) presentations of HP are similar to the bronchiolocentric inflammation seen in histology, which results in small, ill-defined ground-glass nodules that are widely distributed throughout all lung zones. This bronchiolocentric inflammation may also cause minor airway constriction, resulting in lobular air-trapping. Ground-glass opacities and an increase in lung parenchyma density may result from more extensive interstitial inflammation, with vessels and bronchial walls remaining visible. This ground glass opacity usually has a patchy distribution in HP, which is referred to as mosaic attenuation [8] (Figure 1).
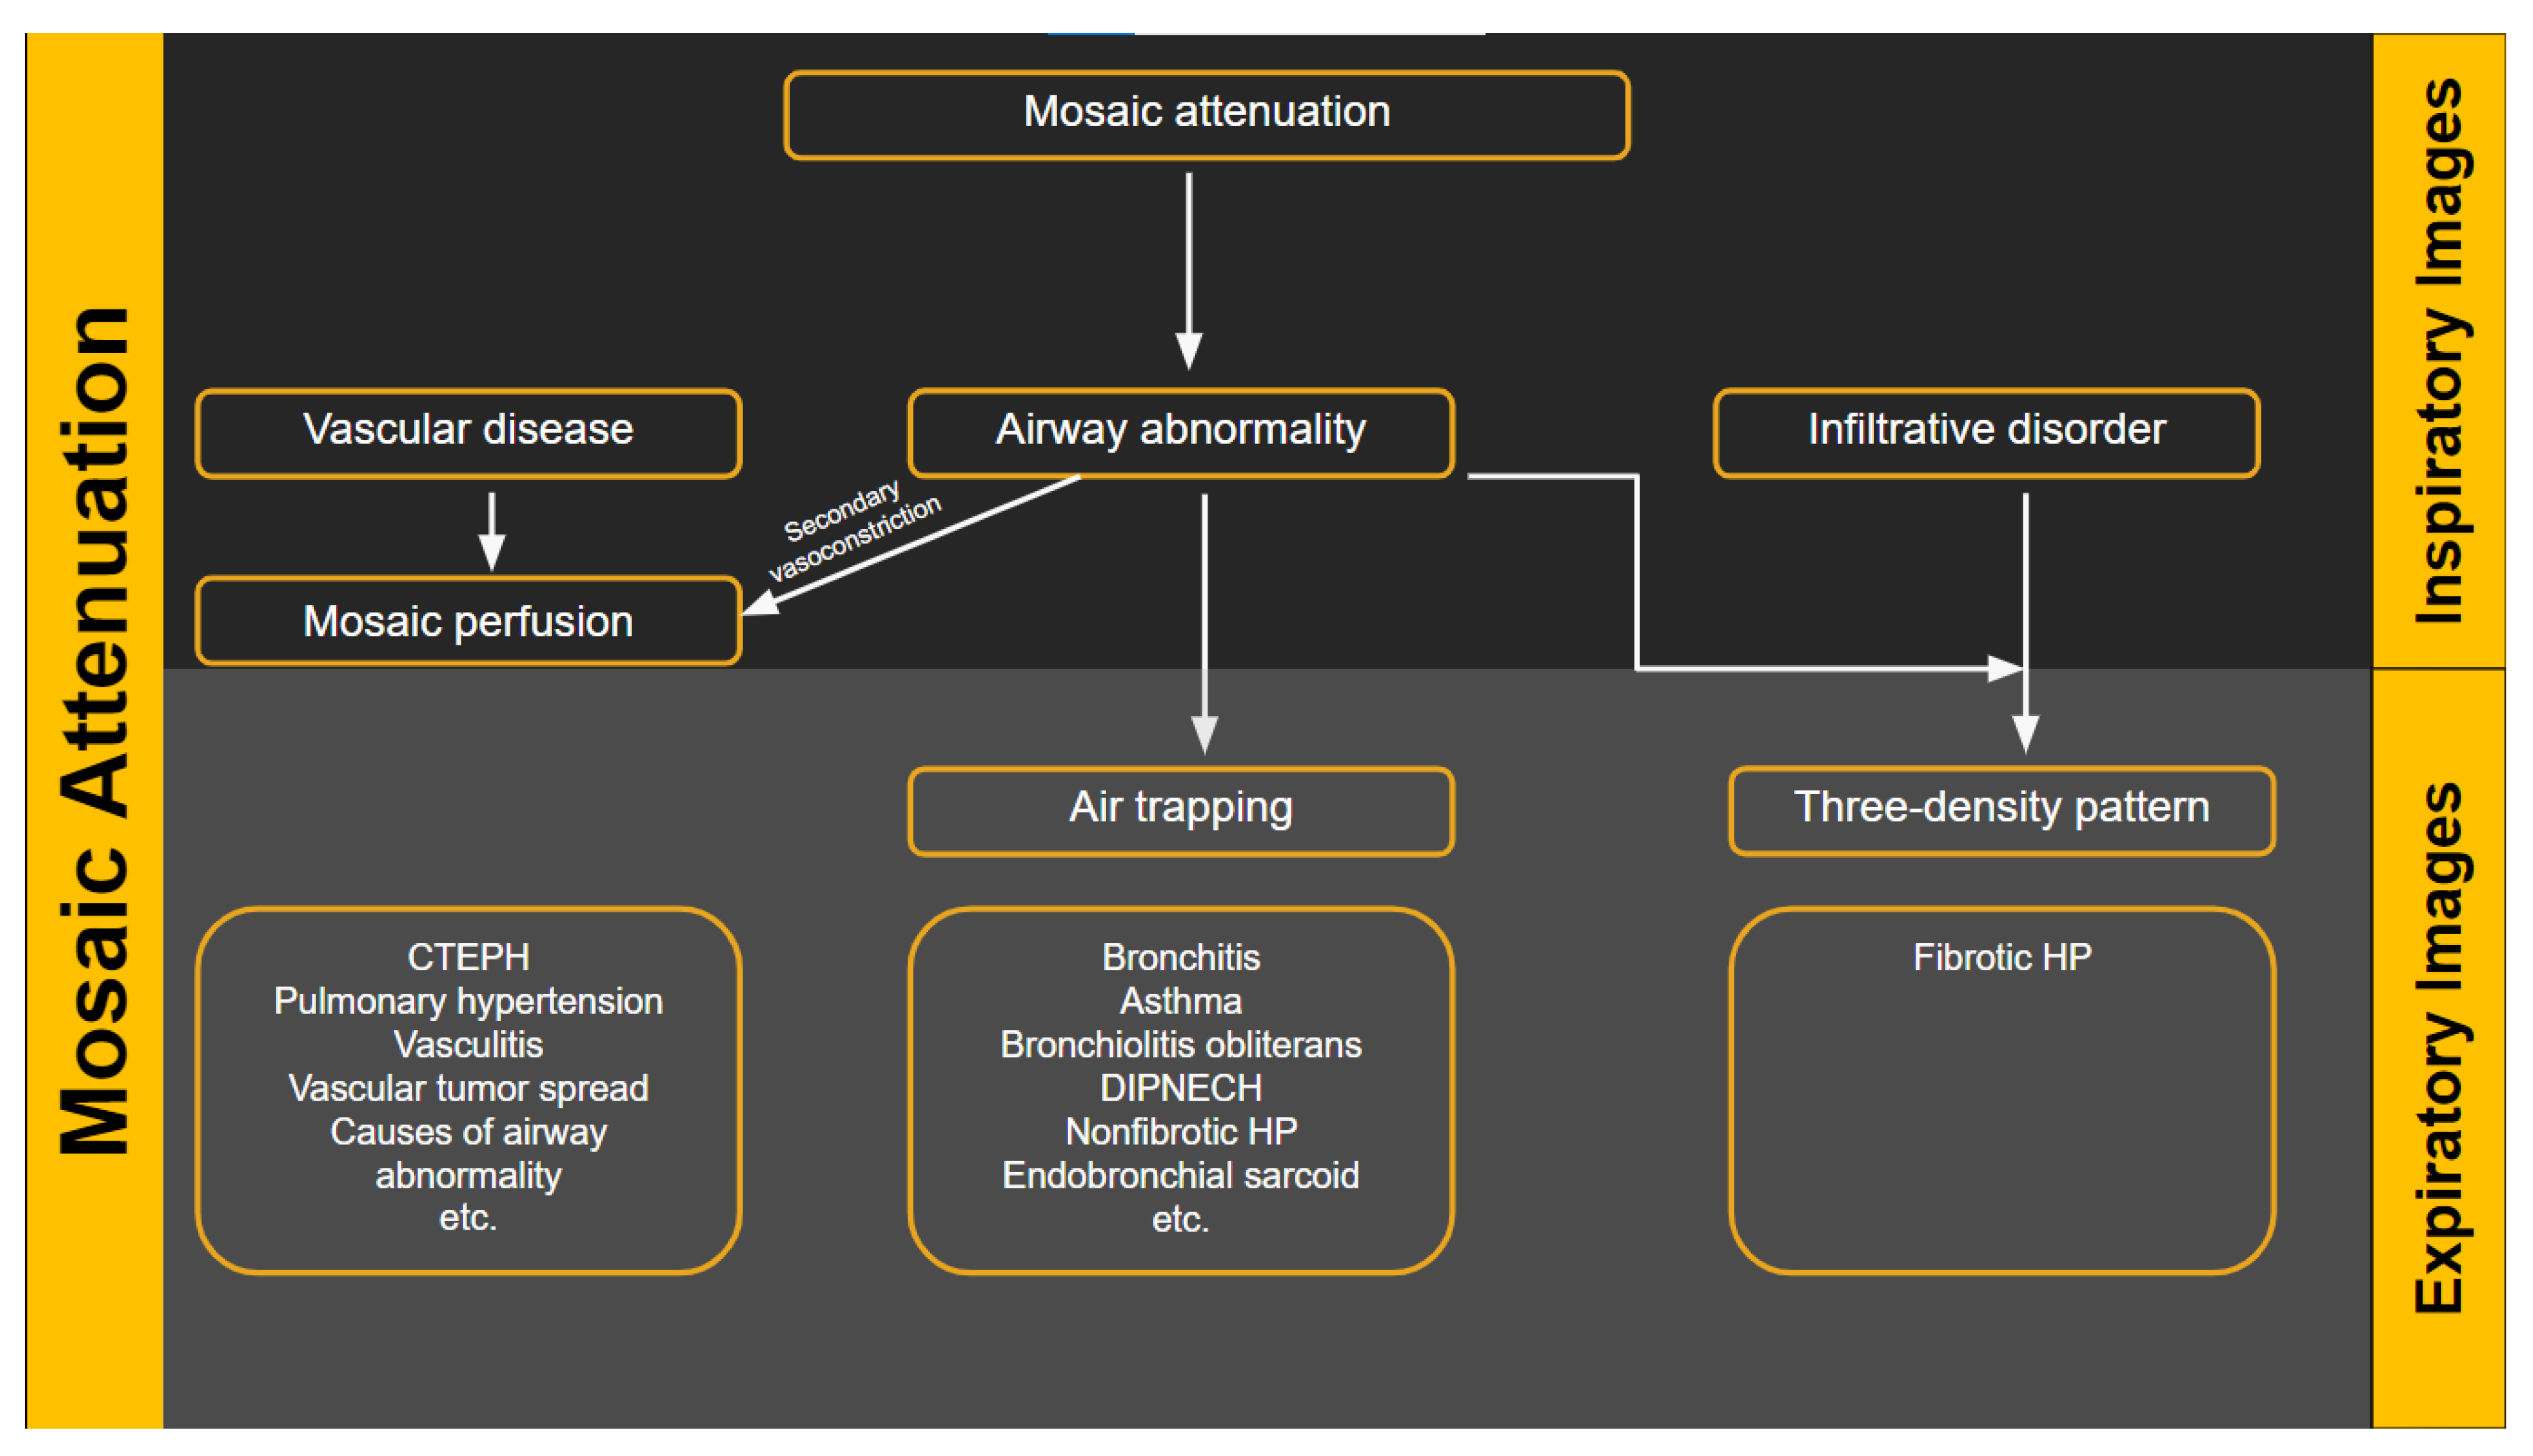
Figure 1. Flow diagram showing the heterogeneous lung attenuation patterns. Mosaic attenuation is a terminology reserved for inspiratory phase imaging and can be seen in vascular diseases, small airway disease or infiltrative diseases such as hypersensitivity pneumonitis. Mosaic perfusion is a feature of primary vascular disease but can also be seen with small airway disease due to hypoxic vasoconstriction.
According to the latest classification (according to the New ATS/JRS/ALAT Clinical Practice Guideline), HP is divided into fibrotic and non-fibrotic forms: NFHP is a mild form of HP compared to FHP. However, NFHP often progresses to fibrosis, yet is recurrent [9]. Diffuse infiltrative parenchymal abnormalities with GGO or mosaic attenuation, as well as at least one abnormality suggesting small airway disease (ill-defined, 5 mm centrilobular nodules on inspiratory images or air trapping on expiratory images) are important HRCT characteristics of Typical NFHP. Mosaic attenuation in NFHP is typically caused by lobules with pneumonitis (high attenuation) juxtaposed with lobules with normal or lower attenuation due to bronchial congestion. Features of uniform or subtle GGO, airspace consolidation, or lung cysts which are 3 to 25 mm [7], may be regarded as Compatible with NFHP in the appropriate clinical context [10]. These patterns are often bilateral and symmetric and diffuse both in the axial and craniocaudal views of the lungs.
Concomitant fibrosis and bronchiolar obstruction indicate FHP. Lung fibrosis is more common in the mid/lower lung zones in Typical FHP, or it is evenly distributed with basilar sparing and no central or peripheral predominance. Ill-defined centrilobular nodules, GGO, mosaic attenuation, air trapping, and/or the three-density pattern, which is highly specific for FHP, are all signs of bronchial obstruction [11]. HRCT features of Compatible with FHP show fibrosis pattern (UIP or extensive GGO with superimposed fibrosis) and distribution (upper lobe, peri-broncho-vascular, or subpleural predominance) of small airway disease, which is represented by ill-defined centrilobular nodules, or three-density pattern and/or air trapping on HRCT. Fibrosis without coexisting bronchial obstruction (UIP, nonspecific interstitial pneumonitis (NSIP), or organized pneumonia pattern) is indeterminate for FHP [10]. In patients with fibrotic HP without occupational exposure or history of smoking, emphysema is seen in more than 15% on chest radiographs, and 27% on HRCT [11].
Extensive lobular air trapping, centrilobular nodules, and the absence of a lower zone predominance to fibrosis can all assist in ruling out idiopathic pulmonary fibrosis (IPF) as a viable diagnosis [12].
3. Radiologic Terms for Heterogeneous Lung Attenuation
There are several radiologic terms linked with heterogeneous lung attenuation that need to be known and differentiated by radiologists to ensure correct final diagnosis in suspected HP cases. These include mosaic attenuation, air trapping, mosaic perfusion, and three-density pattern.
“Mosaic attenuation” is a term reserved for inspiratory phase CT. It is defined as sharply demarcated areas of low and high attenuation. Mosaic attenuation can be seen in vascular diseases, airway diseases, or infiltrative diseases [13] (Figure 1 and Figure 2). As opposed to mosaic attenuation, the term “air trapping” is only used on expiratory phase CT (Figure 1, Figure 2 and Figure 3). This term represents abnormal air retention distal to airway obstruction and manifests as areas of lucent lung on a background of normal relatively high attenuation lung parenchyma on expiratory imaging [2]. Like mosaic attenuation, the term “mosaic perfusion” (Figure 4) is also reserved for inspiratory CT. In mosaic perfusion abnormality, one may see a smaller caliber of the pulmonary vasculature within areas of low attenuation compared to normal vessel caliber in areas of higher attenuation. However, mosaic perfusion can be seen because of a vascular disease (pure perfusion abnormality), or in airway diseases where there is mosaic perfusion secondary to abnormal ventilation. Hence, the role of expiratory CT to aid differentiation of mosaic perfusion is secondary to vascular diseases from airway disease. If there is a similar gradient of attenuation between low and high attenuation areas on inspiratory and expiratory scans, mosaic perfusion is secondary to a vascular disease. If a higher attenuation gradient is measured on expiratory scans, an airway disease is the likely cause of mosaic perfusion [14].

Figure 2. Pictorial representation of heterogeneous lung attenuation patterns at the level of the secondary pulmonary lobule. Top panel shows expected appearance on inspiratory images and the bottom panel shows changes in lung parenchymal density on expiratory images. Notice that mosaic perfusion can be seen with primary vascular disease and small airway disease, with change in lobule size being the differentiating feature.
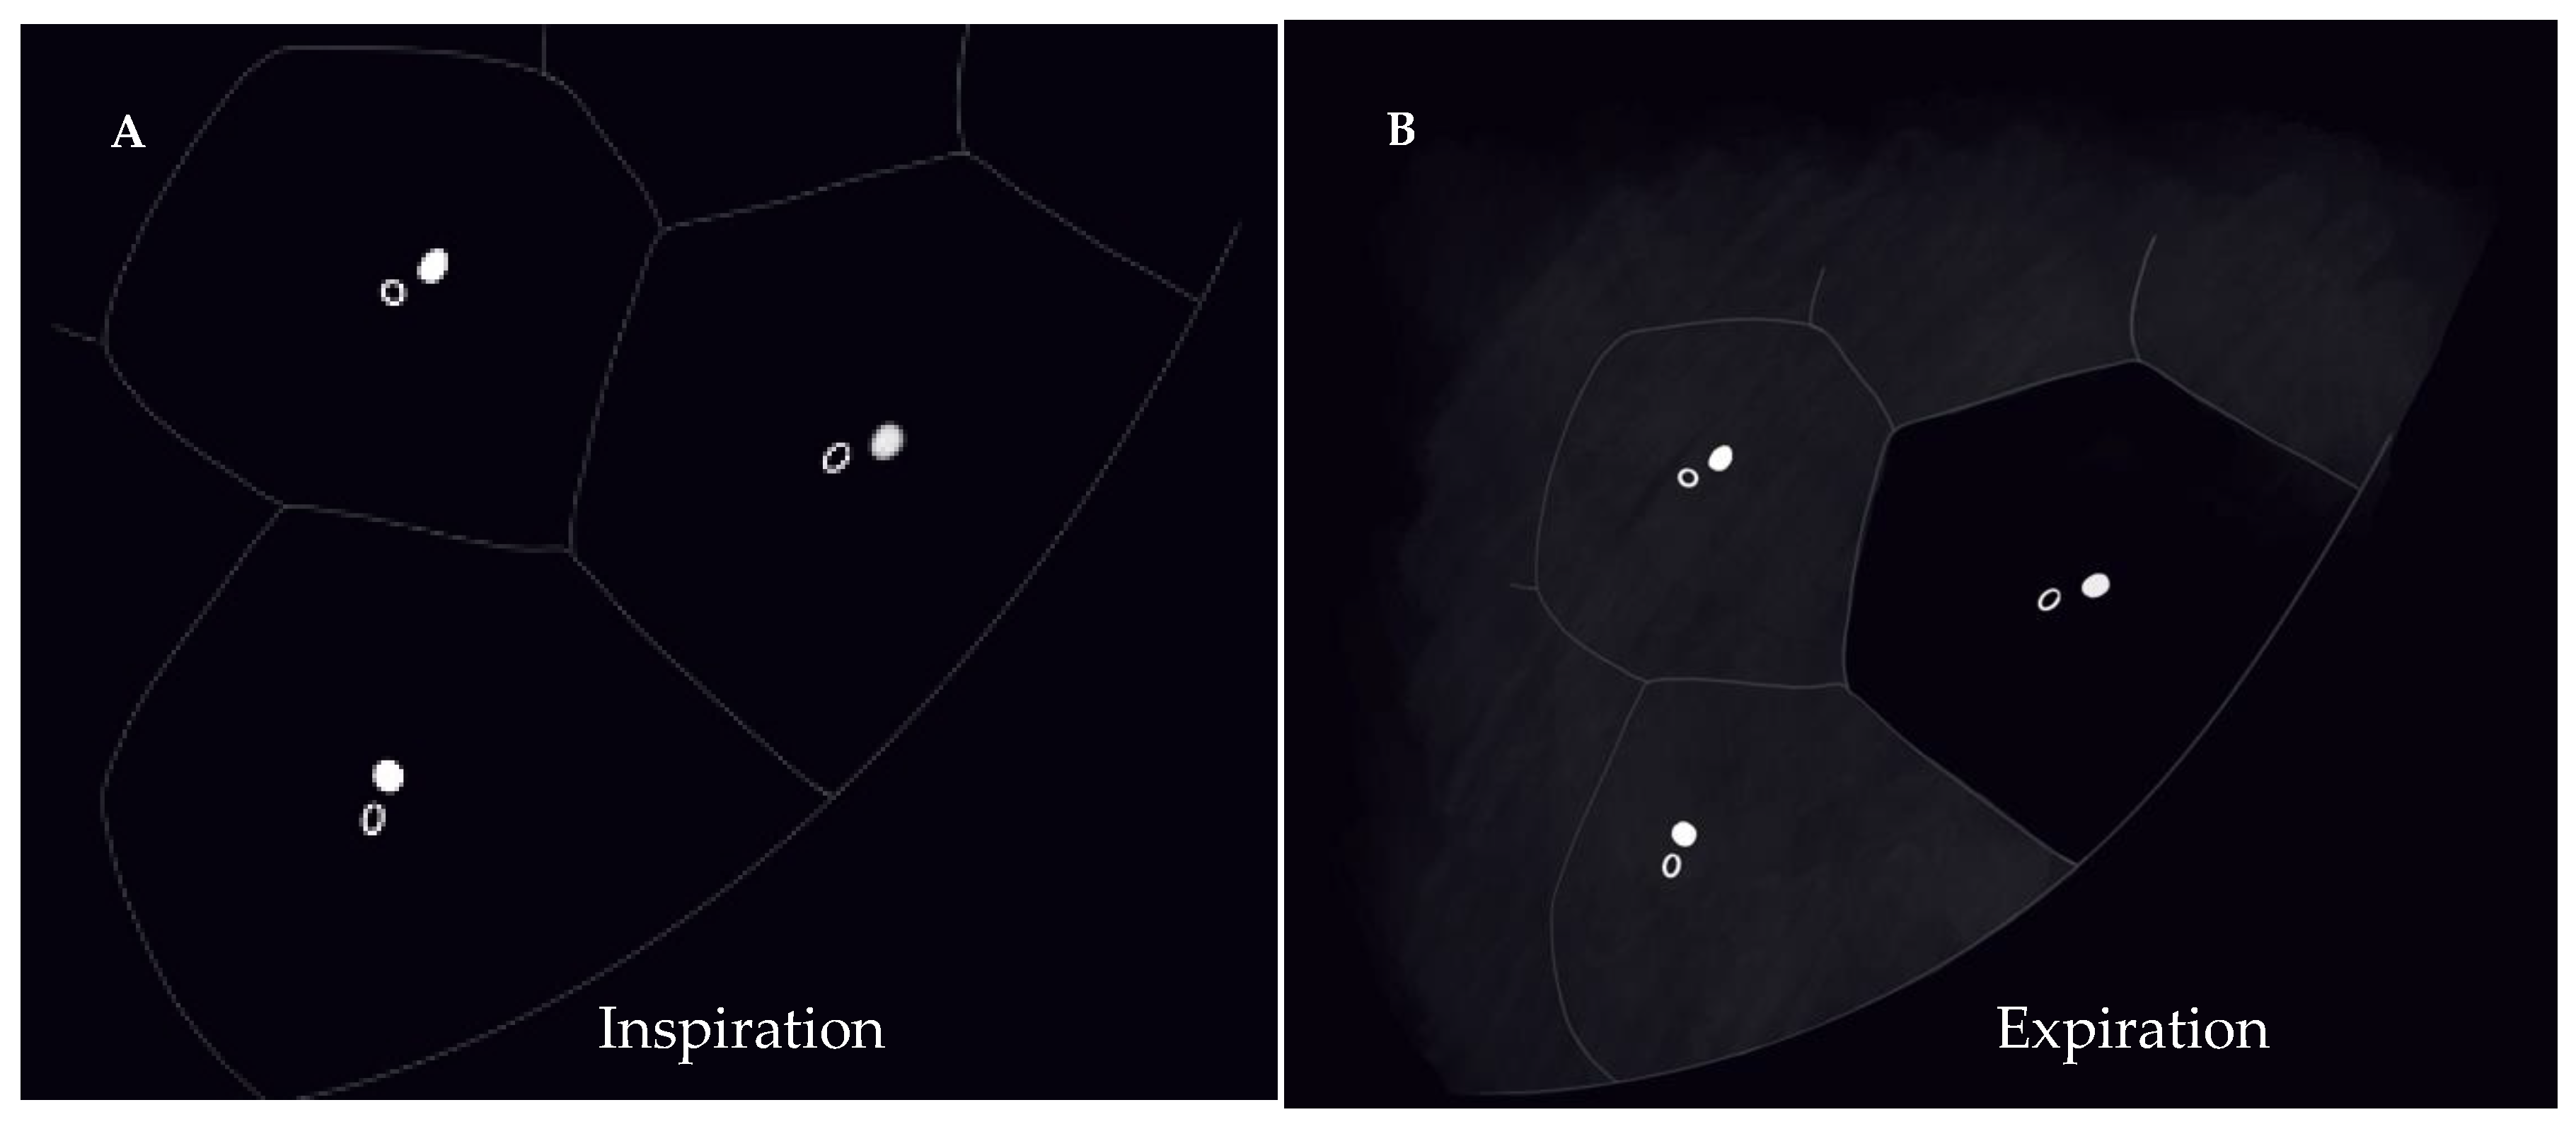
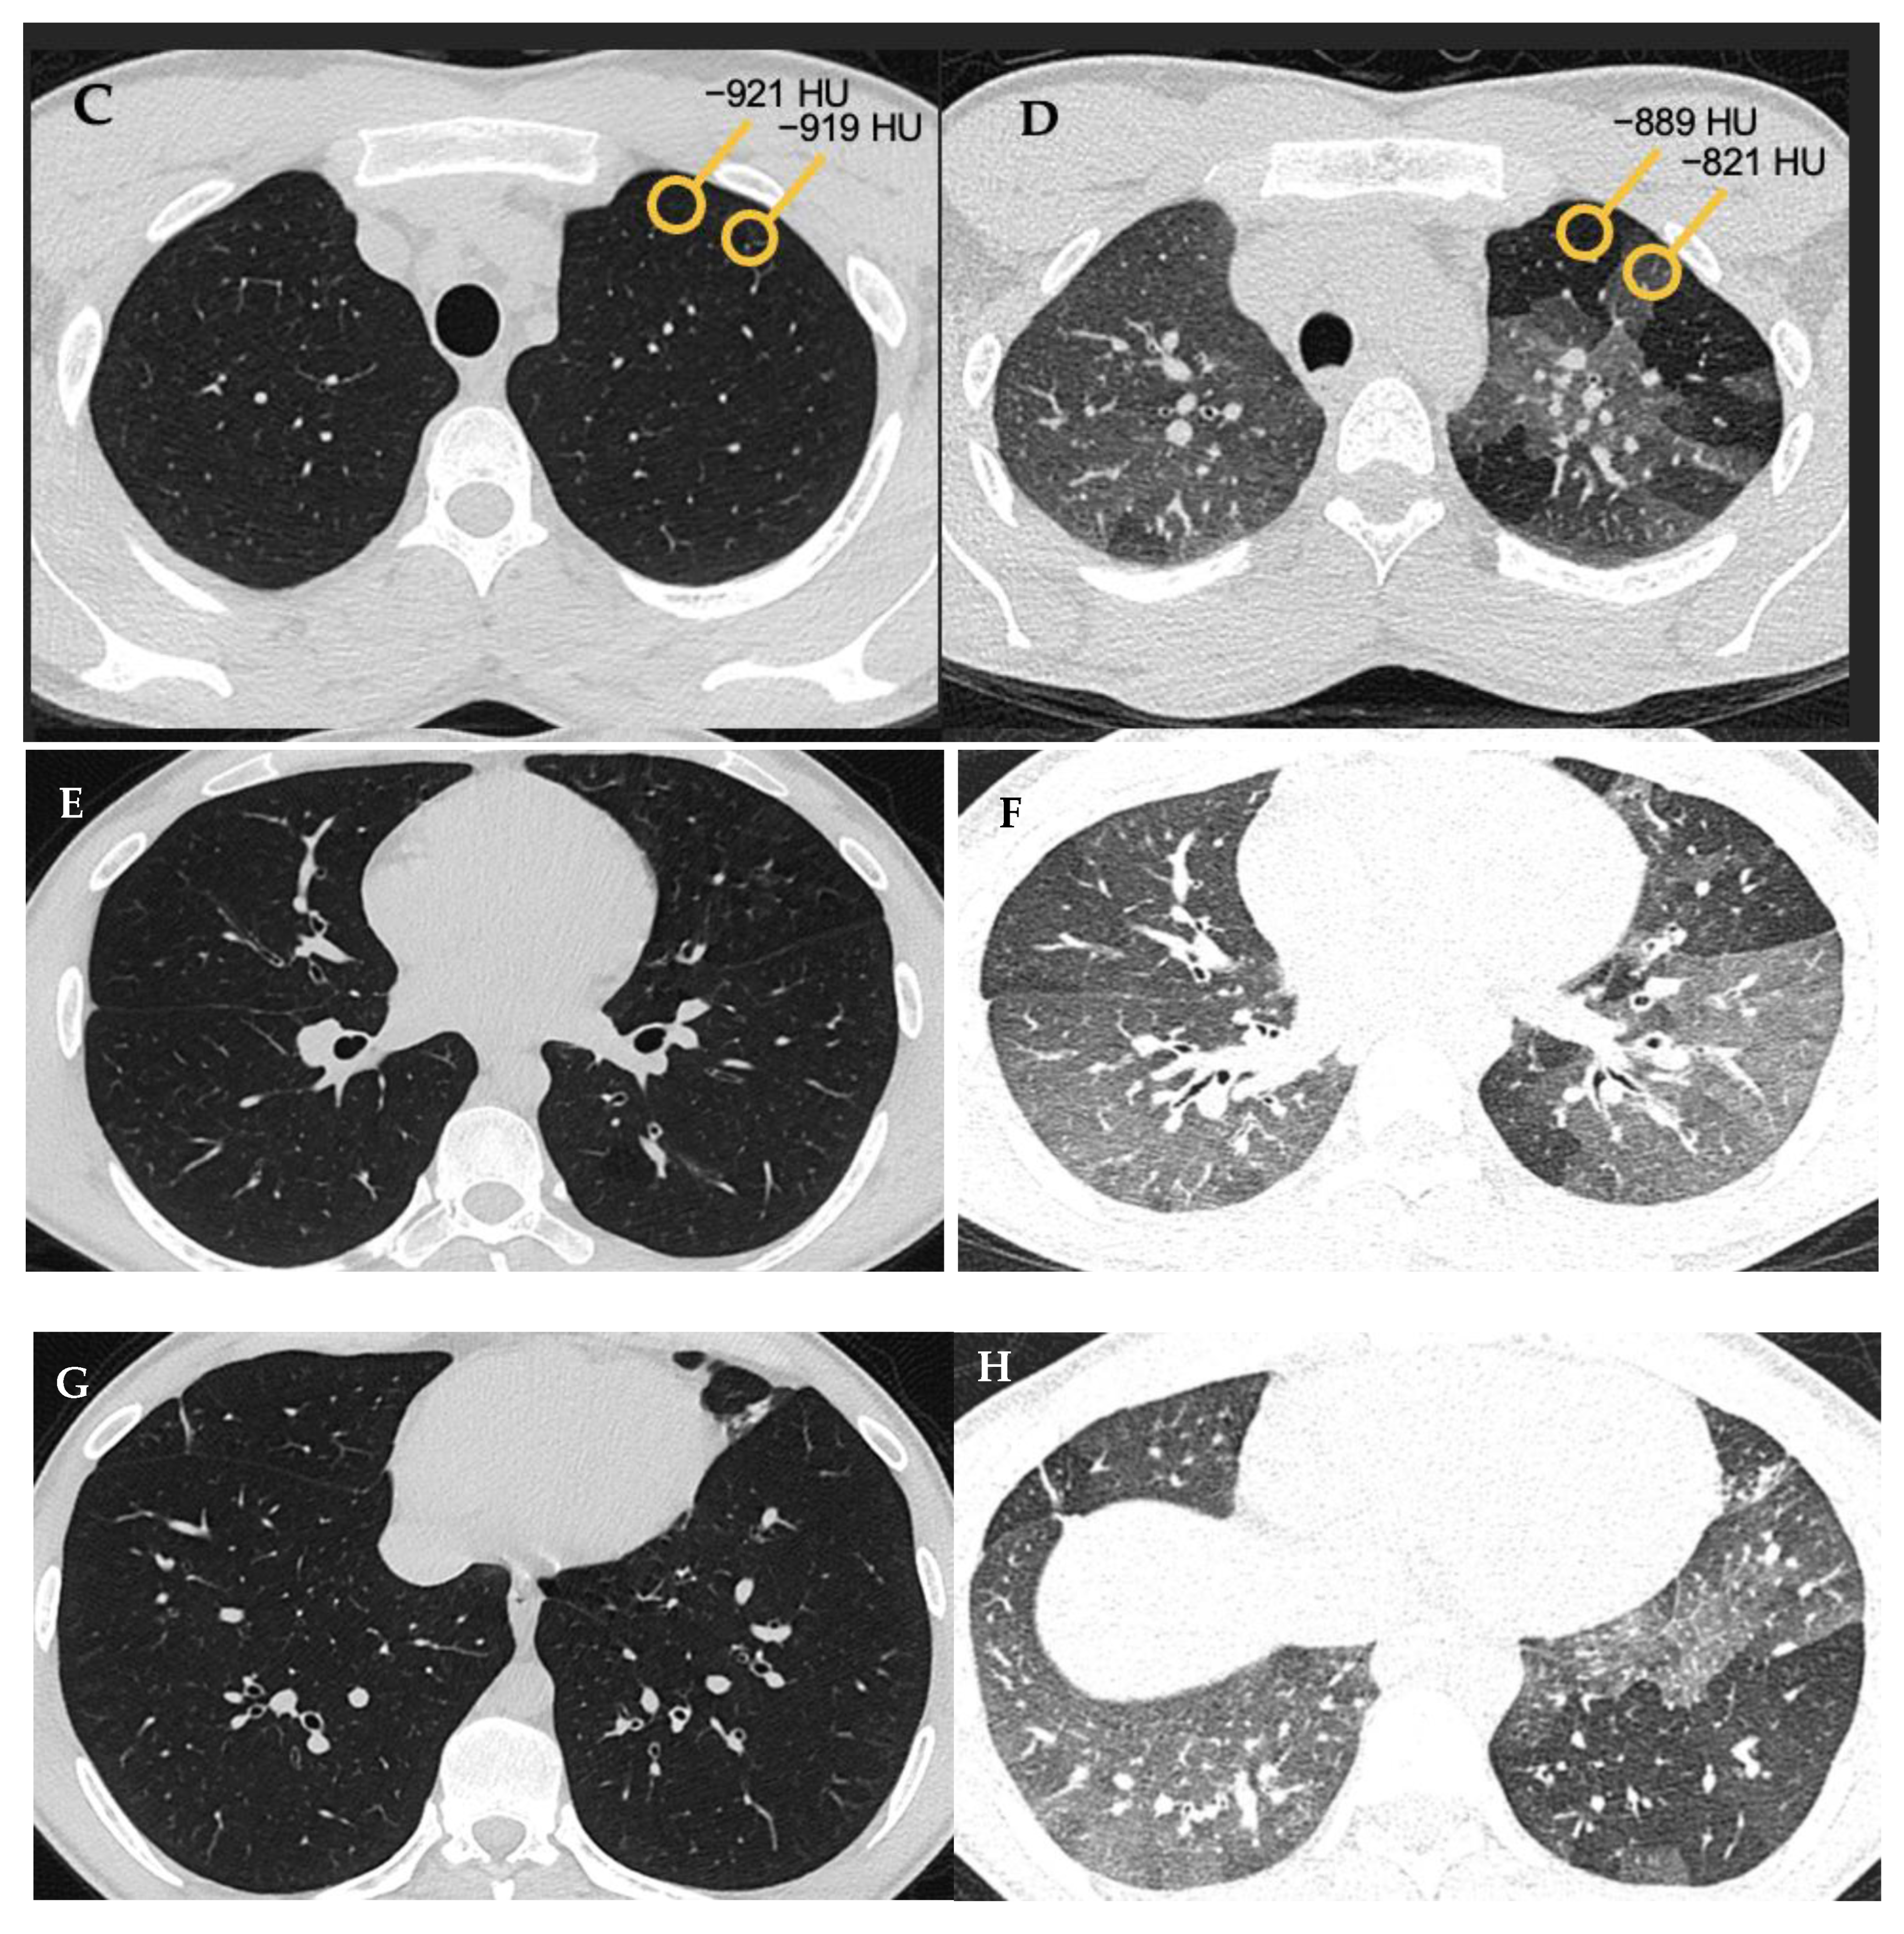
Figure 3. Air trapping (A,B). Axial inspiratory (A,C,E,G) and expiratory phase (B,D,F,H) CTs. On expiratory images the normal lung shows increase in the parenchymal density and decrease in volume. Interspersed geographic areas of air trapping lack the expected increase in density and volume reduction. Accentuated attenuation difference between areas of low and high density (32 versus 98 HU on image (C) and (D) respectively) indicates airway disease.

Figure 4. Mosaic perfusion (C). Axial (A) and coronal (B) inspiratory phase CTs show sharply demarcated regions of low attenuation (asterisk) interspersed in a background of normal (high) lung attenuation. Small caliber of vessels (short arrow) in the lucent areas relative to the normal lung vasculature (long arrow). Similar gradient of attenuation between low and high attenuation areas measuring 64 HU during inspiration (D) and 69 HU during expiration (E) indicating small vessel disease. Notice the expected decrease in volume of both hypo- and hyper-attenuating areas (E).
Given the fact that most people do not relate to the “headcheese” sign [15], the term “three-density pattern” (Figure 5 and Figure 6) is now a favored terminology. This term is used when there is both an obstructive and infiltrative process in addition to areas of normal lung parenchyma manifesting as clearly delineated zones with three different attenuations [16]. The manifestations of obstructive abnormalities are areas of decreased attenuation and decreased vascularity with no significant increase in attenuation on expiratory scans. Areas with an infiltrative disorder manifest as GGO or even consolidative opacities with increase in attenuation on expiratory scans. Areas of interposed normal lung present as demarcated normal lungs with expected increased attenuation on expiratory scans. Three-density pattern is specific for fibrotic HP [2][17].

Figure 5. Axial inspiratory phase CT image shows sharply demarcated regions of three attenuations (three-density pattern): (a) Normal-appearing lung; (b) Lucent lung (i.e., regions of decreased attenuation and decreased vascularity; (c) High attenuation GGO.

Figure 6. Three density pattern depicts simultaneous obstructive and infiltrative processes manifesting as air trapping (low density) and ground glass attenuation (high density), respectively, with areas of intervening normal lung parenchyma of intermediate density. Normal lung parenchyma (A) shows expected increased attenuation on expiration (B). Obstructive airway disease (air trapping) with decreased attenuation and vascularity on inspiration and expiration (C,D). GGO (E) with further increased attenuation on expiration (F).
4. HRCT Patterns of HP
Three categories of NFHP (Table 1, Figure 7) and FHP (Table 2, Figure 8, Figure 9, Figure 10 and Figure 11) have been described.
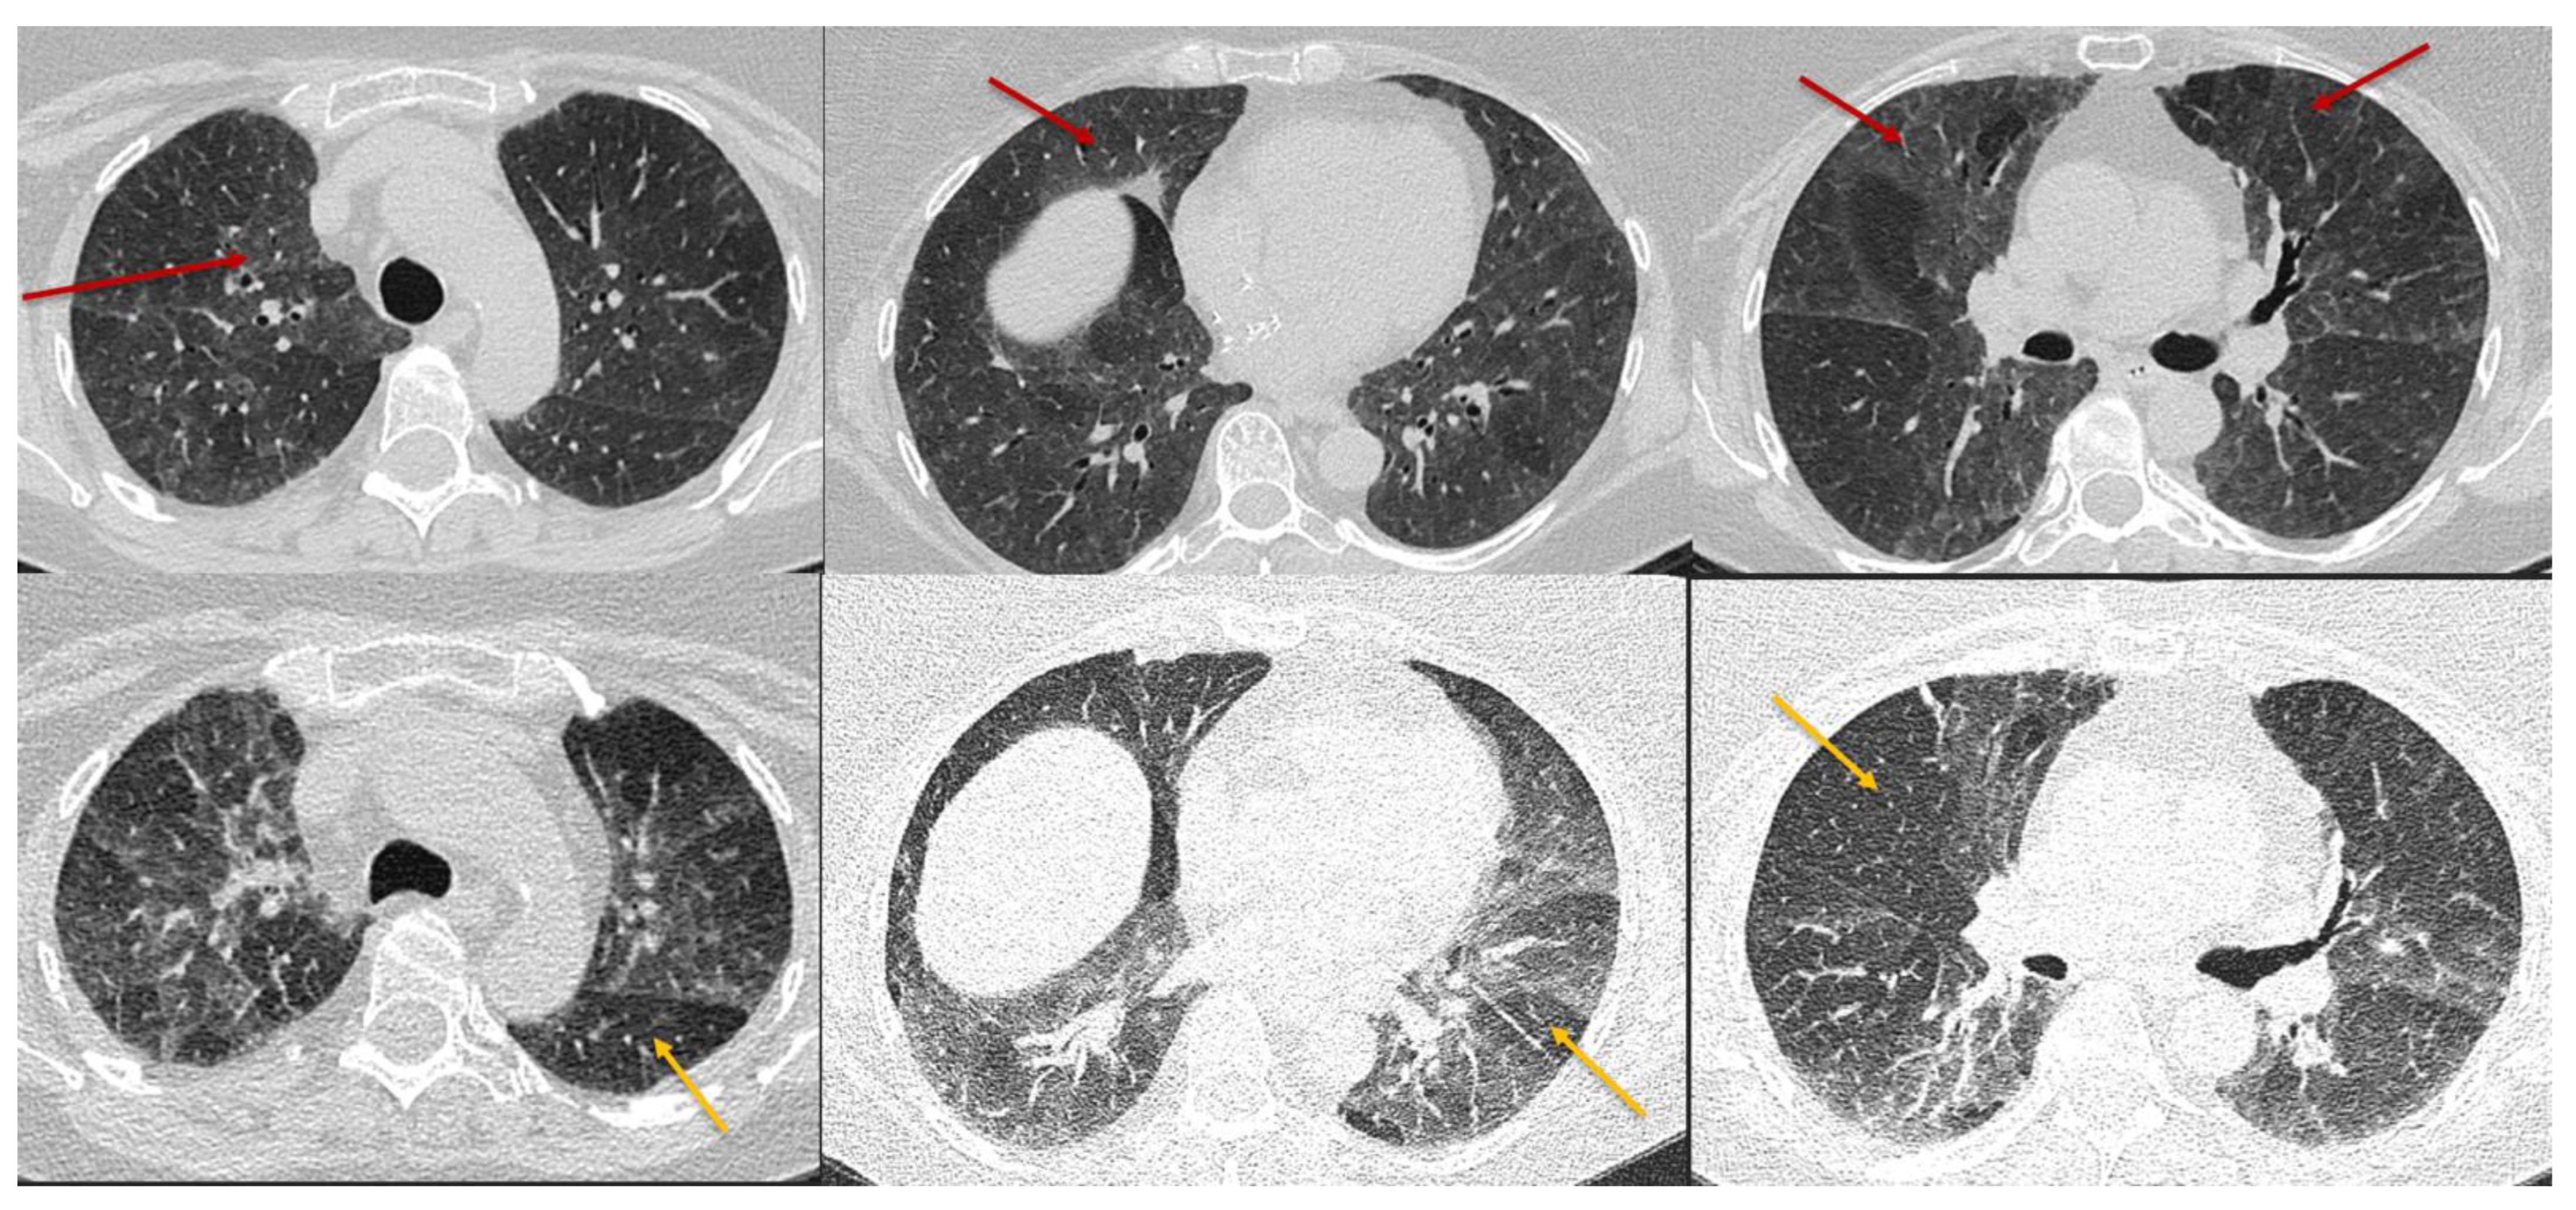
Figure 7. Typical non-fibrotic HP. Inspiratory phase CT (top row) shows ground glass opacities (red arrows) and expiratory phase CT (bottom row) shows air trapping (yellow arrows). Note the diffuse axial and craniocaudal distribution.

Figure 8. Typical fibrotic HP. Baseline CT (A) shows patchy GGOs. Follow up CT 3 years later (B–D) shows traction bronchiectasis (curved arrow), reticulations, patchy GGOs, and consolidations. Random axial and craniocaudal distribution of fibrosis. Axial inspiratory (C) and expiratory phase (D) shows three-density sign with expected increased attenuation of normal lung (short arrows) and GGOs (black asterisk). Lucent areas of decreased attenuation and vascularity depict air trapping (long arrow).
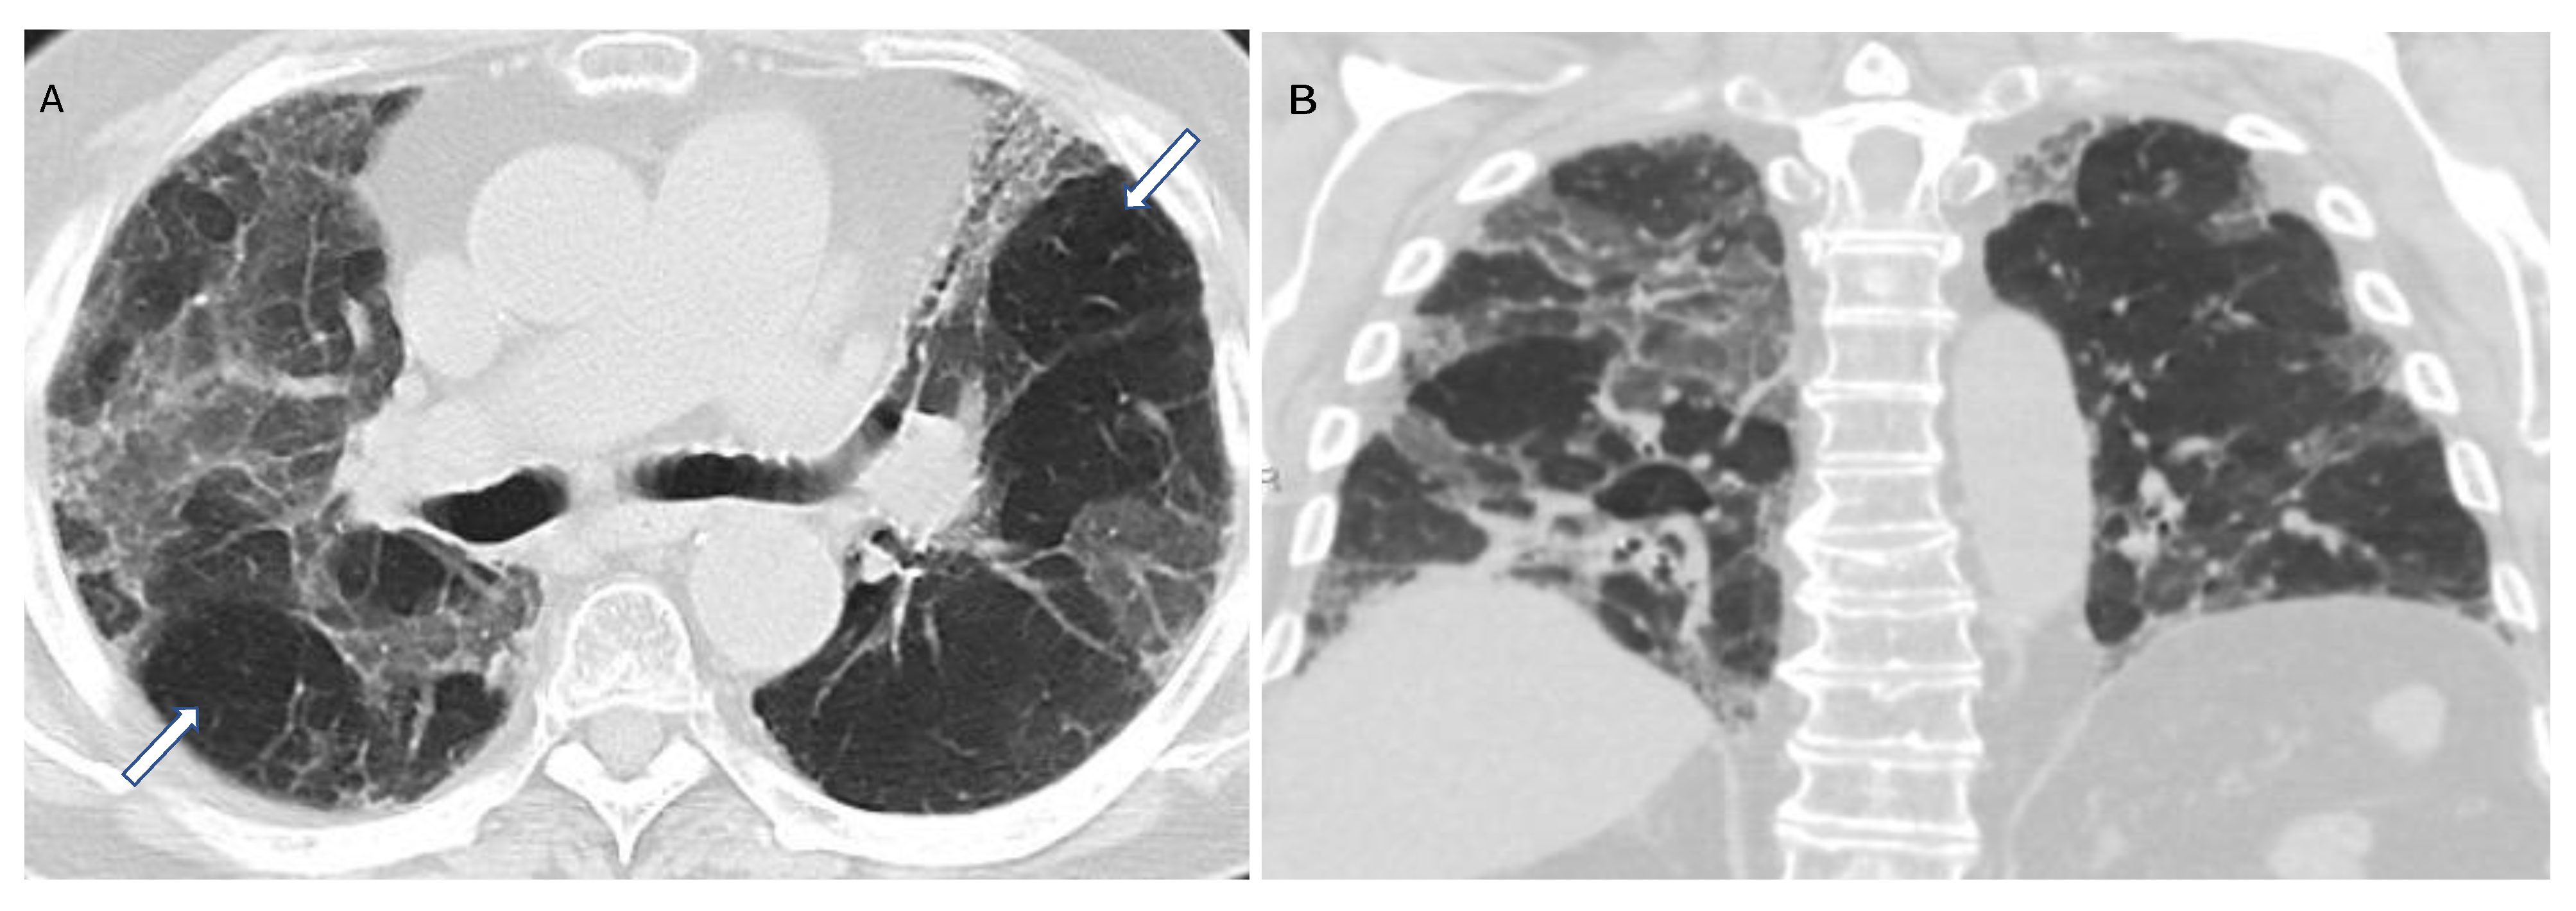
Figure 9. Compatible with fibrotic HP. Axial and coronal expiratory phase CT (A,B) shows coarse reticulations and minimal traction bronchiectasis superimposed on extensive upper lung predominant GGOs with peribronchovascular and subpleural distribution. Air trapping (arrows) is evident.

Figure 10. Compatible with fibrotic HP. Inspiratory phase CT (top row) shows ground glass opacities and subtle fibrosis. Note the variant upper lung predominant distribution. Expiratory phase CT (bottom row) shows air trapping (arrows).
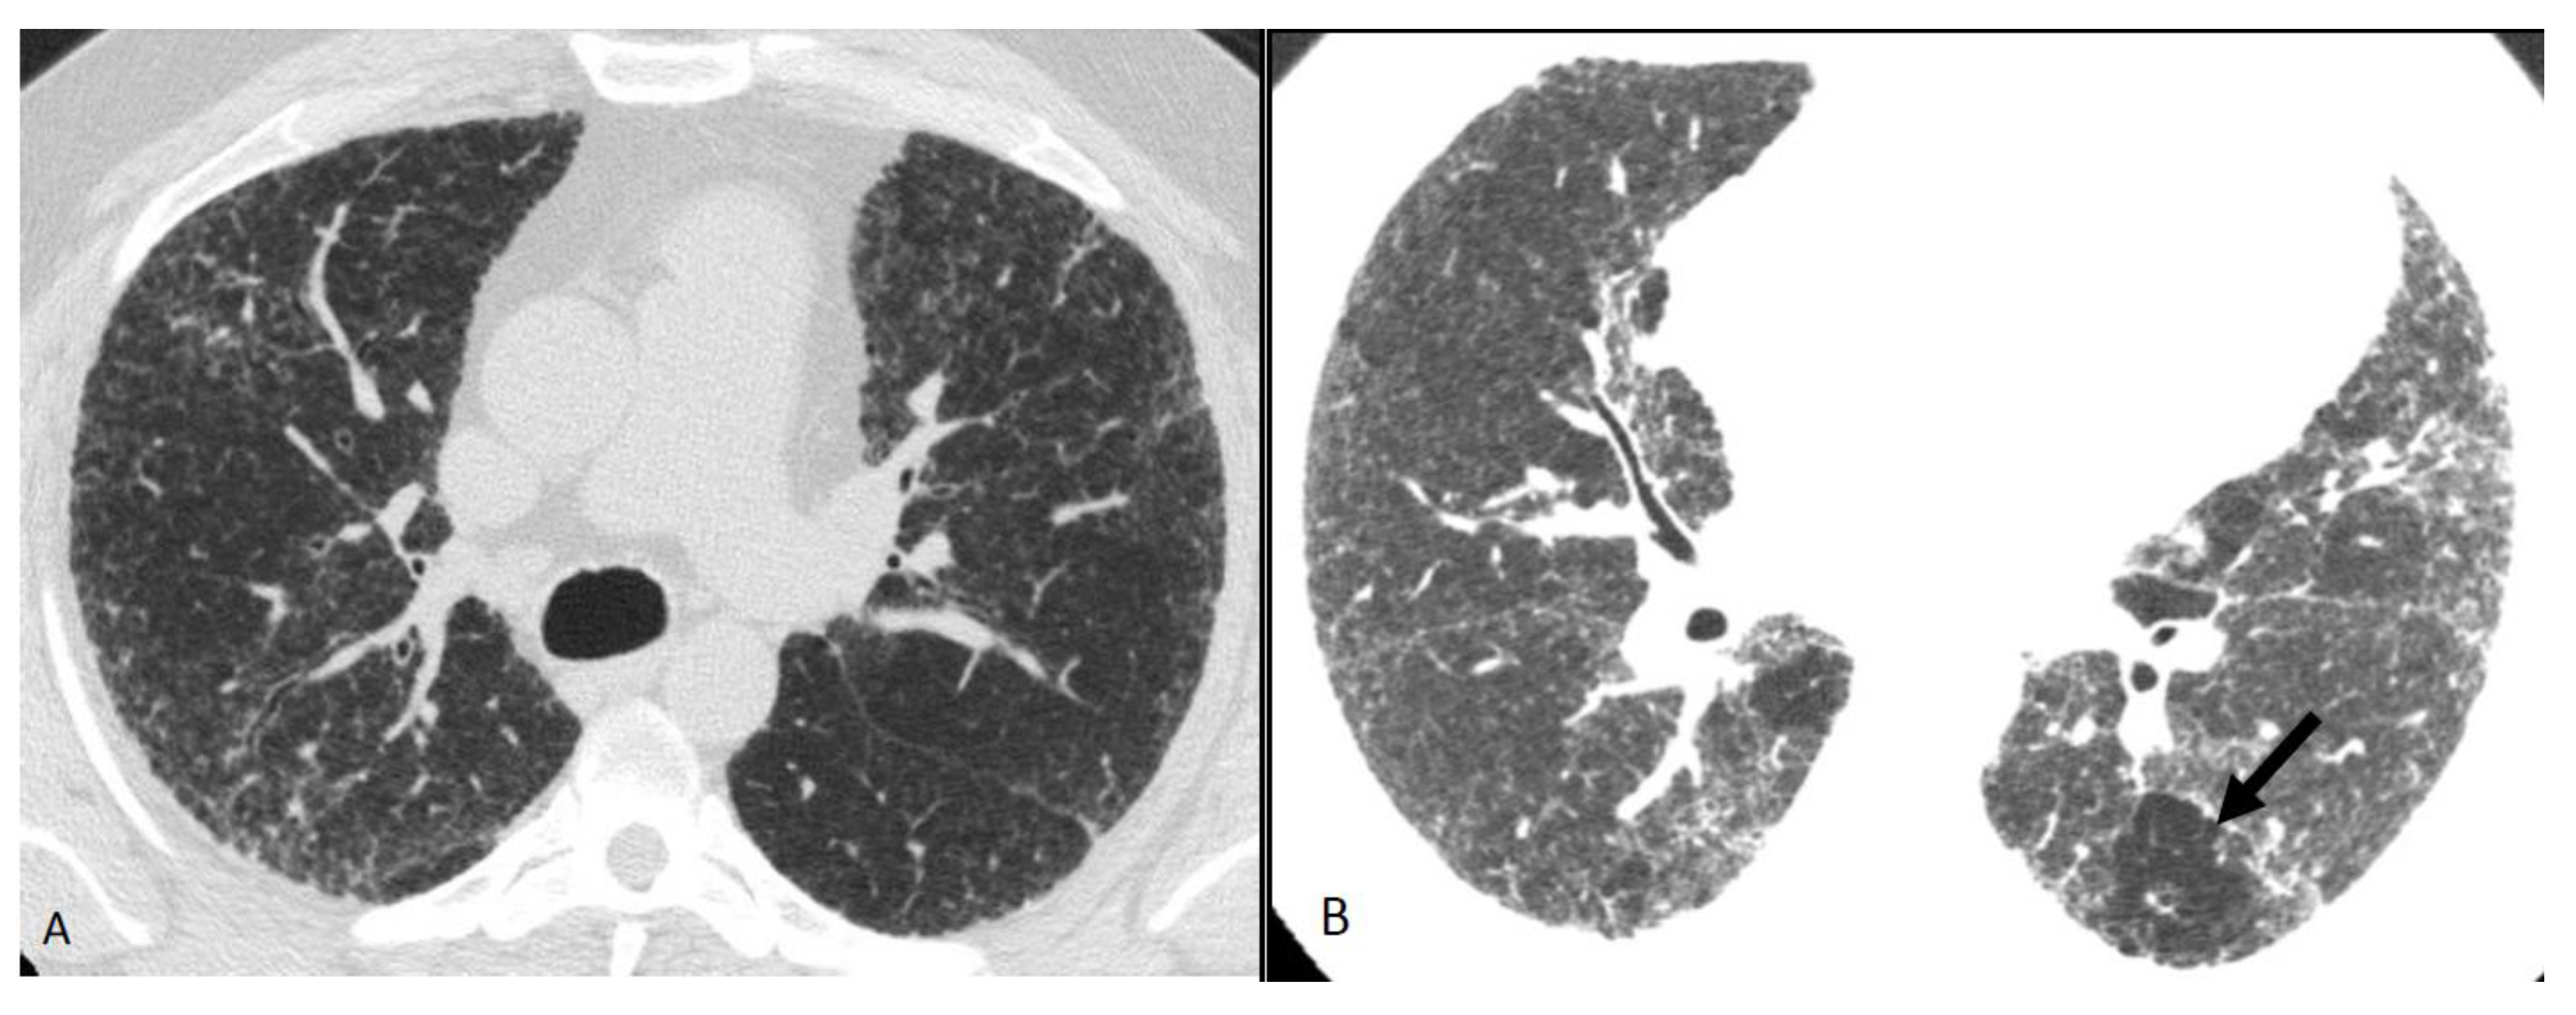
Figure 11. Compatible with fibrotic HP. Axial inspiratory phase CT shows (A) variant pattern of lung fibrosis with diffuse reticulations superimposed on a background of GGO and (B) lobular air trapping (arrow).
Table 1. Patterns of non-fibrotic HP on chest HRCT scan.
| Typical HP Pattern (Suggests a Diagnosis of HP) | Compatible with HP | Indeterminate for HP |
|---|---|---|
| At least one finding indicative of small airway disease | Not applicable | |
| Air trapping | ||
| Ill-defined <5 mm centrilobular nodules | ||
| At least one finding indicative of parenchymal infiltration | ||
| Mosaic attenuation | Diffuse and subtle GGO | |
| GGOs | Airspace consolidation | |
| Lung cysts | ||
| Distribution of findings | ||
| Craniocaudal: diffuse +/− basal sparing | Craniocaudal: diffuse (variant: lower lobe predominance) |
|
| Axial: diffuse | Axial: diffuse (variant: peribronchovascular) |
|
Table 2. Patterns of fibrotic HP on a chest HRCT scan.
| Typical HP Pattern (Suggests a Diagnosis of HP) | Compatible with HP | Indeterminate for HP |
|---|---|---|
| At least one finding indicative of small airway disease | At least one finding indicative of small airway disease | Neither Typical nor Compatible with HP |
| Three-density pattern | Three-density pattern | HRCT Patterns: UIP pattern Probably UIP pattern Indeterminate for UIP Fibrotic NSIP pattern OP like pattern Truly indeterminate pattern |
| Air trapping | Air trapping | |
| Ill-defined <5 mm centrilobular nodules | Ill-defined <5 mm centrilobular nodules | |
| At least one finding indicative of pulmonary fibrosis | Variant pattern of fibrosis | |
| Coarse reticulations with distortion | UIP pattern of fibrosis | |
| Traction bronchiectasis | Extensive GGO and superimposed subtle fibrosis | |
| Honeycombing (not dominant) | ||
| Distribution of findings | Variant distribution of fibrosis | |
| Random axially and craniocaudally | Craniocaudal: Upper lung zone predominant | |
| Mid zone predominant | Axial: peribronchovascular, subpleural | |
| Relative sparing of the bases |
References
- Raghu, G.; Remy-Jardin, M.; Myers, J.L.; Richeldi, L.; Ryerson, C.J.; Lederer, D.J.; Behr, J.; Cottin, V.; Danoff, S.K.; Morell, F. Diagnosis of idiopathic pulmonary fibrosis. An official ATS/ERS/JRS/ALAT clinical practice guideline. Am. J. Respir. Crit. Care Med. 2018, 198, e44–e68.
- Raghu, G.; Collard, H.; Egan, J.; Martinez, F.; Behr, J.; Brown, K.; Colby, T.; Cordier, J.; Flaherty, K.; Lynch, D. An official ATS/ERS/JRS/ALAT statement: Idiopathic pulmonary fibrosis: Evidence-based guidelines for diagnosis and management. Am. J. Respir. Crit. Care Med. 2011, 183, 788–824.
- Radiology, A.C.O. ACR-STR Practice Parameter for the Performance of High-Resolution Computed Tomography (HRCT) of the Lungs in Adults; The American College of Radiology: Reston, VA, USA, 2019.
- Pontana, F.; Billard, A.S.; Duhamel, A.; Schmidt, B.; Faivre, J.B.; Hachulla, E.; Matran, R.; Remy, J.; Remy-Jardin, M. Effect of Iterative Reconstruction on the Detection of Systemic Sclerosis-related Interstitial Lung Disease: Clinical Experience in 55 Patients. Radiology 2016, 279, 297–305.
- Winslow, J.; Zhang, Y.; Samei, E. A method for characterizing and matching CT image quality across CT scanners from different manufacturers. Med. Phys. 2017, 44, 5705–5717.
- King, T.; Nicholson, A. Hypersensitivity pneumonitis (extrinsic allergic alveolitis): Clinical manifestations and diagnosis. Up-to-Date. Retrieved Febr. 2019, 26, 2021.
- Moua, T.; Pentak, T.; Charokopos, A.; Baqir, M.; Ryu, J.H. Challenges in the Diagnosis and Management of Fibrotic Hypersensitivity Pneumonitis: A Practical Review of Current Approaches. J. Clin. Med. 2022, 11, 1473.
- Buendia-Roldan, I.; Aguilar-Duran, H.; Johannson, K.; Selman, M. Comparing the performance of two recommended criteria for establishing a diagnosis for hypersensitivity pneumonitis. Am. J. Respir. Crit. Care Med. 2021, 204, 865–868.
- Chavez-Galan, L.; Buendia-Roldan, I.; Castillo-Castillo, K.; Preciado-Garcia, M.; Ocana-Guzman, R.; Salgado, A.; Gaxiola, M.; Selman, M. Decreased expression of transmembrane TNFR2 in lung leukocytes subpopulations of patients with non-fibrotic hypersensitivity pneumonitis compared with the fibrotic disease. Clin. Immunol. 2020, 215, 108424.
- Richerson, H.B.; Bernstein, I.L.; Fink, J.N.; Hunninghake, G.W.; Novey, H.S.; Reed, C.E.; Salvaggio, J.E.; Schuyler, M.R.; Schwartz, H.J.; Stechschulte, D. Guidelines for the clinical evaluation of hypersensitivity pneumonitis: Report of the Subcommittee on Hypersensitivity Pneumonitis. J. Allergy Clin. Immunol. 1989, 84, 839–844.
- Baqir, M.; White, D.; Ryu, J.H. Emphysematous changes in hypersensitivity pneumonitis: A retrospective analysis of 12 patients. Respir. Med. Case Rep. 2018, 24, 25–29.
- Kouranos, V.; Jacob, J.; Nicholson, A.; Renzoni, E. Fibrotic hypersensitivity pneumonitis: Key issues in diagnosis and management. J. Clin. Med. 2017, 6, 62.
- Hansell, D.M.; Bankier, A.A.; MacMahon, H.; McLoud, T.C.; Muller, N.L.; Remy, J. Fleischner Society: Glossary of terms for thoracic imaging. Radiology 2008, 246, 697–722.
- Webb, W.R.; Müller, N.L.; Naidich, D.P. Standardized terms for high-resolution computed tomography of the lung: A proposed glossary. J. Thorac. Imaging 1993, 8, 167–175.
- Chung, M.H.; Edinburg, K.J.; Webb, E.M.; McCowin, M.; Webb, W.R. Mixed infiltrative and obstructive disease on high-resolution CT: Differential diagnosis and functional correlates in a consecutive series. J. Thorac. Imaging 2001, 16, 69–75.
- Barnett, J.; Molyneaux, P.L.; Rawal, B.; Abdullah, R.; Hare, S.S.; Vancheeswaran, R.; Desai, S.R.; Maher, T.M.; Wells, A.U.; Devaraj, A. Variable utility of mosaic attenuation to distinguish fibrotic hypersensitivity pneumonitis from idiopathic pulmonary fibrosis. Eur. Respir. J. 2019, 54, 1900531.
- Koster, M.A.; Thomson, C.C.; Collins, B.F.; Jenkins, A.R.; Ruminjo, J.K.; Raghu, G. Diagnosis of hypersensitivity pneumonitis in adults 2020 clinical practice guideline: Summary for clinicians. Ann. Am. Thorac. Soc. 2021, 18, 559–566.
More
Information
Contributors
MDPI registered users' name will be linked to their SciProfiles pages. To register with us, please refer to https://encyclopedia.pub/register
:
View Times:
1.9K
Revisions:
2 times
(View History)
Update Date:
24 Nov 2022
Table of Contents


Notice
You are not a member of the advisory board for this topic. If you want to update advisory board member profile, please contact office@encyclopedia.pub.
OK
Confirm
Only members of the Encyclopedia advisory board for this topic are allowed to note entries. Would you like to become an advisory board member of the Encyclopedia?
Yes
No
${ textCharacter }/${ maxCharacter }
Submit
Cancel
Back
Comments
${ item }
|
${ item.createdUser.fullName }
${ item.createdAt }
${ item.vote }
${ item.reply }
Delete
${ reply.createdUser.fullName }
${ reply.createdAt }
${ reply.vote }
Delete
There is no reply to this comment~
${ item.replyTextCharacter }/${ item.replyMaxCharacter }
Submit
Cancel
More
No more~
There is no comment~
${ textCharacter }/${ maxCharacter }
Submit
Cancel
${ selectedItem.replyTextCharacter }/${ selectedItem.replyMaxCharacter }
Submit
Cancel
Confirm
Are you sure to Delete?
Yes
No