Your browser does not fully support modern features. Please upgrade for a smoother experience.
Submitted Successfully!
 +1 credit
Thank you for your contribution! You can also upload a video entry or images related to this topic.
For video creation, please contact our Academic Video Service.
| Version | Summary | Created by | Modification | Content Size | Created at | Operation |
|---|---|---|---|---|---|---|
| 1 | Ali S Akanda | -- | 2594 | 2022-11-23 06:41:38 | | | |
| 2 | Lindsay Dong | + 1 word(s) | 2595 | 2022-11-23 09:59:00 | | | | |
| 3 | Cameron Murray | Meta information modification | 2595 | 2022-11-23 14:18:05 | | |
Video Upload Options
We provide professional Academic Video Service to translate complex research into visually appealing presentations. Would you like to try it?
Cite
If you have any further questions, please contact Encyclopedia Editorial Office.
Murray, C.; Larson, A.; Goodwill, J.; Wang, Y.; Cardace, D.; Akanda, A.S. Water Quality Observations from Space. Encyclopedia. Available online: https://encyclopedia.pub/entry/35963 (accessed on 24 June 2026).
Murray C, Larson A, Goodwill J, Wang Y, Cardace D, Akanda AS. Water Quality Observations from Space. Encyclopedia. Available at: https://encyclopedia.pub/entry/35963. Accessed June 24, 2026.
Murray, Cameron, Albert Larson, Joseph Goodwill, Yeqiao Wang, Dawn Cardace, Ali S. Akanda. "Water Quality Observations from Space" Encyclopedia, https://encyclopedia.pub/entry/35963 (accessed June 24, 2026).
Murray, C., Larson, A., Goodwill, J., Wang, Y., Cardace, D., & Akanda, A.S. (2022, November 23). Water Quality Observations from Space. In Encyclopedia. https://encyclopedia.pub/entry/35963
Murray, Cameron, et al. "Water Quality Observations from Space." Encyclopedia. Web. 23 November, 2022.
Copy Citation
Water is the basis of all life on this planet. Yet, approximately one in seven people in the world do not have access to safe water. Water can become unsafe due to contamination by various organic and inorganic compounds due to various natural and anthropogenic processes. Identifying and monitoring water quality changes in space and time remains a challenge, especially when contamination events occur over large geographic areas. Remote sensing makes it possible to monitor and identify large land and water bodies that suffer from quality problems more effectively and efficiently.
water quality
remote sensing
algal blooms
acid mine drainage
1. Introduction
Water is a valuable natural resource that is essential to human and environmental health. Earth’s drinking water sources are finite. Less than one percent of Earth’s freshwater is accessible to the human population. By 2050, the global demand for freshwater is expected to be one third higher than it is now [1]. Any changes to water quality could be detrimental, affecting aquatic habitats, recreation, drinking water, and agriculture. Climate change poses a significant risk to water quality as increasing temperatures and more intense precipitation and storm events promote eutrophication with increased sediment and nutrient inputs that throw off the balance of existing water systems [2]. Effective water monitoring programs are essential to address the consequences of present and future threats of contamination to water resources [3]. Although satellite remote sensing has been around and applied thoroughly in water quality research since the 1970s, utilizing them for regular water quality occurrences is still not a common practice.
The National Oceanic and Atmospheric Administration (NOAA) describes remote sensing as the act of collecting data by detecting the energy that is reflected from the Earth. Sensors can be aboard satellites or mounted on an aircraft. First used in the 1970s to observe the Great Lakes, data obtained from the Landsat mission explored and identified particulate contaminants, whiting events, and chlorophyll-a, or the greenness of waterbodies [4]. Since then, research on the application of remote sensing techniques for water quality monitoring has greatly expanded. The benefits of remote sensing are numerous. These sensors can deliver synoptic water quality observations over large areas, with frequent and consistent revisit times, and event-based monitoring. Combined with strong archival data systems, remotely sensed datasets enable both short-term time series analyses and long-term retrospective analyses dating back decades [4].
2. Satellite Technology
In remote sensing there are two categories of mechanical platforms that sensors are placed on. Airborne sensors are those mounted on platforms that remain within the Earth’s atmosphere, such as airplanes or drones. Spaceborne sensors are carried on satellites that orbit the Earth capturing images from outside the atmosphere [5]. Multi- and hyperspectral airborne data provides a highly flexible approach to remote sensing. They have higher spectral and spatial resolution than spaceborne sensing and can be configured according to the survey site [6]. Airborne data is good for water quality research because in situ testing can be easily coordinated with flyovers. However, airborne remote sensing can be complex and costly compared to spaceborne surveys. They require a great deal of planning in accordance with other air traffic, solar and weather conditions, and flight orientation [5]. They also cover smaller geographic areas at lower altitudes and data from these missions are not as publicly available as data from satellite remote sensors. Furthermore, they lack longevity in observation time, only collecting data for a short continuous period relative to spaceborne sensors. Spaceborne sensors are useful for studies requiring a longer continuous time series of data, such as climate studies and macroscopic weather forecasting. Image processing tends to be less complex and more automated than that of airborne sensors. Public policy has dictated that data from these sensors are more frequently offered free and available to all [7]. Compared to modern airborne sensors such as drone-based methods, spaceborne sensors have coarser spatial resolution, cloud cover can be limiting, and analyzing images may be more difficult due to file size resulting in over or underestimations of water quality parameters [8].
Landsat is by far the most well-known satellite utilized for water quality monitoring. Landsat offers the longest continuous global record of the Earth’s surface since the 1970s [4]. This National Aeronautics and Space Administration (NASA)/United States Geological Survey (USGS) joint venture mission is also the most refined (nine satellites and counting) and arguably the most reliable Earth observation satellite mission. Landsat’s main disadvantage is a long revisit time of sixteen days relative to the Sentinel mission’s five-day revisit time and the Moderate Resolution Imaging Spectrometer (MODIS) instruments aboard the Aqua and Terra satellites at two to three days.
The Landsat-8 satellite launched on February 11, 2013, and consists of two instruments, the Operational Land Imager (OLI) and the Thermal Infrared Sensor (TIRS). These sensors provide seasonal coverage of the globe in the visible, near infrared (NIR), short wave infrared (SWIR), and thermal infrared (TIR) spectrum [9].
NASA launched the Terra satellite on 18 December 1999, and Aqua on 4 May 2002 [10]. Both satellites carry a Moderate Resolution Imaging Spectrometer (MODIS), a cross-track scanning radiometer with thirty-six channels measuring visible and infrared spectral bands in the wavelength range of 400–14,500 nanometers. Terra and Aqua are sister satellites, programmed to work together to observe and process the entire Earth’s surface every 1–2 days. These satellites are aimed at monitoring the health of the planet, with Terra emphasizing land and Aqua emphasizing water [10]. The satellites have been preferred in the past for monitoring algal blooms. However, with a coarser spatial resolution of 250, 500, and 1000 m, monitoring becomes difficult in small and medium inland lakes [11]. MODIS is thus better suited for larger water bodies; the wide availability of bands and low revisit rates are valuable and have been used successfully in many studies observing primary productivity, chlorophyll fluorescence, suspended solids, sea surface temperature, and others.
3. Algal Blooms
Harmful algal blooms (HABs) have emerged as one of the most prevalent and severe environmental problems of inland water bodies in recent decades [12]. They are caused by microscopic, photosynthetic organisms that, like all other organisms, require sunlight and nutrients to grow. They are the foundation of food chains and webs in aquatic environments. When nutrient loading occurs from agricultural and urban runoff, the abundance of nutrients causes the concentrations of these microorganisms to grow uncontrollably, resulting in HABs [13]. Blooms typically occur in the spring when longer days provide stronger sunlight. Water warms and becomes less dense, allowing stratification. The upper stratified layer retains the bacteria where the sun is bright, and nutrients are plentiful [13].
Magnitude and frequency of HABs are increasing globally [13]. Early detection and comprehensive monitoring of HABs is needed to effectively manage and mitigate detrimental impacts [8]. In Ref. [14], research showed that air quality has improved drastically in the past thirty years. Acid rain occurrence has decreased across the Northern Hemisphere, decreasing sulfate deposition into surface waters. Previously, sulfate deposition contributed to changes in algal community abundance, spatial distribution, and taxonomic composition. However, studies conducted by Ref. [15] noted cyanobacteria were significantly reduced below pH 5.1 and increased during recovery at pH 5.5 and 5.8. As surface waters continue to recover from past sulfate deposition, algal communities may recover as well, a phenomenon to consider in future studies. Additionally, droughts, rising sea levels, increased withdrawal of freshwater or agricultural use, and application of road salt are all contributing to ideal conditions for cyanobacteria to thrive [16].
Before effective mitigation techniques can be taken, spatial and temporal distribution of HABs must be understood. While some algae move throughout the water column unnoticed, algae formed in calm weather on the surface can be detected [17]. Chlorophyll-a (Chl-a) pigments act as an optical signature of algal blooms. Chl-a mainly reflects green wavelengths, absorbing energy from violet-blue and orange-red wavelengths [18]. Satellite measurements of reflectance can pick up on the green wavelengths, presenting an efficient way for monitoring HABs [13]. Previously, in situ measurements of HABs were limited both spatially and temporally due to the time and cost involved. However, by utilizing satellite technology and its ability to pick up on optical signatures of water quality parameters, like the chlorophyll in HABs, alternative means of assessing HABs can be explored using remote sensing. It can be used to identify blooms and quantify abundance [19].
4. Acid Mine Drainage
According to the US Environmental Protection Agency, environmental risks due to acid mine drainage (AMD) are “second only to global warming and ozone depletion” [20]. Mining activities across the world cause environmental damage and changes to the earth’s surface and underground. According to recent studies, approximately 19,300 km of streams and rivers and about 720 km2 of lakes and reservoirs worldwide are affected by mine effluents [21]. In the US alone, thousands of abandoned coal mines have been polluting rivers and streams for decades, and only about a quarter of the damaged areas have been cleaned up in the past forty years [22]. Thus, AMD remains a critical water quality issue in need of improved remediation efforts.
Treatment of acid mine drainage is often complex, costly, and challenging and may vary with site conditions, composition of acid mine water, and treatment methods [23]. In 2021, the United States Senate passed an infrastructure bill providing $11.3 billion for cleanup of defunct coal mines to be distributed over fifteen years. The federal program funds cleanups in order of priority. Those that pose safety hazards to human health and pose risk to drinking water sources are at the top of the list. US officials estimate $10.6 billion in construction costs will be needed to fix more than 20,000 problems nationwide. However, there is controversy about whether such resources will be enough [23]. This presents an urgency to develop an efficient way of detecting priority waterbodies so action can be taken, and funding allocated appropriately. Remote sensing may prove to be a useful resource in this sense thanks to its accessibility, affordability, and wide spatial range.
Methodology for studies that utilized remote sensing technology to detect AMD varied vastly. Some studies used Landsat and Sentinel datasets while others utilized unmanned aerial systems. In many of these studies, relationships between spectral characteristics of contaminated water, measured pH, and total Fe concentrations have been found. AMD as well as technogenic sediment formed during acidification had higher spectral reflectance in wavelength ranges of 650–750 nm than neutral waters [24]. These characteristics can be utilized by satellite imaging like Landsat and Sentinel. The relatively high temporal resolution of Sentinel (3–4 images per week in cloud free conditions), and the availability of ten spectral bands in the visible near infrared region provide great potential for identifying AMD related water contamination [25].
Development of hyperspectral imaging has proved useful at expanding opportunities for remote sensing of AMD in both airborne and satellite-borne missions. Airborne hyperspectral data provides higher spatial and spectral resolution, crucial for identifying AMD [25]. Sensors can also detect AMD minerals within the water. These measurements can serve as proxies for low pH, acid mine waters, and mine waste byproducts. Ref. [6] used high resolution point clouds and digital elevation models built from drone data. The hyperspectral data was able to detect secondary AMD minerals. Specific iron absorption bands in the drone data were identified and features were confirmed by in situ spectroscopy and in situ pH results.
When using hyperspectral data, reference libraries can be utilized as in Ref. [26] to ensure the output of a reasonable map when diagnosing spectra. Referencing spectral libraries is a useful technique to assess oxidation or hydration stage of a mineral mixture. They also help establish statistical evaluations of scores produced by mineralogical diagnoses. Researchers restricted the map area so that contaminated areas can easily be detected, and patterns could be assessed to interpret climate change trends, metal contamination, and make AMD predictions. The study has established the potential of using hyperspectral satellite imagery for AMD detection.
Current research of remote sensing data in detecting and monitoring mine-related water pollution impacts is limited. There is a need for more research in the effective use of remote sensing techniques for understanding AMD relative to ground truth soil and water samples, as well as better integration of hyperspectral images with field data. Which bands are ideal for the detection of AMD? How and when might remote sensing measurements of AMD be skewed? Can remote sensing be used to determine the true spatial extent of AMD pollution events? There is a need for regular monitoring of AMD and water quality from refuse piles, mine tailings, and diffuse seeps to determine emerging problems, seek proper treatment designs, and reclaim mine sites for future use [23].
5. Suspended Sediments
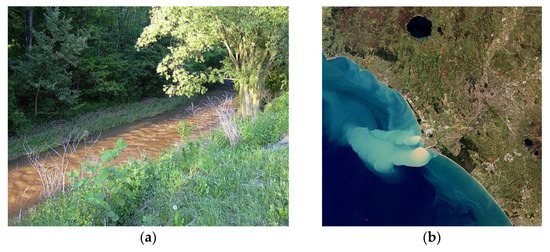
Light transmittance through water bodies is an important indicator of water quality and ecosystem health [27]. Suspended sediments, depicted in Figure 1, are a dominant water constituent in inland and coastal waters, making total suspended solids a key parameter to describe water transparency and quality [28]. Suspended Solid Concentrations (SSC) includes a wide range of particulate matter for the water column. The water column can contain organic matter, inorganic matter, and microorganisms that are insoluble in water. Each of these constituents pose a significant impact on spatial and temporal aspects of the optical properties of a water body [29]. As the world continues to urbanize, populations in coastal areas are growing rapidly [30]. This creates a growing need to monitor water quality in adjacent watersheds consisting of aquatic ecosystems like lakes, lagoons, and estuaries [31]. Human induced stresses are negatively affecting biological and physical processes in water bodies. Pollution, sediment accumulation and introduction of exotic biology break the ecological balance of these ecosystems. Suspended sediments reduce storage capacity of reservoirs, minimizing flood control and reduced light penetration to benthic aquatic communities [8]. Assessment of sediment influx is crucial to understanding processes that sustain water quality and geomorphic balance [31]. Degradation of lakes happens gradually, but once degraded, it can be nearly impossible to reverse the conditions [8]. Regular monitoring of suspended solid fluctuations is thus essential for understanding how they impact different ecosystems, effects on aquatic communities, and how the problems can be mitigated.
Figure 1. (a) Sediment transport; (b) River discharging sediment.
Secchi disks have been relied on for measurements of water transparency in field settings. However, this method can be both labor and cost intensive for large water bodies and typically has low sampling efficiency [32]. It is technically challenging to monitor SSC and distribution in large water bodies let alone numerous systems across large scale regions [33]. However, Secchi disk transparency has a strong correlation with satellite spectral-radiometric observation in lakes. Clearer water absorbs relatively little energy having wavelengths less than 600 nm, in the blue-green portion of the spectrum. As turbidity changes, transmittance, and reflectance change, resulting in much higher visible light reflectance. Lakes loaded with sediment reflect less blue and more red light. Overall, when the amount of blue light reflectance is high and red-light reflectance is low, this indicates good water quality [8]. Studies have found that the red to near infrared spectra is the most appropriate when monitoring suspended sediment concentrations. Red bands provide detailed information on horizontal distribution due to the effects of size, shape, and the texture of particles [31].
Satellite remote sensing can provide synoptic observations from visible to near infrared spectral regions, which can be used to derive suspended sediment concentrations in water [28]. The assessment of water’s optically active parameters relies on knowledge of the behavior of light in water. Molecular scattering of pure water follows a parabolic trend with higher values at short wavelengths, while absorption is highest in the red to infrared spectrum. Light scattering by suspended sediment strongly depends on the particle size, shape, and composition. The inorganic fraction of suspended sediments scatters light significantly while absorption is negligible [34]. Absorption and backscattering of light by suspended components influence the shape and magnitude of the water leaving reflectance, which is information that can be retrieved by remote sensing sensors [34].
References
- Denchak, M. Water Pollution: Everything You Need to Know. Available online: https://www.nrdc.org/stories/water-pollution-everything-you-need-know (accessed on 27 March 2022).
- Stroming, S.; Robertson, M.; Mabee, B.; Kuwayama, Y.; Schaeffer, B. Quantifying the human health benefits of using satellite information to detect cyanobacterial harmful algal blooms in US lakes. GeoHealth 2020, 4, e2020GH000254.
- Usali, N.; Ismail, M.H. Use of Remote Sensing and GIS in Monitoring Water Quality. J. Sustain. Dev. 2010, 3, 228.
- Binding, C.E.; Stumpf, R.P.; Shuchman, R.A.; Sayers, M.J. Advances in remote sensing of great lakes algal blooms. In Handbook of Environmental Chemistry; Springer: Berlin/Heidelberg, Germany, 2020; Volume 101.
- Gholizadeh, M.H.; Assefa, M.M.; Lakshmi, R. Spaceborne and airborne in water quality assessment. Intl. J. Remote Sensing 2016, 37, 3143–3180.
- Jackisch, R.; Lorenz, S.; Zimmermann, R.; Möckel, R.; Gloaguen, R. Drone-Borne Hyperspectral Monitoring of Acid Mine Drainage: An Example from the Sokolov Lignite District. Remote Sens. 2018, 10, 385.
- Schaeffer, B.A.; Schaeffer, K.G.; Keith, D.; Lunetta, R.S.; Conmy, R.; Gould, R.W. Barriers to adopting satellite remote sensing for water quality management. Int. J. Remote Sens. 2013, 34, 7534–7544.
- Li, R.; Li, J. Satellite remote sensing technology for lake water clarity monitoring: An overview. Environ. Inform. Arch. 2004, 2, 893–901.
- NASA. Landsat 8. NASA. Available online: https://landsat.gsfc.nasa.gov/satellites/landsat-8/ (accessed on 22 March 2022).
- Parkinson, C. Aqua: An Earth-Observing Satellite mission to examine water and other climate variables. IEEE Trans. Geosci. Remote Sens. 2003, 41, 173–183.
- Ma, J.; Jin, S.; Li, J.; He, Y.; Shang, W. Spatio-Temporal Variations and Driving Forces of Harmful Algal Blooms in Chaohu Lake: A Multi-Source Remote Sensing Approach. Remote Sens. 2021, 13, 427.
- Hou, X.; Feng, L.; Dai, Y.; Hu, C.; Gibson, L.; Tang, J.; Lee, Z.; Wang, Y.; Cai, X.; Liu, J.; et al. Global mapping reveals increase in lacustrine algal blooms over the past decade. Nat. Geosci. 2022, 15, 130–134.
- Klemas, V. Remote Sensing of Algal Blooms: An Overview with Case Studies. J. Coast. Res. 2012, 278, 34–43.
- Anderson, L.E.; Krkošek, W.H.; Stoddart, A.K.; Trueman, B.F.; Gagnon, G.A. Lake Recovery through Reduced Sulfate Deposition: A New Paradigm for Drinking Water Treatment. Environ. Sci. Technol. 2017, 51, 1414–1422.
- Findlay, D.L.; Kasian, S.E.M.; Turner, M.T.; Stainton, M.P. Responses of phytoplankton and epilithon during acidification and early recovery of a lake. Freshw. Biol. 1999, 42, 159–175.
- Paerl, H.W.; Huisman, J. Blooms like it hot. Science 2008, 320, 57–58.
- Shi, X.; Luo, X.; Jiao, J.J.; Zuo, J. Dominance of Evaporation on Lacustrine Groundwater Discharge to Regulate Lake Nutrient State and Algal Blooms. Water Res. 2022, 118620.
- Gholizadeh, M.H.; Assefa, M.M.; Lakshmi, R. A Comprehensive Review on Water Quality Parameters Estimation Using Remote Sensing Techniques. Sensors 2016, 16, 1298.
- Coffer, M.M.; Schaeffer, B.A.; Darling, J.A.; Urquhart, E.A.; Salls, W.B. Quantifying national and regional cyanobacterial occurrence in US lakes using satellite remote sensing. Ecol. Indic. 2019, 111, 105976.
- Moodley, I.; Sheridan, C.; Kappelmeyer, U.; Akcil, A. Environmentally sustainable acid mine drainage remediation: Research developments with a focus on waste/by-products. Miner. Eng. 2018, 126, 207–220.
- Blahwar, B.; Srivastav, S.; De Smeth, J. Use of high-resolution satellite imagery for investigating acid mine drainage from artisanal coal mining in North-Eastern India. Geocarto Int. 2012, 27, 231–247.
- Phillis, M. Cleanup of Abandoned Mines Could Get Boost, Relieving Rivers. In AP NEWS; Associated Press: New York, NY, USA, 20 September 2021; Available online: https://apnews.com/article/business-mountains-environment-and-nature-bills-bef72619fbd977e22c887df63143b17e (accessed on 14 November 2021).
- Acharya, B.S.; Kharel, G. Acid mine drainage from coal mining in the United States—An overview. J. Hydrol. 2020, 588, 125061.
- Pyankov, S.V.; Maximovich, N.G.; Khayrulina, E.A.; Berezina, O.A.; Shikhov, A.N.; Abdullin, R.K. Monitoring Acid Mine Drainage’s Effects on Surface Water in the Kizel Coal Basin with Sentinel-2 Satellite Images. Mine Water Environ. 2021, 40, 606–621.
- Kopačková, V. Mapping acid mine drainage (AMD) and acid sulfate soils using Sentinel-2. Intl. Geosci. Remote Sens. Symp. 2019, 5682–5685.
- Riaza, A.; Buzzi, J.; García-Meléndez, E.; Carrère, V.; Müller, A. Monitoring the Extent of Contamination from Acid Mine Drainage in the Iberian Pyrite Belt (SW Spain) Using Hyperspectral Imagery. Remote Sens. 2011, 3, 2166–2186.
- Cui, Y.; Yan, Z.; Wang, J.; Hao, S.; Liu, Y. Deep learning–based remote sensing estimation of water transparency in shallow lakes by combining Landsat 8 and Sentinel 2 images. Environ. Sci. Pollut. Res. 2022, 29, 4401–4413.
- Liu, H.; Li, Q.; Shi, T.; Hu, S.; Wu, G.; Zhou, Q. Application of Sentinel 2 MSI Images to Retrieve Suspended Particulate Matter Concentrations in Poyang Lake. Remote Sens. 2017, 9, 761.
- Blix, K.; Pálffy, K.; Tóth, V.R.; Eltoft, T. Remote Sensing of Water Quality Parameters over Lake Balaton by Using Sentinel-3 OLCI. Water 2018, 10, 1428.
- Akanda, A.S.; Hossain, F. The climate-water-health nexus in emerging megacities. Eos 2012, 93, 353–354.
- Jally, S.K.; Mishra, A.K.; Balabantaray, S. Retrieval of suspended sediment concentration of the Chilika Lake, India using Landsat-8 OLI satellite data. Environ. Earth Sci. 2021, 80, 1–18.
- Peterson, K.T.; Sagan, V.; Sloan, J.J. Deep learning-based water quality estimation and anomaly detection using Landsat-8/Sentinel-2 virtual constellation and cloud computing. GIScience Remote Sens. 2020, 57, 510–525.
- Du, Y.; Song, K.; Wang, Q.; Li, S.; Wen, Z.; Liu, G.; Tao, H.; Shang, Y.; Hou, J.; Lyu, L.; et al. Total suspended solids characterization and management implications for lakes in East China. Sci. Total Environ. 2022, 806, 151374.
- Giardino, C.; Bresciani, M.; Stroppiana, D.; Oggioni, A.; Morabito, G. Optical remote sensing of lakes: An overview on Lake Maggiore. J. Limnol. 2014, 73, 201–214.
More
Information
Subjects:
Water Resources
Contributors
MDPI registered users' name will be linked to their SciProfiles pages. To register with us, please refer to https://encyclopedia.pub/register
:
View Times:
1.0K
Revisions:
3 times
(View History)
Update Date:
23 Nov 2022
Table of Contents


Notice
You are not a member of the advisory board for this topic. If you want to update advisory board member profile, please contact office@encyclopedia.pub.
OK
Confirm
Only members of the Encyclopedia advisory board for this topic are allowed to note entries. Would you like to become an advisory board member of the Encyclopedia?
Yes
No
${ textCharacter }/${ maxCharacter }
Submit
Cancel
Back
Comments
${ item }
|
${ item.createdUser.fullName }
${ item.createdAt }
${ item.vote }
${ item.reply }
Delete
${ reply.createdUser.fullName }
${ reply.createdAt }
${ reply.vote }
Delete
There is no reply to this comment~
${ item.replyTextCharacter }/${ item.replyMaxCharacter }
Submit
Cancel
More
No more~
There is no comment~
${ textCharacter }/${ maxCharacter }
Submit
Cancel
${ selectedItem.replyTextCharacter }/${ selectedItem.replyMaxCharacter }
Submit
Cancel
Confirm
Are you sure to Delete?
Yes
No