 +1 credit
| Version | Summary | Created by | Modification | Content Size | Created at | Operation |
|---|---|---|---|---|---|---|
| 1 | Catherine Yang | -- | 509 | 2022-11-16 01:25:06 |
Video Upload Options
1. Introduction
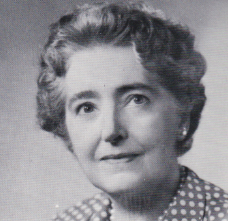
Mary Eleanor Hunt Spear (March 4, 1897 – January 22, 1986) was an American data visualization specialist, graphic analyst and author, who pioneered development of the bar chart and box plot.
2. Early Life and Education
Spear was born in Jonesboro, Indiana, the daughter of Amos Zophar Hunt and Mabel Elizabeth Ewry Hunt.[1] She attended Peabody Elementary School, Washington D.C.,[2] followed by Eastern High School.[2] She then studied at Strayer's Business College[1] and George Washington University.[3] She married Albert Austin Spear in September 1921.[3][4]
3. Career
Spear worked as a graphic analyst for many United States Federal Government agencies[5] between the 1920s and the 1960s, including for the Internal Revenue Service and the Bureau of Labor Statistics.[4][6] She also operated her own studio for 22 years, and taught Graphic Representation of Statistics at the American University.[5][6] She wrote two books, Charting Statistics in 1952[7] and Practical Charting Techniques in 1969,[8] which described detailed techniques to design and create various types of statistical charts and graphs. She also explained the roles needed for successful development and presentation of charts: a graphic analyst, a draftsman, and a communicator.[5][9] The same team-based approach is recommended by 21st century author and presentations expert Nancy Duarte.[9]
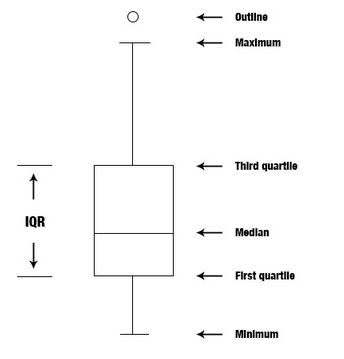
Spear has been recognised, by statisticians Edward Tufte and Hadley Wickham among others, as having presented the first formulation of the box plot. This was shown in Charting Statistics ,[10][11][12][13] which on page 166 shows a diagram of a range bar chart featuring an interquartile range box. The box plot was further developed seventeen years later by American mathematician John Tukey.[11]
Reviewers of her first book noted approvingly Spear's inclusion of tips about presenting data in graphic form on television.[6][14][15] Several reviewers felt that the book could have been longer, that more instructions about equipment and tools would have been useful,[14][15] that the explanations were too short, and, although they were "thankful for a book containing many excellent illustrations, [were] regretful that author Spear did not impart more of her fund of knowledge."[14] An Italian reviewer felt it would be very successful in popularising the basic types of graphic data displays,[6] while a French reviewer thought that economics teachers, administrators and entrepreneurs would all benefit from reading it.[16] A review in Journal of Marketing highlighted three rules: "keep the presentations simple ... know your audience, know your material."[15] The Analysts Journal pointed out that, as well as being useful to those needing to create their own presentations of statistical information, it would be valuable for assessing those made by others.[17]
Spear's second book was an updated version of her first.[5] It was also longer,[5] although at least one reviewer still thought that parts were too short.[18] It contained a chapter titled, "Cheating by Charting", on how not to mislead an audience,[18] but made no reference to the growing field of plotting data by computer.[18]
4. Works
References
- Who's who of American Women and Women of Canada, Volume 5. A.N. Marquis Company. 1968. p. 1143. https://books.google.com/books?id=Aag-AQAAIAAJ&q=%22Spear+Mary%22. Retrieved 14 August 2019. "SPEAR, Mary Eleanor Hunt, graphic analyst; b. Jonesboro, Ind., Mar. 4, 1897; d. Amos Zopher and Mabel Elizabeth (Ewry) Hunt; student (scholarship) Strayer's Bus. Coll., ..."
- "Promoted to the High Schools". Evening Star (Washington, D.C.): p. 9. 30 January 1912. https://www.newspapers.com/image/331519060/?terms=%22Mary%2BEleanor%2BHunt%22.
- "Miss Mary Eleanor Hunt Weds Mr. Albert Austin Spear". Evening Star (Washington, D.C.): p. 8. 23 September 1921. https://www.newspapers.com/image/333796447/?terms=%22Mary%2BEleanor%2BHunt%22.
- [=p.edanmdm.indexedstructured.name:%22Coradi%2C+Gottlieb%22 "Suspension Pantograph in Case by G. Coradi of Zurich Sold by Eugene Dietzgen Company with Stand"]. https://www.si.edu/collection/search?edan_q=*:*&edan_fq[]=p.edanmdm.indexedstructured.name:%22Coradi%2C+Gottlieb%22.
- Berinato, Scott (2019). The Harvard Business Review Good Charts Collection: Tips, Tools, and Exercises for Creating Powerful Data Visualizations. Boston, MA: Harvard Business Press. ISBN 9781633697300. OCLC 1080938259. https://books.google.com/books?id=20OCDwAAQBAJ&q=%22mary+eleanor+spear%22&pg=PT185. Retrieved August 7, 2019.
- Pedroni, Fernando (1953–1954). "Reviewed Work: Charting Statistics by Mary Eleanor Spear" (in it). Genus (Università degli Studi di Roma “La Sapienza”) 10 (1/4): 304–305.
- Spear, Mary Eleanor (1952). Charting Statistics. McGraw Hill.
- Spear, Mary Eleanor. (1969). Practical charting techniques. New York: McGraw-Hill. ISBN 0070600104. OCLC 924909765. http://www.worldcat.org/oclc/924909765
- Duarte, Nancy (2009-09-02). "It Used to Take Three Highly-Trained Professionals to Make a Presentation". Duarte.com. https://www.duarte.com/presentation-skills-resources/it-used-to-take-three-highly-trained-professionals-to-make-a-presentation/.
- Tufte, E. R. (June 1990). "Data-Ink Maximization and Graphical Design". Oikos (Nordic Society Oikos) 58 (2): 130–144. doi:10.2307/3545420. https://dx.doi.org/10.2307%2F3545420
- Wysocki, Robert K. (2004). Project Management Process Improvement. Artech House. ISBN 9781580537186. https://books.google.com/books?id=EJKaMy9KLZkC&q=%22Mary+Eleanor+Spear%22&pg=PA82. Retrieved 14 August 2019.
- Potter, Kristin (2006). Hagen, Hans; Kerren, Andreas; Dannenmann, Peter. eds. "Methods for Presenting Statistical Information: The Box Plot". Visualization of Large and Unstructured Data Sets. GI-Edition Lecture Notes in Informatics (LNI) - Seminars (Gesellschaft für Informatik) S-4. ISSN 1614-3213. http://www.sci.utah.edu/~kpotter/publications/potter-2006-MPSI.pdf. Retrieved 7 August 2019.
- Wickham, Hadley; Stryjewski, Lisa (29 November 2011). "40 years of boxplots". https://vita.had.co.nz/papers/boxplots.pdf.
- Hanson, Kermit O. (January 1953). "Reviewed Work: Charting Statistics by Mary Eleanor Spear". The Accounting Review (American Accounting Association) 28 (1): 152–153.
- Roshwalb, Irving (April 1953). "Reviewed Work: Charting Statistics by Mary Eleanor Spear". Journal of Marketing (Sage Publications, Inc.) 17 (4): 466–467. doi:10.2307/1247038. https://dx.doi.org/10.2307%2F1247038
- Guitton, Henri (May 1953). "Reviewed Work: Charting Statistics by Mary Eleanor Spear" (in fr). Revue économique (Sciences Po University Press) 4 (3): 443–444. doi:10.2307/3497908. https://dx.doi.org/10.2307%2F3497908
- Slade, Helen (August 1955). "Reviewed Work: Charting Statistics by Mary Eleanor Spear". The Analysts Journal 11 (4): 97.
- Blankenship, Benjamin R., Jr. (May 1971). "Review: Everything You Wanted to Know about Charts. Reviewed Work: Practical Charting Techniques by Mary Eleanor Spear". Journal of Marketing Research (Sage Publications, Inc.) 8 (2): 270. doi:10.2307/3149782. https://dx.doi.org/10.2307%2F3149782
Location: Jonesboro, Indiana

