Your browser does not fully support modern features. Please upgrade for a smoother experience.
Submitted Successfully!
 +1 credit
Thank you for your contribution! You can also upload a video entry or images related to this topic.
For video creation, please contact our Academic Video Service.
| Version | Summary | Created by | Modification | Content Size | Created at | Operation |
|---|---|---|---|---|---|---|
| 1 | Wei Zhang | -- | 5047 | 2022-11-08 14:14:59 | | | |
| 2 | Catherine Yang | -2 word(s) | 5045 | 2022-11-09 03:08:50 | | |
Video Upload Options
We provide professional Academic Video Service to translate complex research into visually appealing presentations. Would you like to try it?
Cite
If you have any further questions, please contact Encyclopedia Editorial Office.
Tang, M.; Li, J.; Wang, Y.; Han, W.; Xu, S.; Lu, M.; Zhang, W.; Li, H. Characterization of MXene's Terminations. Encyclopedia. Available online: https://encyclopedia.pub/entry/33532 (accessed on 22 July 2026).
Tang M, Li J, Wang Y, Han W, Xu S, Lu M, et al. Characterization of MXene's Terminations. Encyclopedia. Available at: https://encyclopedia.pub/entry/33532. Accessed July 22, 2026.
Tang, Mengrao, Jiaming Li, Yu Wang, Wenjuan Han, Shichong Xu, Ming Lu, Wei Zhang, Haibo Li. "Characterization of MXene's Terminations" Encyclopedia, https://encyclopedia.pub/entry/33532 (accessed July 22, 2026).
Tang, M., Li, J., Wang, Y., Han, W., Xu, S., Lu, M., Zhang, W., & Li, H. (2022, November 08). Characterization of MXene's Terminations. In Encyclopedia. https://encyclopedia.pub/entry/33532
Tang, Mengrao, et al. "Characterization of MXene's Terminations." Encyclopedia. Web. 08 November, 2022.
Copy Citation
MXene, 2D transition metal carbides, nitrides, and carbonitrides with a unique 2D structure, inspired a series of function applications related to energy storage and conversion, biometrics and sensing, lighting, purification, and separation. Its surface terminations are confined by the adjacent MXene layers, and form the 2D planar space with symmetrical surfaces, which is similar to a 2D nanoreactor that can be utilized and determined MXene’s function. Accurate characterization of MXene surface terminations is the prerequisite for studying the regulatory methods and the influence of properties and performance. Because the surface termination of MXene presents two-dimensional plane distribution and the collision probability of atoms, molecules, electrons, and optical signals is low. MXene prepared by chemical methods has certain impurity content. In addition, most surface terminations do not exist in a stable state, which leads to the difficulty of the accurate characterization of MXene surface terminations. At present, XPS, EDX, XAS and EELS are often used for qualitative and quantitative analysis of MXene surface terminations.
MXene
surface terminations
modification
characterization
1. XRD
Although X-ray diffraction (XRD) cannot directly capture the differences of elements in the surface terminations of MXene, the evolution of MXene interlayer space induced by the dissimilar surface terminations can be deduced via the calculated MXene lattice parameters. As a basic crystal structure characterization technology, the statistical analysis of MXene crystal structure by XRD can indirectly reflect the modulating action of MXene surface termination on MXene crystal structure and the interlayer environment. Based on the information of new peak appearance, peak position shift, and half-peak width change, the surface termination atom arrangement and its induced structural evolution can be analyzed indirectly.
Figure 1 a shows the XRD patterns of the initial phase Ti 3 AlC 2 and intermediate product Ti 3 ZnC 2 . The XRD peaks of Ti 3 ZnC 2 , such as (103) and (104), shift to a lower angle than those of Ti 3 AlC 2 , indicating that the substitution of Al atoms by Zn atoms results in a larger lattice constant. The relative intensities of peaks (004) and (006) increase, while the relative intensities of peaks (002) decrease, resulting from structural factor changes caused by the substitution of A atoms [1]. Figure 1 b shows the XRD patterns of the reaction products Ti 3 C 2 Cl 2 and HCl rinsed products. Except for the diffraction peak characteristics of zinc, the XRD patterns of the reaction products are similar to those of Ti 3 C 2 MXene prepared by the HF etching method. The (104) peak of Ti 3 AlC 2 is significantly weakened or disappeared, in addition to the downward shift of the (002) peak to a lower Angle, attributed to the increased C lattice parameters. The C lattice parameter is consistent with the theoretical value calculated by DFT and larger than Ti 3 C 2 T x generated by HF etching [2]. Note that unlike the typical wide (00L) peak of Ti 3 C 2 T x produced by HF etching, the (00L) peak of Ti 3 C 2 Cl 2 is sharp and intense, indicating an ordered crystal structure. Therefore, MXene prepared by this method with -Cl as the surface termination has a stronger XRD peak and a more orderly crystal structure. Other MXene with different functional groups also have different manifestations in the XRD. As shown in Figure 1c, the (002) characteristic peaks of Ti 3 C 2 -O and Ti 3 C 2 -S obtained by treating molten salt-assisted electrochemical (MS-E) etched Ti 3 C 2 Cl 2 with Li 2 O and Li 2 S were further shifted from 8.18° to lower angles of 7.48° and 6.88°. This is attributed to the C lattice parameters ranging from 21.9 Å to 23.6 Å and 25.9 Å [3].
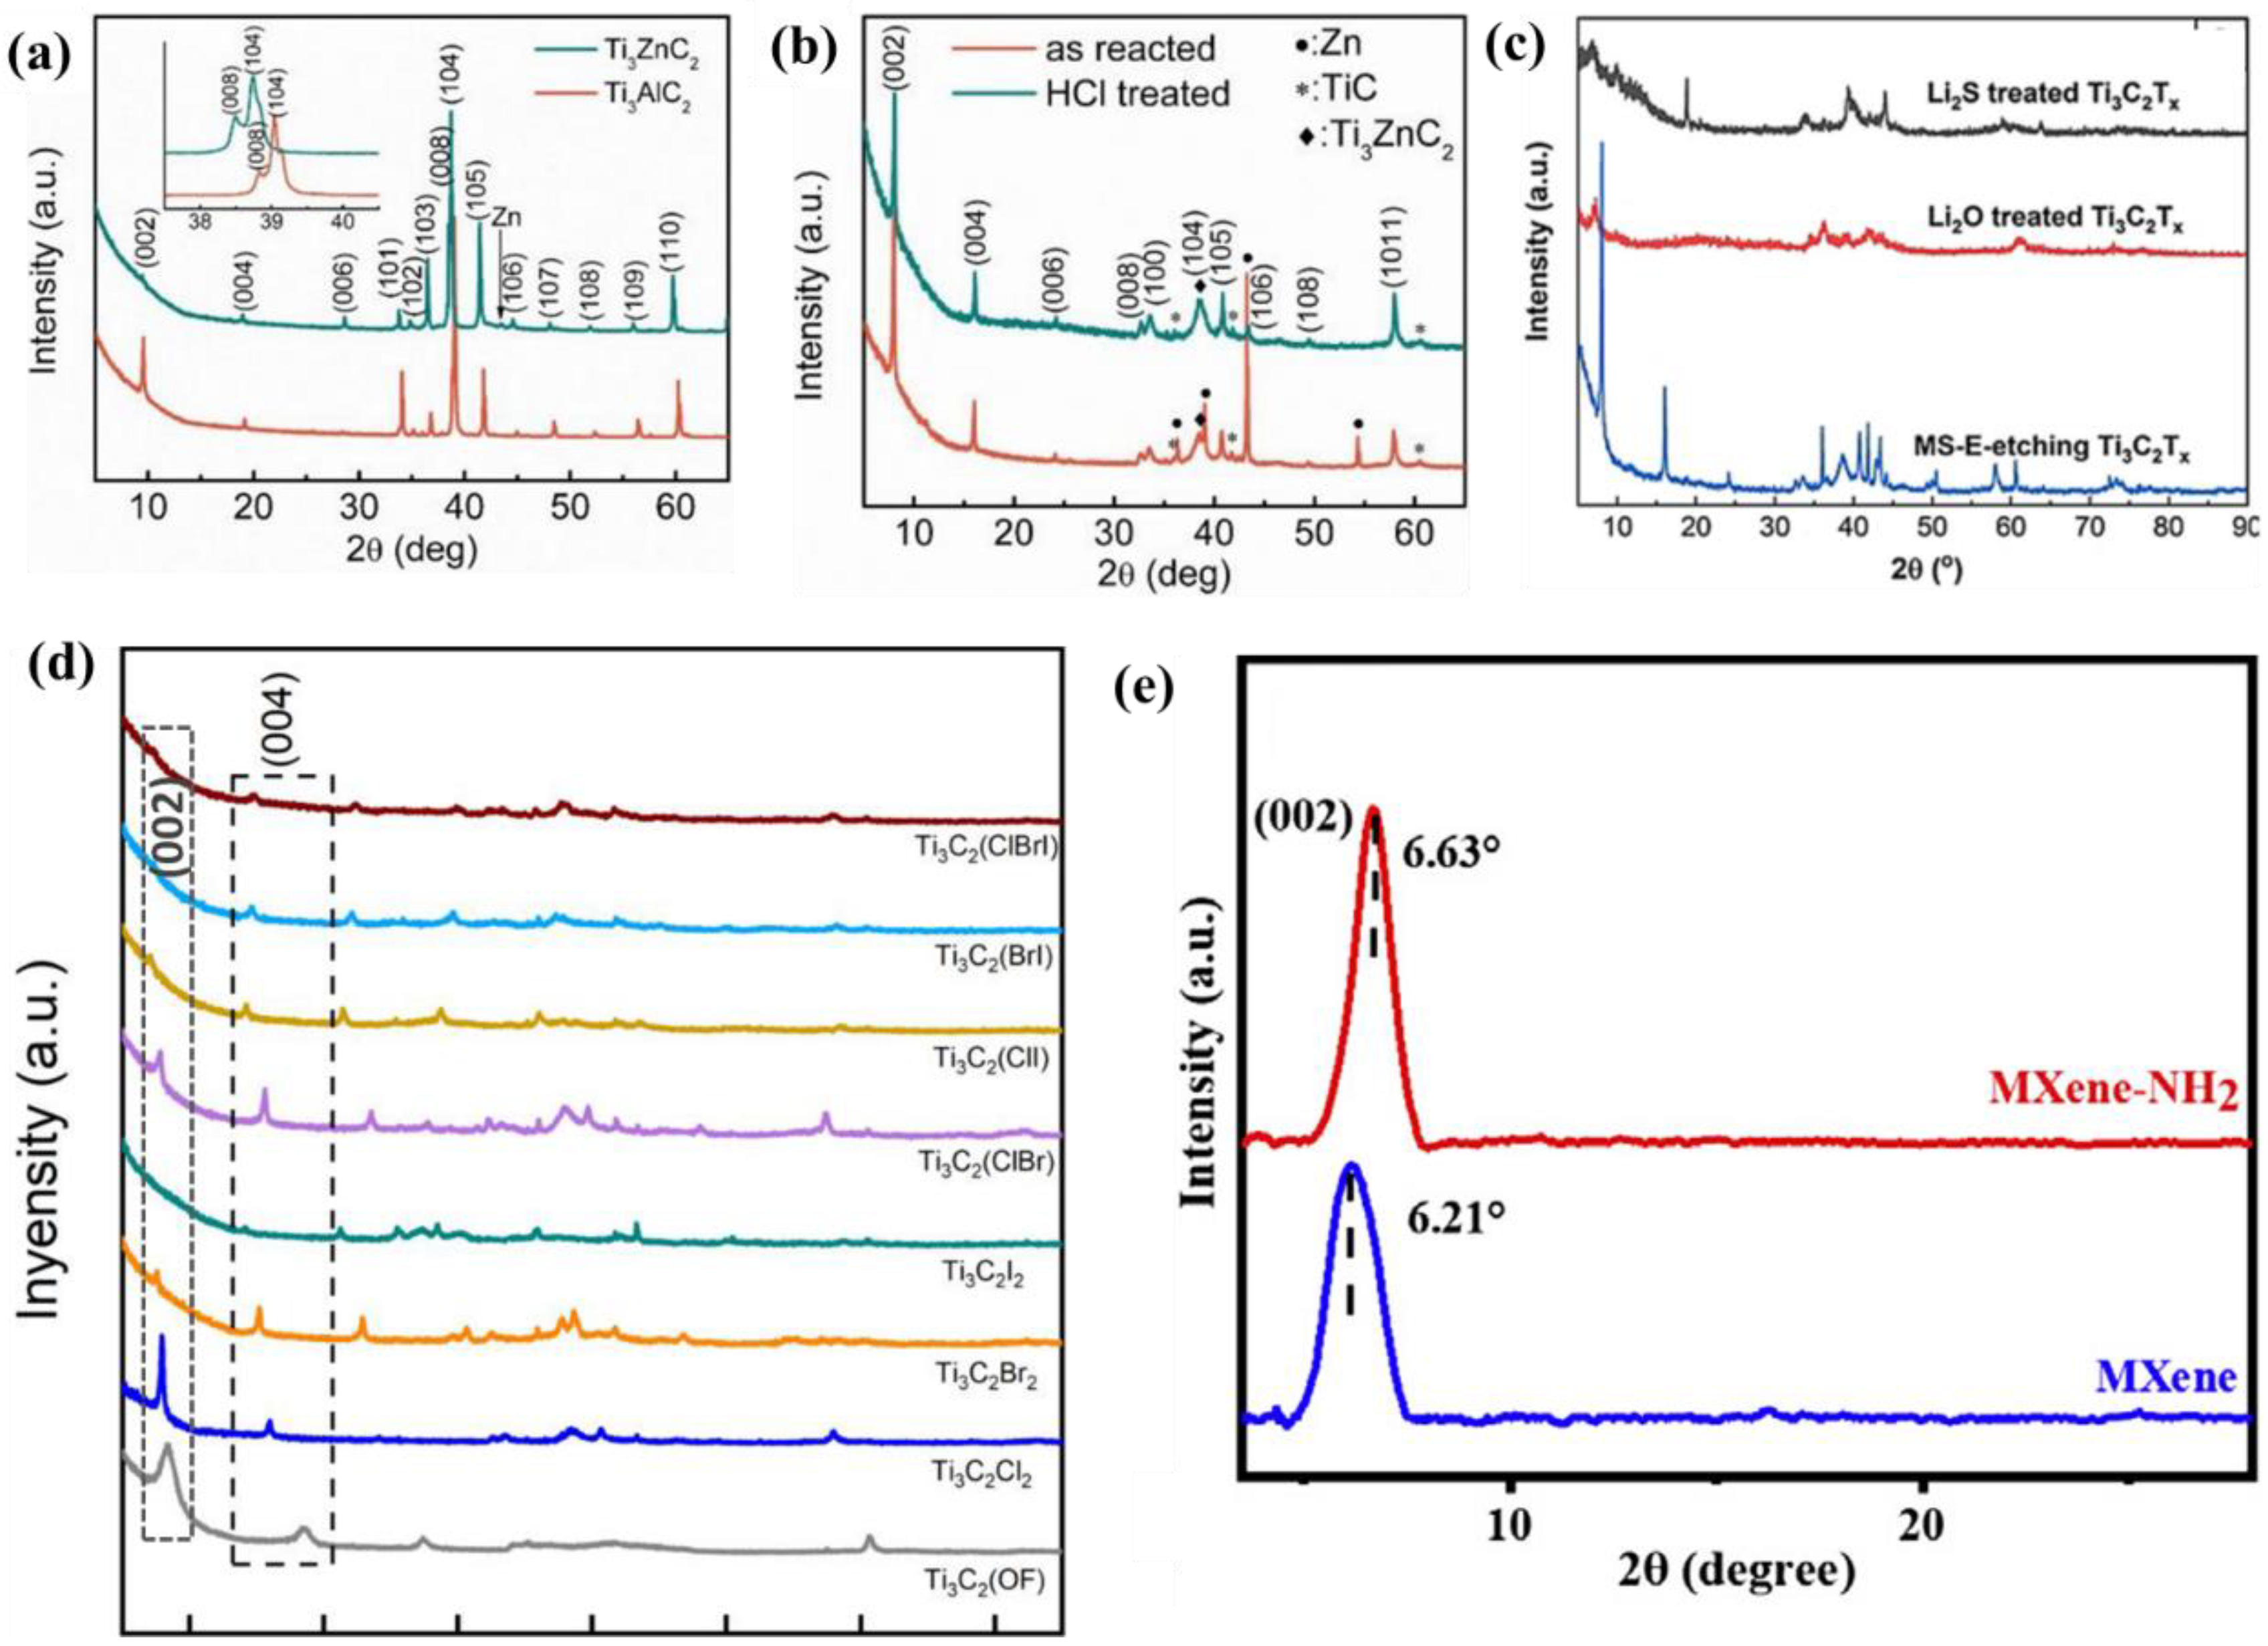
Figure 1. ( a ) Comparison of XRD patterns between Ti 3 AlC 2 and intermediate Ti 3 ZnC 2 [1]. ( b ) XRD patterns of reaction products and HCl rinsed products [2]. ( c ) XRD patterns of Ti 3 C 2 -O and Ti 3 C 2 -S [3]. ( d ) The XRD patterns of halogen termination MXene were compared [4]. ( e ) XRD patterns of MXene-NH 2 [5].
Figure 1d shows the XRD patterns of MXene and Ti 3 C 2 (OF) at halogen terminations. It is found that Ti 3 C 2 Cl 2 and Ti 3 C 2 (OF) have strong (002) peaks, corresponding to the C values of 20.90 and 22.22 Å, respectively. The (002) peaks of Ti 3 C 2 Br 2 and Ti 3 C 2 I 2 are not very clear, but the (004) peaks are strong enough. Sufficient to determine their respective C values of 23.33 and 25.00 Å, which are slightly larger than the theoretical values calculated by density functional theory (DFT) (23.02 and 24.24 Å). This indicates that the layer spacing of MXene connecting halogen groups increases successively with the radius of halogen groups. The increased layer spacing in Ti 3 C 2 Br 2 and Ti 3 C 2 I 2 can be interpreted as an increase in the atomic radius of the halogen group from fluorine to iodine. Different termination atoms will lead to different structure factors of MXene, resulting in different relative intensities of the (00L) peak. The c-value of binary and ternary halogen-terminated MXene is between that of monoid halogen-terminated MXene. For example, the C value of Ti 3 C 2 (BrI) (24.06 Å) is larger than that of Ti 3 C 2 Br 2 , but smaller than that of Ti 3 C 2 I 2 [4].
Figure 1e shows the XRD patterns of conventional MXene and MXene with amino surface functionalization. Compared with the peak (002) of MXene at 6.21°, the peak (002) shifted to a large angle of 6.63° after -NH 2 functionalization. It shows that their D-spacing decreases from 1.42 nm to 1.33 nm. The decrease in D-spacing is due to the introduction of positively charged amino groups on the surface of MXene-NH 2 , which reduces the repulsive force of the original negative charge on the MXene nanosheet. Therefore, the small D-spacing in MXene-NH 2 can be judged by XRD [5].
2. SEM and EDS
Figure 2a,b show SEM images of Ti 3 AlC 2 and Ti 3 ZnC 2 powders. The Ti 3 AlC 2 precursor exhibits a typical MAX phase layered structure. In contrast, the layered structure of Ti 3 ZnC 2 becomes less pronounced, probably due to the dissolution of the powder edges in the molten salt. Ti 3 C 2 Cl 2 was obtained by adding excessive zinc chloride. Figure 2c,d shows the semi-quantitative analysis of SEM of Ti 3 C 2 Cl 2 and the corresponding EDS (energy dispersive spectroscopy). Typical accordion-like morphology was found, and the main elements were Ti (43.2 at.%), C (21.5 at.%), and Cl (25.3 at.%). As well, small amounts of Zn (0.7 at.%), Al (2.9 at.%), and O (6.3 at.%). The presence of Zn, Al, and O is plausible because ubiquitous O-containing compounds, such as Al(OH) 3 , are hydrolysates of AlCl 3 .

Shen et al. prepared -O termination MXene and -S termination MXene by adding Li 2 O or Li 2 S to the melting system to modify Ti 3 C 2 T x powder. SEM shows that the modified Ti 3 C 2 T x powder still maintained accordion-like multilayer morphology ( Figure 2e,f) and was tightly stacked. In EDS analysis, element Cl was not detected, and elements O and S were the main components of surface terminations.
Huang et al. prepared Ti 3 C 2 Cl 2 , Ti 3 C 2 Br 2 , Ti 3 C 2 I 2 , Ti 3 C 2 (ClBr), Ti 3 C 2 (ClI), Ti 3 C 2 (BrI) and Ti 3 C 2 (ClBrI) using halogen atoms as terminations by molten salt method. The morphology and elemental composition were characterized by SEM and EDS, as shown in Figure 2g–m. The SEM confirmed that MXene has typical accordion morphology, and EDS analysis obtained their main composition elements (Ti, C) and end-group elements (Cl, Br, I), which can judge the morphology and preliminary functional success of MXene, indicating that halogen atoms almost completely occupy the termination position of the surface.
Based on the combination of SEM and EDX, the surface terminations of MXene in the microzone can be observed, and the information on element species, distribution, and content can be preliminarily obtained. As a fast and efficient means of characterization, SEM+EDX can achieve high-throughput data collection, which provides support for the study of MXene surface terminations.
3. XPS
XPS can accurately measure the inner electron binding energy and chemical shift of atoms, provide information on molecular structure and valence state, and provide information on element composition and content, chemical state, and molecular structure. In addition, because the X-ray beam incident on the sample surface is a photon beam, the damage to the sample is very small. XPS is used as the most conventional means to analyze the surface terminations of MXene. With the accurate representation of XPS elements, the valence states, chemical bonds, and chemical shifts of surface termination elements are collected. Meanwhile, the mechanism of the surface termination formation process can be obtained by comparing the XPS high-resolution spectrogram. Providing support for the development of differentiated surface terminations is one of the most powerful characterization techniques in MXene surface termination research.
XPS spectra of Ti 2p and Cl 2p of Ti 3 C 2 Cl 2 are shown in Figure 3a. The peaks at 454.4 eV and 455.7 eV are assigned to the Ti-C(I) (2p 3/2 ) and Ti-C (II) (2p 3/2 ) bonds [6] [7]. The peak at 458.1 eV belongs to the high-valence Ti compound, which is assigned to the Ti-Cl (2p 3/2 ) bond [8] [9]. In addition, the peaks at 460.3 eV, 461.8 eV and 464.1 eV are attributed to Ti-C (I) (2p 1/2 ), Ti-C (II) (2p 1/2 ) and Ti-Cl (2p 1/2 ) bonds, respectively. The right picture of Figure 2a shows its Cl 2p spectrum. The peaks at 198.6 eV and 200.1 eV are consistent with the positions of Cl-Ti (2p 1/2 ) and Cl-Ti (2p 3/2 ) bonds [8] [9]. This confirms the existence of Ti-Cl bonds. The Ti-Cl ratio determined by XPS analysis was 2.94:2.

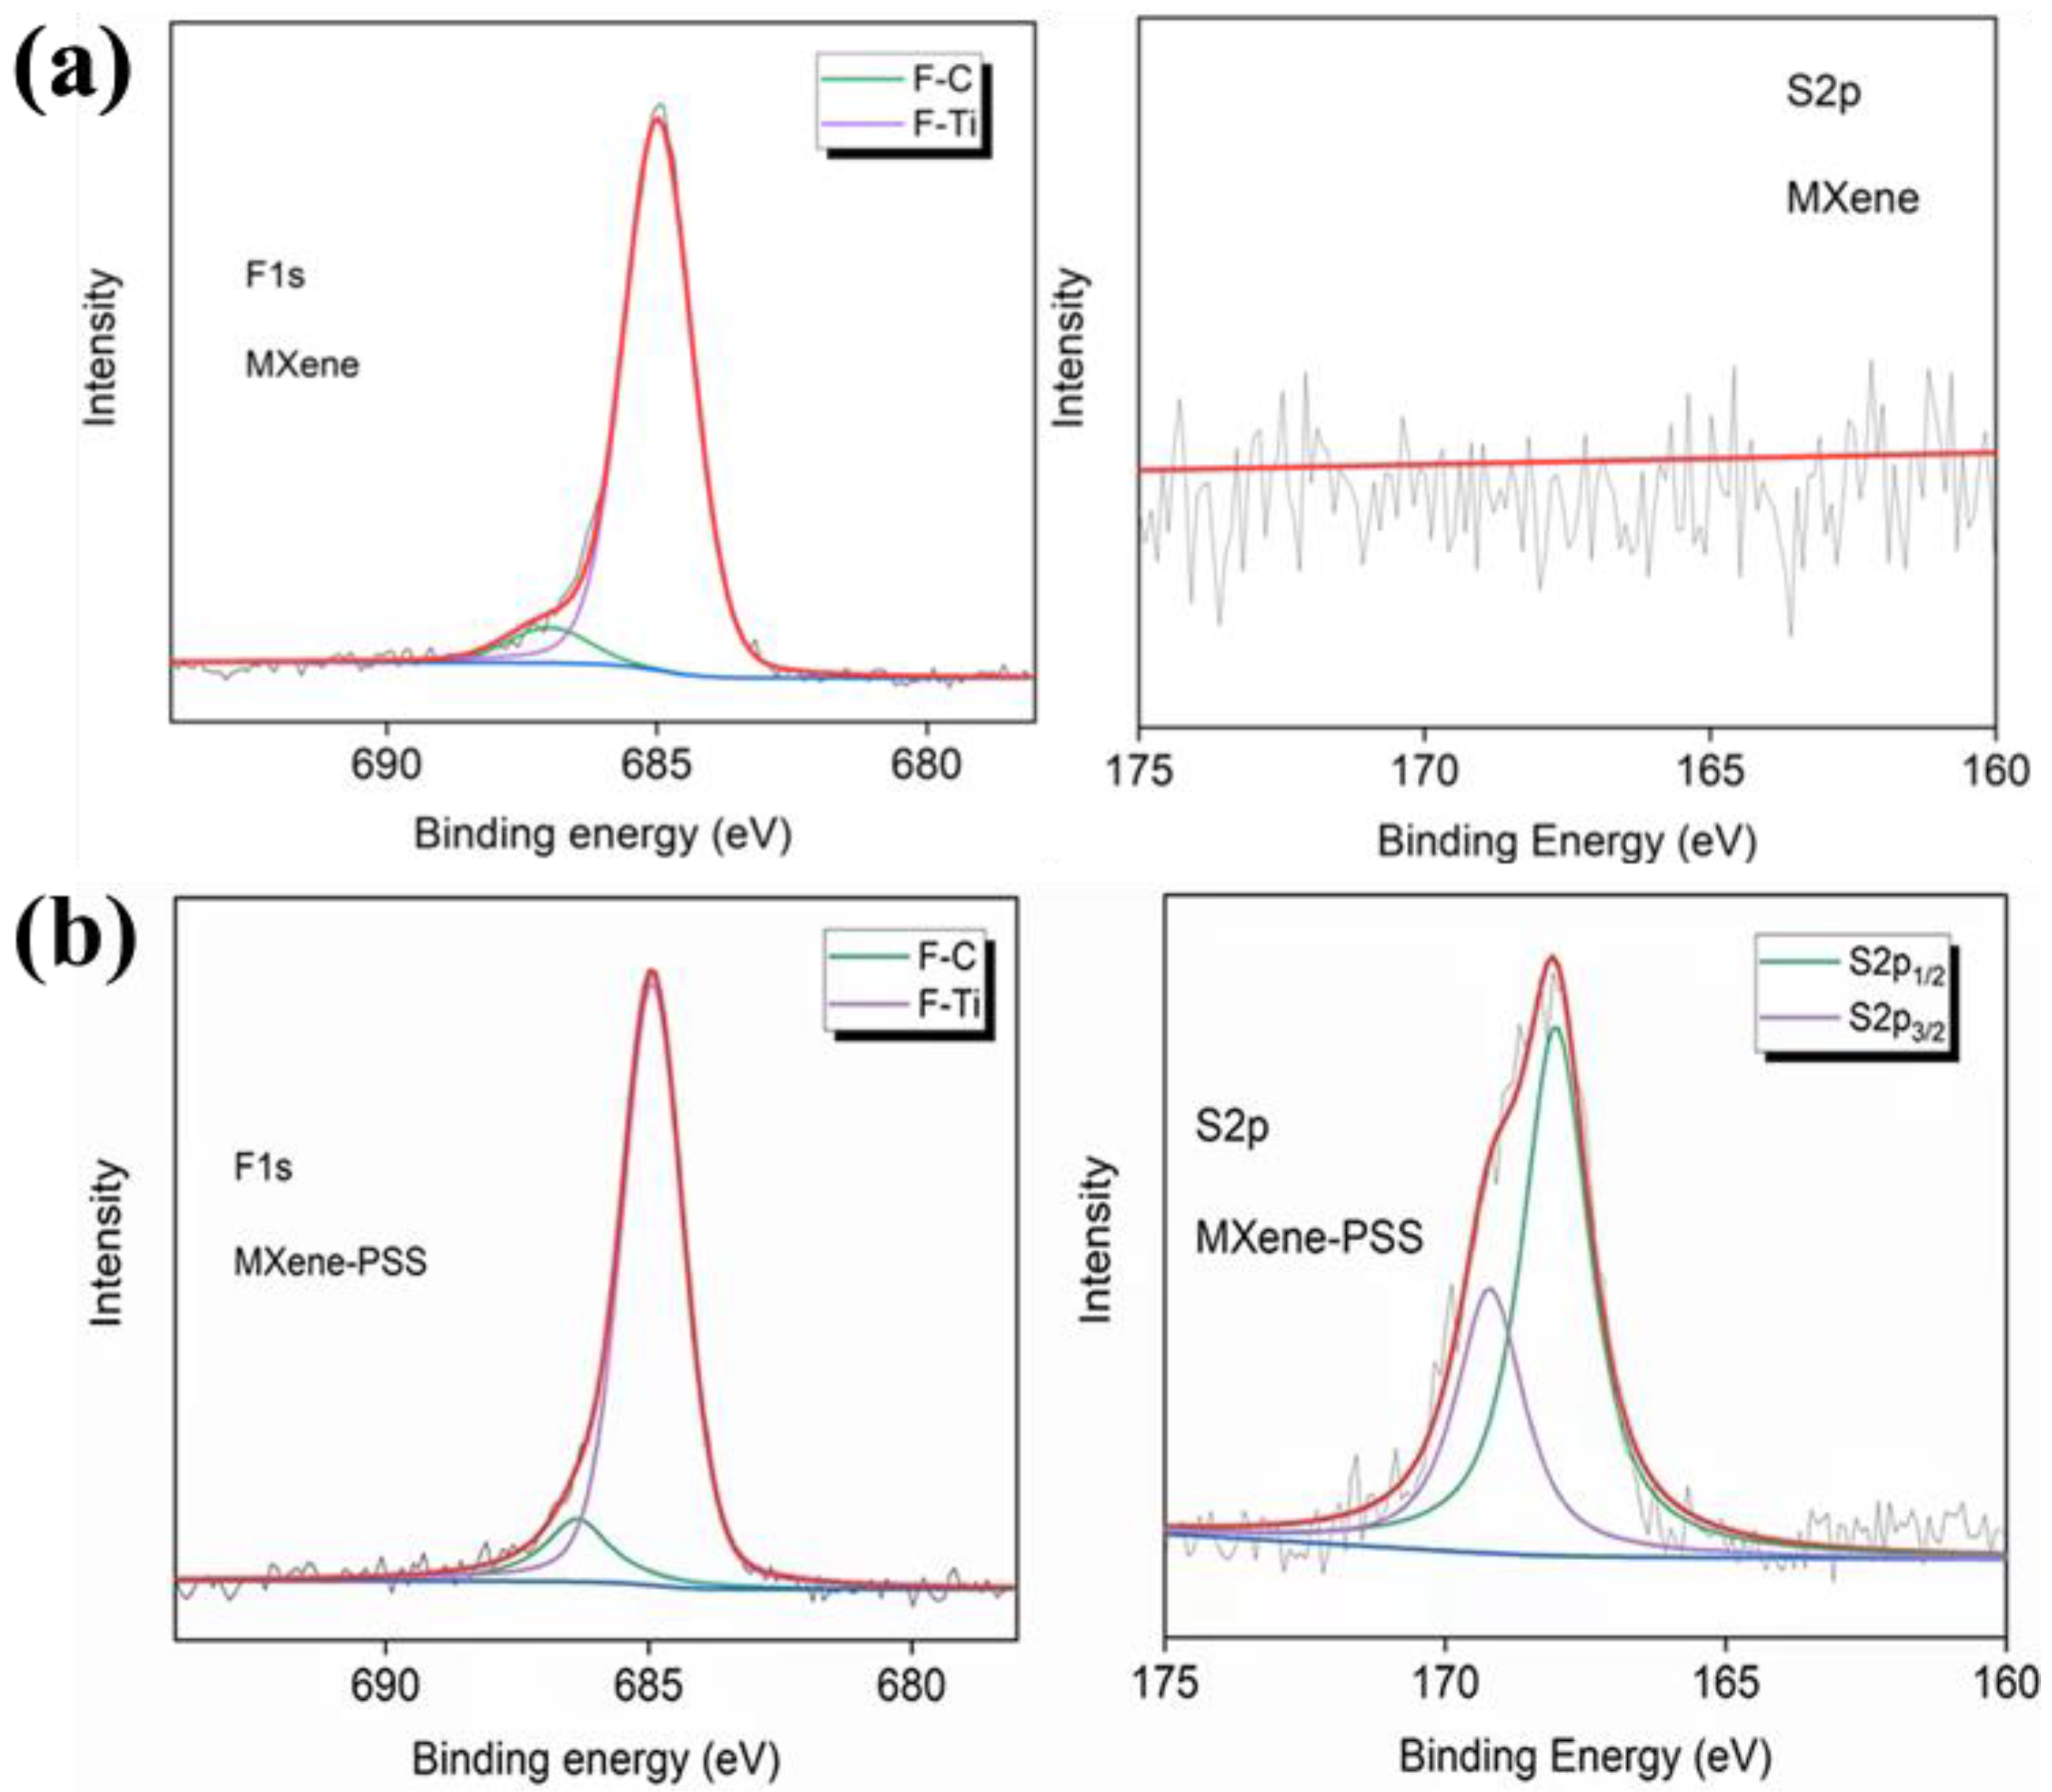
Figure 3. ( a ) XPS spectra of Ti 2p and Cl 2p of Ti 3 C 2 Cl 2 [1]. ( b ) High-resolution Ti 2p spectra of -O and -S terminations Ti 3 C 2 T x powders [3]. ( c ) XPS spectra of MXene-NH 2 [5]. ( d ) XPS spectra of Ti 3 C 2 Br 2 and Ti 3 C 2 Te MXene [10]. ( e ) The left is the high-resolution XPS spectrum of Ti 3 C 2 Br 2 MXene, and the right is the high-resolution XPS spectrum of Ti 3 C 2 Te MXene [10]. ( f ) XPS spectra of Ti 3 C 2 (NH)MXene [10]. ( g ) The high-resolution XPS spectrum of Ti 3 C 2 □ 2 MXene [10]. ( h ) XPS spectra of F 1s and S 2p of Ti3C2Tx MXene. ( i ) XPS spectra of F1s and S2p of Ti3C2Tx-PSS [11].
High-resolution Ti 2p spectra ( Figure 3b) also show that Ti 3 C 2 Cl 2 forms a Ti-O (2P 3/2 ) bond after treatment in Licl-KCl-Li 2 O, so that there is no Ti-Cl bond at 458.9 eV and a new peak occurs. For Ti 3 C 2 T x treated with Li 2 S, the Ti-Cl bond was also not visible. There are two peaks at 459.2 eV and 456.8 eV, which are attributed to Ti-O (2p 3/2 ) and Ti-S bond (2p 3/2 ), respectively [10]. These results indicate that -Cl surface terminations change to surface terminations with -O and/or -S.
XPS can also confirm the amino groups on the surface of MXene, as shown in Figure 3c. It can be seen that there are only four major elements C, F, Ti, and O in the XPS spectrum of conventional MXene. However, the N 1s peak appears in the measured spectra of MXene-NH 2 films and CMC/MXene-NH 2 composite films. The evolution of the N 1s spectrum shows five peaks that can be attributed to the N-Ti, N-C, -NH 2 , -NH 4 + and -NH 3 + bonds, respectively. -NH 4 + and -NH 3 + should result from the protonation of the NH 3 ·H 2 O and -NH 2 groups, respectively. The Ti 2p high-resolution spectrum shows two peaks at 455.3 eV and 463.2 eV, originating from the Ti-N and Ti-F bonds, respectively. The C-N bond in MXene-NH 2 was also shown. Thus, the N element in MXene-NH 2 consists of Ti-N, C-N, -NH 2 , and -NH 3 + forms. Importantly, the appearance of -NH 2 , -NH 3 + and Ti-N bonds would be attributed to the introduction of amino-termini on the surface of MXene.
The XPS measurement spectra of Ti 3 C 2 Br 2 and Ti 3 C 2 Te MXene were compared, as shown in Figure 3d. After surface group exchange in CsBr/LiBr/KBr molten salt, the Br peak was replaced by the Te peak. The Cs 3D peak corresponds to the intercalated Cs + ions or residual Cs + . Figure 3e shows the high-resolution XPS spectrum of Ti 3 C 2 Br 2 MXene and Ti 3 C 2 Te MXene. The binding energy of the Ti-C component of Ti 3 C 2 Br 2 MXene shifts to a lower value after Br - replaces Te 2- . This result is consistent with the fact that Te is less electronegative than Br. Figure 3f shows the XPS spectrum of Ti 3 C 2 (NH) MXene, measured with the highlighted N 1s region. The elemental analysis of the measured spectrum shows that the Ti:N ratio is 3:1.1, and the analysis of the high-resolution N 1 s spectrum shows that there are three components. The 396.2 eV peak (59%) belongs to the β-N chemisorbed on the Ti surface [12]. The 397.5 eV peak (26%) corresponds to α-N 2 chemically adsorbed on the titanium surface. The 399.9 eV peak (16%) may correspond to the N-H bond. Figure 3g shows the high-resolution XPS spectra of Ti 3 C 2 □ 2 MXene. Compared with Ti 3 C 2 Br 2 MXene in Figure 2e, the Ti-C component binding energy to a lower value after Br - has been eliminated with H - .
In addition, Chen et al. compared the XPS spectra of original Ti 3 C 2 T x MXene and MXene modified by -SO 3 H (Ti 3 C 2 Tx-PSS), which prepared Ti 3 C 2 T x MXene composite membranes by intercalating MXene nanosheets with sodium 4-styrene sulfonate (PSS), a spacer containing sulfonic acid group (SO 3 H). The spacer introduced abundant -SO 3 H groups into the membrane, as shown in Figure 4a,b. Compared with the F 1 s spectra of Ti 3 C 2 T x MXene, the signals of F-C and F-Ti move from 687.00 eV and 684.98 eV to 686.36 eV and 684.94 eV, respectively, indicating that these sites bind protons from the PSS. In addition, the S 2 p XPS spectrum of MXene-PSS shows two peaks representing S 2P 1/2 and S 2p 3/2 , in contrast to the S 2 p spectrum of MXenewithout any peaks. This indicates that a large number of -SO 3 H groups were successfully introduced into the membrane.
XPS is used to analyze the MXene surface termination, realizing the accurate confirmation of complex multi-element and hybrid terminations. With the help of high-resolution characteristic element spectrography analysis, combined with computational simulation, the fine structure of MXene surface termination can be obtained. From qualitative to quantitative, provide technical support for MXene surface analysis. However, it is also limited to surface analysis, and is difficult to obtain termination information. It is easy to be affected by the external environment and this peak fitting is subjective.
4.TEM
TEM and spherical aberration-corrected electron microscopy can directly observe the atomic composition of MXene at the atomic scale, and the surface terminations of heavy elements can be directly observed [ [11]. With the help of sample preparation techniques such as frozen section and FBI, ultrathin samples can be obtained, and the arrangement of spatial terminations in the MXene layer can be observed. Depending on the support of testing methods such as EDX and EELS, atomic identification, valence analysis, and coordination relationship judgment can be realized at the atomic scale. In addition, the structure analysis of MXene can be realized by selecting the comparison between electron diffraction and XRD.
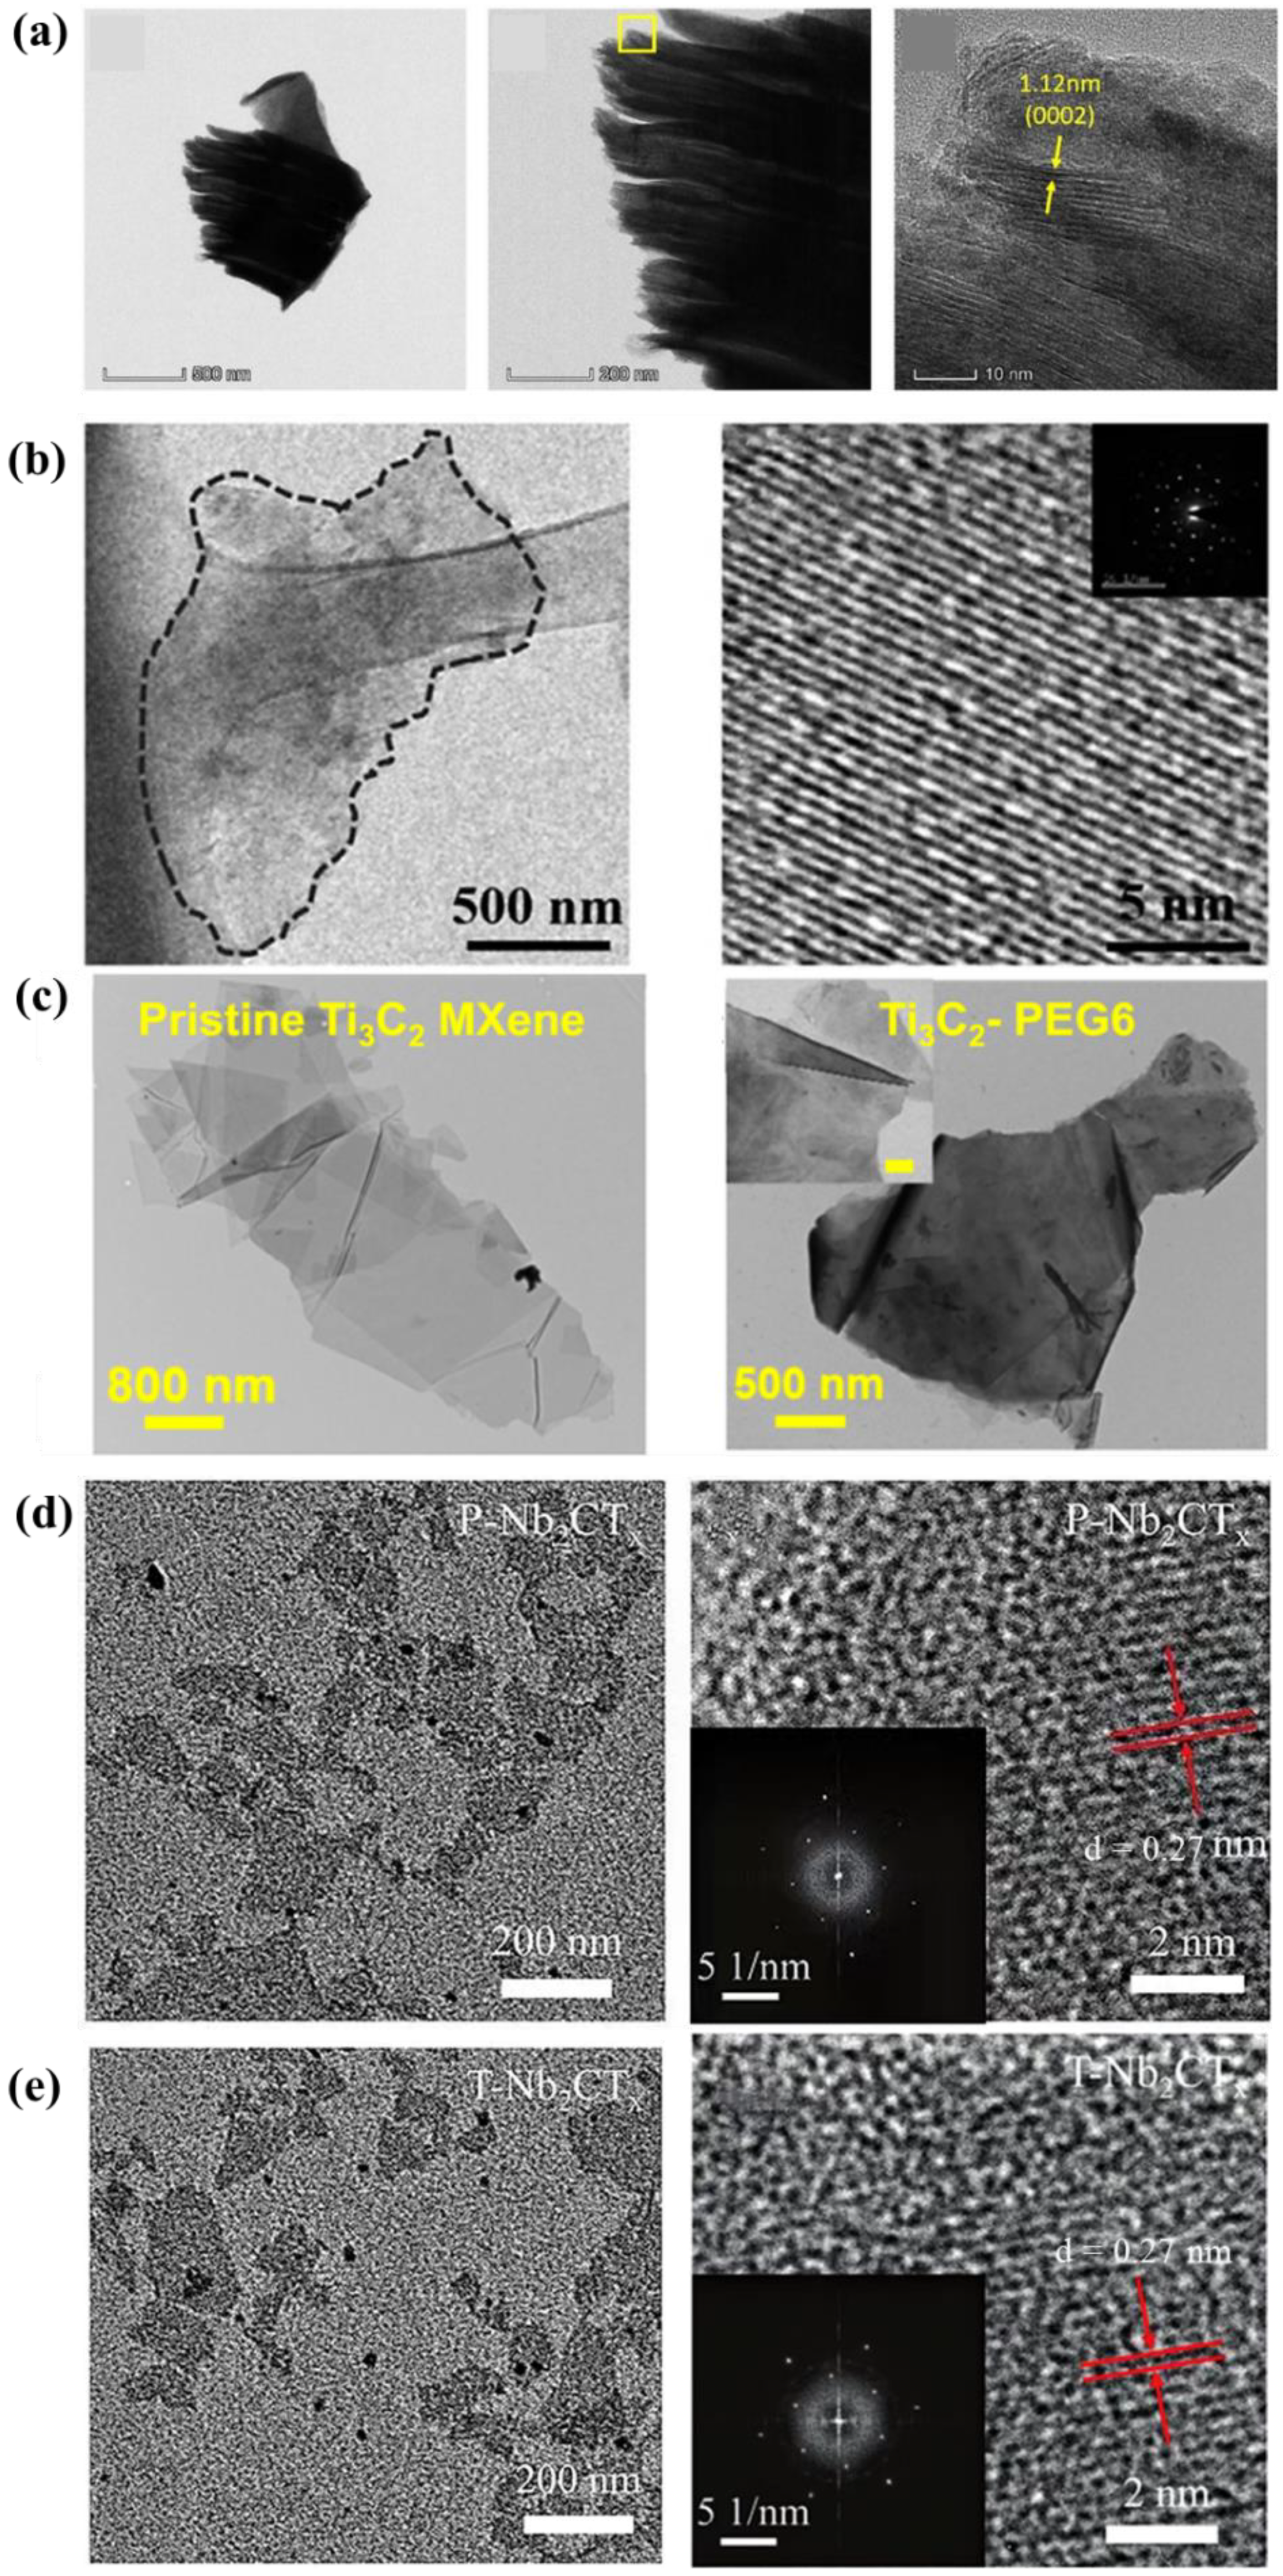
Figure 5a is a TEM image of Ti 3 C 2 Cl 2 MXene with organ-like morphology. Figure 5b is a TEM image of MXene-NH 2 similar to graphene. In addition, the HRTEM image and its selected area electron diffraction pattern (inset) confirm that the crystal structure of the aminated nanosheets is the same as that of conventional MXene. Sardar et al. Modified MXene with PEG6 and observed the morphology by TEM. Figure 5c shows TEM images of pristine Ti 3 C 2 MXene flakes and modified Ti 3 C 2 -PEG6, respectively. Any small nanoparticles formed in the form of TiO 2 nanoparticles in the Ti 3 C 2 -PEG6 flakes were not observed. In addition, the length of Ti 3 C 2 -PEG6 flakes is in the order of microns. These results indicate that the chemical modification of the Ti 3 C 2 MXene flakes does not change the size of the MXene flakes and does not lead to any oxidation of the MXene flakes. This is an important discovery for maintaining the structural integrity of the Ti 3 C 2 MXene flakes. Yu et al. achieved surface amino functionalization of Nb 2 CT x MXene by hydrazine treatment. Figure 5d,e are TEM and HRTEM images of pristine P-Nb 2 CT x and T-Nb 2 CT x MXene with amino functionalization. All the Nb 2 CT x MXene exhibited a typical 2D morphology, and the size and thickness of Nb 2 CT x MXene did not change before and after treatment. HRTEM images of P-Nb 2 CT x and T-Nb 2 CT x MXene nanosheets indicate that the lattice parameters of P-Nb 2 CT x and T-Nb 2 CT x MXene nanosheets are 0.27 nm. In addition, the corresponding selected area electron diffraction (SAED) patterns of P-Nb 2 CT x and T-Nb 2 CT x MXene nanosheets are shown in the inset. This means that the P-Nb 2 CT x and T-Nb 2 CT x MXene nanosheets have hexagonal structures.
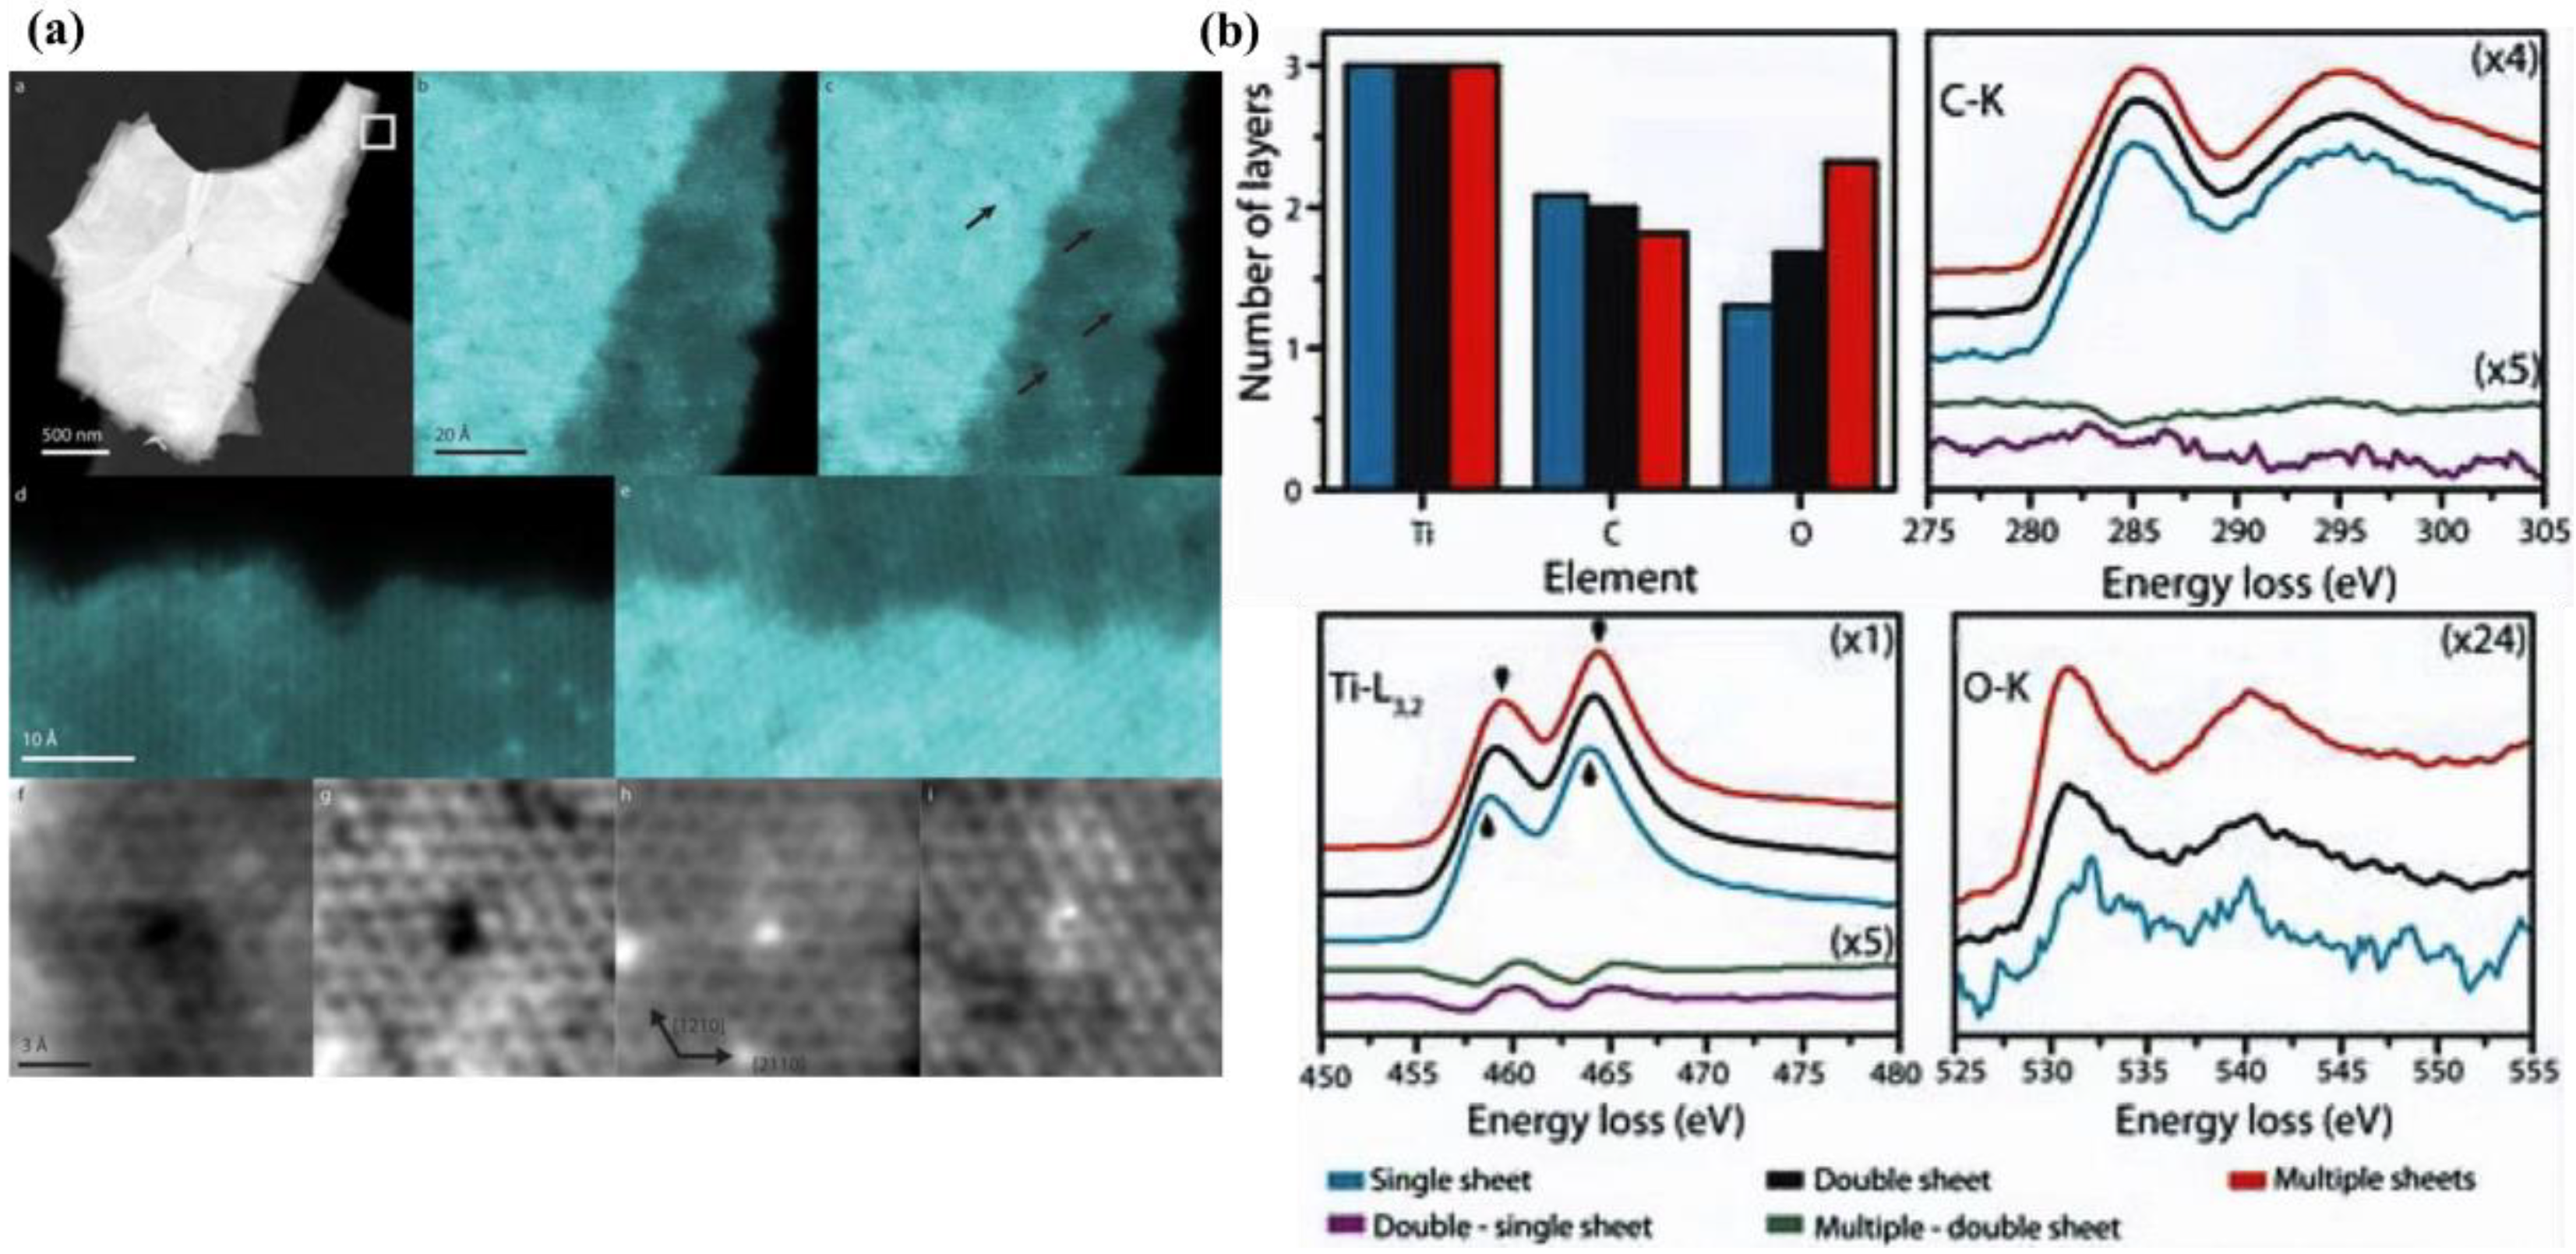
Karlsson et al. used STEM-EELS to study the chemical and structural properties of individual Ti 3 C 2 MXene sheets with associated surface groups at the atomic level, as shown in Figure 6. MXene show inhomogeneous coverage of surface groups that locally affect chemical properties. According to the EELS measurement results, the average components of Ti, C, O, N and F were 47, 33, 20, 3, and 1 at.%, respectively, ignoring the edge effect of a single MXene sheet. Double layer MXene sheets corresponding to 46, 29, 24, 2, and 1 at.%. For multilayer MXene sheets, 40, 24, 31, 2, and 3 at.%, respectively. This indicates that C decreases while F and O groups strongly increase upon a larger thickness of MXene, and the presence of N is also revealed by EELS. As well, while EELS can recognize O as an element and spatially link O to surface groups, it cannot distinguish between molecules [16] [17]. In contrast, XPS was unable to distinguish the number of sheets but identified the presence of Ti-bound O x , (OH) x and absorbed H 2 O as well as a small fraction of TiO x .
5. Raman and FTIR
Raman spectroscopy is an analytical method based on the Raman scattering effect discovered by the Indian scientist C.V. Raman, which analyzes the scattering spectrum with different frequencies from the incident light to obtain information on molecular vibration and rotation, and is applied to the study of molecular structure. Raman spectrometer features: (1) No contact or damage to the sample, and the sample does not need to be prepared. (2) Rapid analysis and identification of the characteristics and structure of various materials. (3) Suitable for black water and water samples, accurate measurement in high, low temperature, and high-pressure conditions. Application directions of Raman spectroscopy: Raman spectroscopy is a molecular structure characterization technique based on the Raman effect, and its signal comes from the correlation between molecular vibration and rotation. The analysis directions of Raman spectroscopy are as follows:
-
Qualitative analysis: Different substances have different characteristic spectra, so qualitative analysis can be carried out by spectra.
-
Structure analysis: The analysis of spectral bands is the basis of material structure analysis.
-
Quantitative analysis: According to the absorbance characteristics of the spectrum of substances, one can have a good ability to analyze the amount of substances.
MXene spectrum mainly has four characteristic regions: formant, thin section, T x area, and carbon area. MXene can be characterized according to the change of peak displacement, intensity, width, and other characteristics in the characteristic region. Different surface terminations, intercalated, and adsorbed species may affect the lattice vibrations. Unit cell distortion and distribution of surface groups result in peak shifting and broadening. Both HF-HCl and LiF-HCl etched Ti 3 C 2 T x spectra show strong -OH surface groups and similar A lg (C) peak positions. However, the -O component dominates the HF etched multilayer Ti 3 C 2 T x spectrum, and the peak position of A 1g shifts to 711 cm −1 , mainly because the addition of HCl reduces the pH value and leads to surface protonation. Talapin et al. measured the Raman spectra of S-terminated MXene using 632 nm laser excitation, and the peak positions of the out-of-plane (A 1g ) and in-plane (E g ) vibrational modes corresponding to the surface groups are particularly sensitive to MXene surface chemistry. Raman spectra of Ti 3 C 2 Cl 2 , Ti 3 C 2 S ( Figure 7a), and Ti 3 C 2 NH ( Figure 7b) MXene show the characteristic A 1g and E g vibrational modes. The Raman spectrum is different from that of Ti 3 C 2 O MXene ( Figure 7c). In particular, for Ti 3 C 2 Cl 2 MXene, the position of the A 1g mode remains at about 170 cm −1 ; for the position of the Ti 3 C 2 S MXene, A 1g mode is kept at 180 cm −1 ; for the position of the Ti 3 C 2 NH MXene, A 1g mode remains at about 210 cm −1 . The A 1g pattern is completely different from that of Ti 3 C 2 O MXene at 222 cm −1 . The position of the A 1g mode is mainly determined by the atomic mass of the surface group, and Br and Se lead to lower frequencies than Cl and S. The E g mode corresponds to the in-plane vibration of the surface group and the external Ti atom has a similar tendency [10]. The 153, 235, and 277 cm −1 characteristic peaks of the Ti 3 C 2 vibrational E g , A 1g , and E u modes appear in the bare Ti 3 C 2 MXene Raman spectra. The characteristic peaks of Ti 3 C 2 vibration E g and A 1g modes in Ti 3 C 2 -NH, Ti 3 C 2 -O, and Ti 3 C 2 T x are blue-shifted. As well, the E g mode of the in-plane vibration of the surface group does not exist in the region of 300–400 cm −1 where a characteristic peak appears corresponding to the E g mode of the in-plane vibration of the surface group. The assignment of the bare Ti 3 C 2 vibrational modes is based on the work of Hu et al. The appearance of the Raman-forbidden E u mode at 277 cm −1 may be related to the disorder present in the stack of bare Ti 3 C 2 MXene sheets.
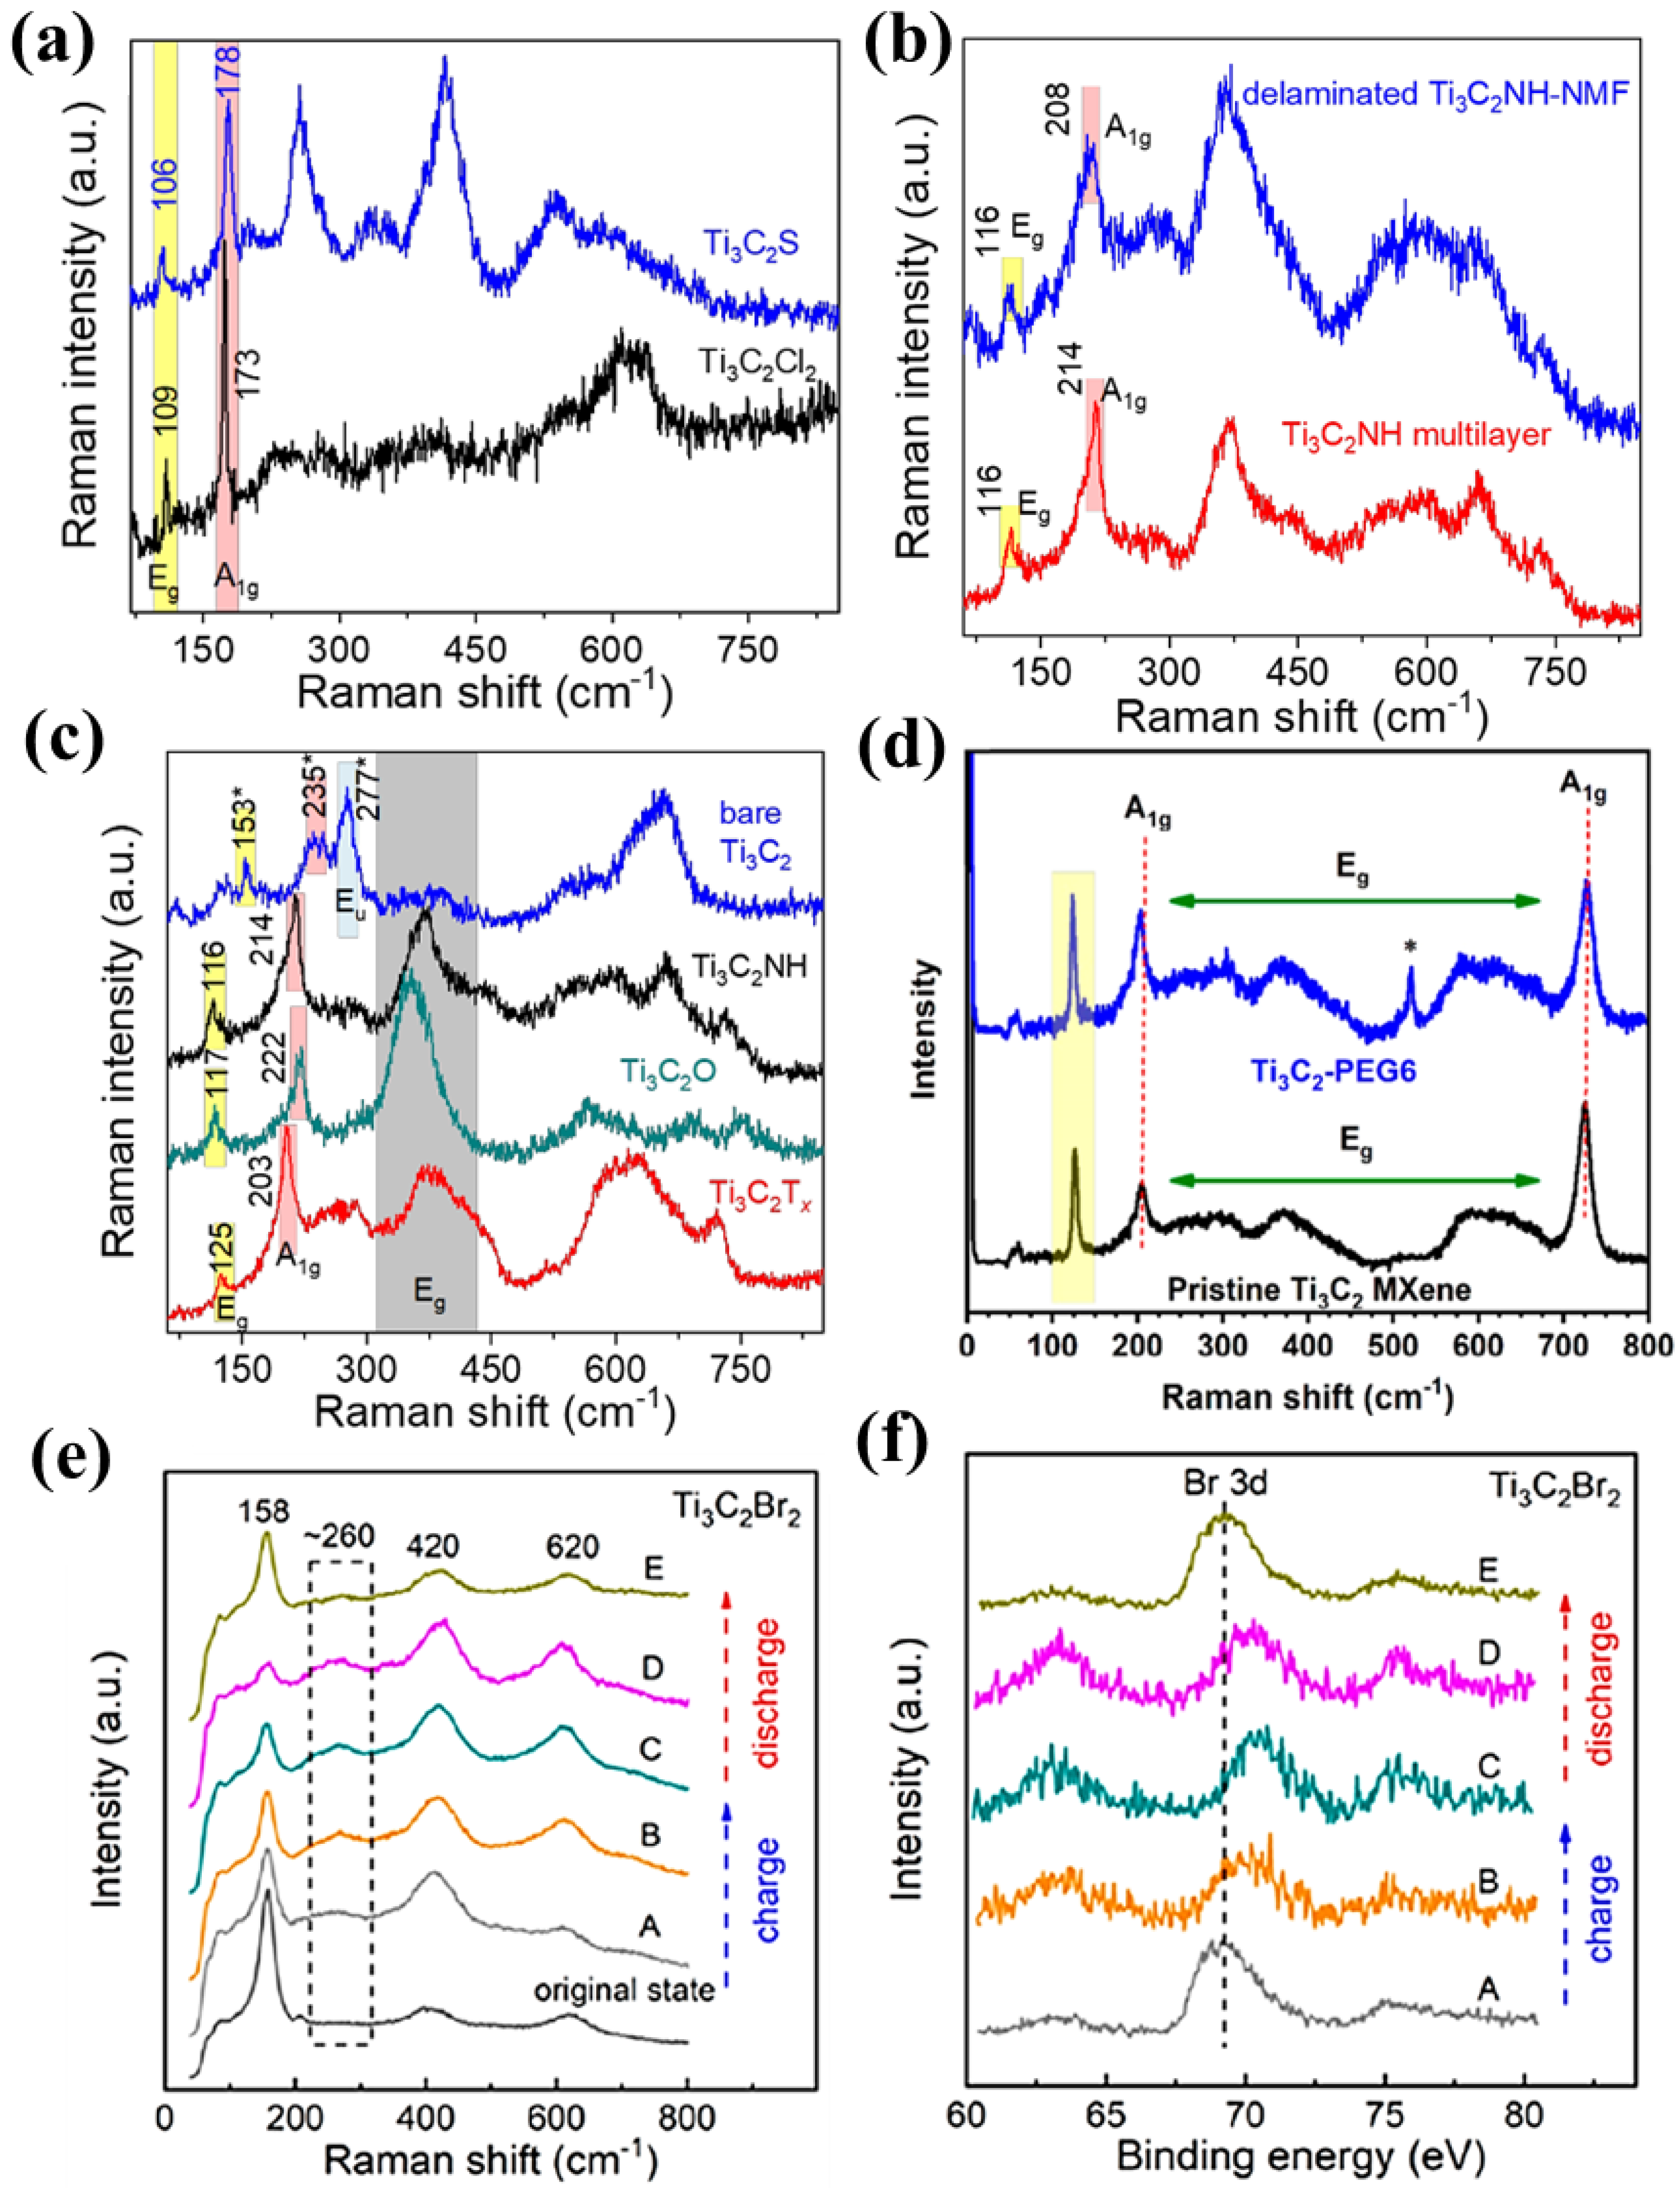
Figure 7. ( a ) Raman spectra of Ti 3 C 2 MXene at surface terminations of Cl, S [10]. ( b ) Ti 3 C 2 MXene at NH surface terminations [10]. ( c ) NH, O terminations, and naked MXene [10]. ( d ) Ti 3 C 2 -PEG6 sheets [14]. ( e ) Structure and composition change of the Ti 3 C 2 Br 2 electrode after cycling [4]. ( f ) For Ti 3 C 2 Br 2 , the voltage of each point is A: 0.3 V, B: 1.3 V, C: 2.2 V, D: 1.2 V, E: 0.3 V [4].
Raman spectroscopic analysis of Ti 3 C 2 -PEG6 flakes is shown in Figure 7d. First, the peak at 123 cm −1 is the result of the incident laser interacting with the plasmon resonance of the material. In addition, the planar peaks of (Ti, C, O) are clearly visible near 203 cm −1 and at 725 cm −1 . Second, the Raman peak position of A 1g is slightly shifted to the left when PEG6 is esterified to form a link, and there is a similar change when the surface group is changed. The most important feature is the absence of Raman stretching due to possible oxidation products during the processing and analysis of the Ti 3 C 2 MXene. If there is obvious oxidation in the PEG6-functionalized Ti 3 C 2 MXene sample, it is expected that a very pronounced Raman stretching will be observed due to the formation of TiO 2 [14]. Raman spectra show that there is no obvious oxidation of Ti 3 C 2 MXene flakes during the synthesis process, which is prevented by the extremely mild reaction conditions.
In particular, Raman can not only clarify the molecular structure of materials, but also illustrate the reaction process and energy conversion mechanism. To prove the energy conversion mechanism of halogenated MXene, the structural and compositional changes of Ti 3 C 2 Br 2 and Ti 3 C 2 I 2 under different charge-discharge states were studied. As shown in Figure 7e, f, a broad Raman shift at 260–270 cm −1 , corresponding to Br n − (3 ≤ n ≤ 5), was detected in the Ti 3 C 2 Br 2 electrode upon charging. Considering the reversible reaction, Br − + (n − 1) Br 0 ↔ Br n − , the formation of Br n − indicates the generation of Br 0 (Br 2 ) due to the oxidation of Br − . Upon discharge, after trapping electrons, the peak of Br n − disappears because Br 0 is restored to Br − [4].
In addition, a recent study showed that the low sensitivity of Raman scattering was improved by using gold or silver tips, increasing Raman scattering by six orders of magnitude. Although Raman spectroscopy of monolayer MXene sheets can be studied, Raman imaging of single sheets has not been reported so far.
FTIR is an infrared spectrometer based on the principle of the Fourier transform of infrared light after interference. It can be used for qualitative and quantitative analysis of samples, not only to measure the absorption and reflection spectra of various gas, solid and liquid samples, but also to measure chemical reactions in a short time.
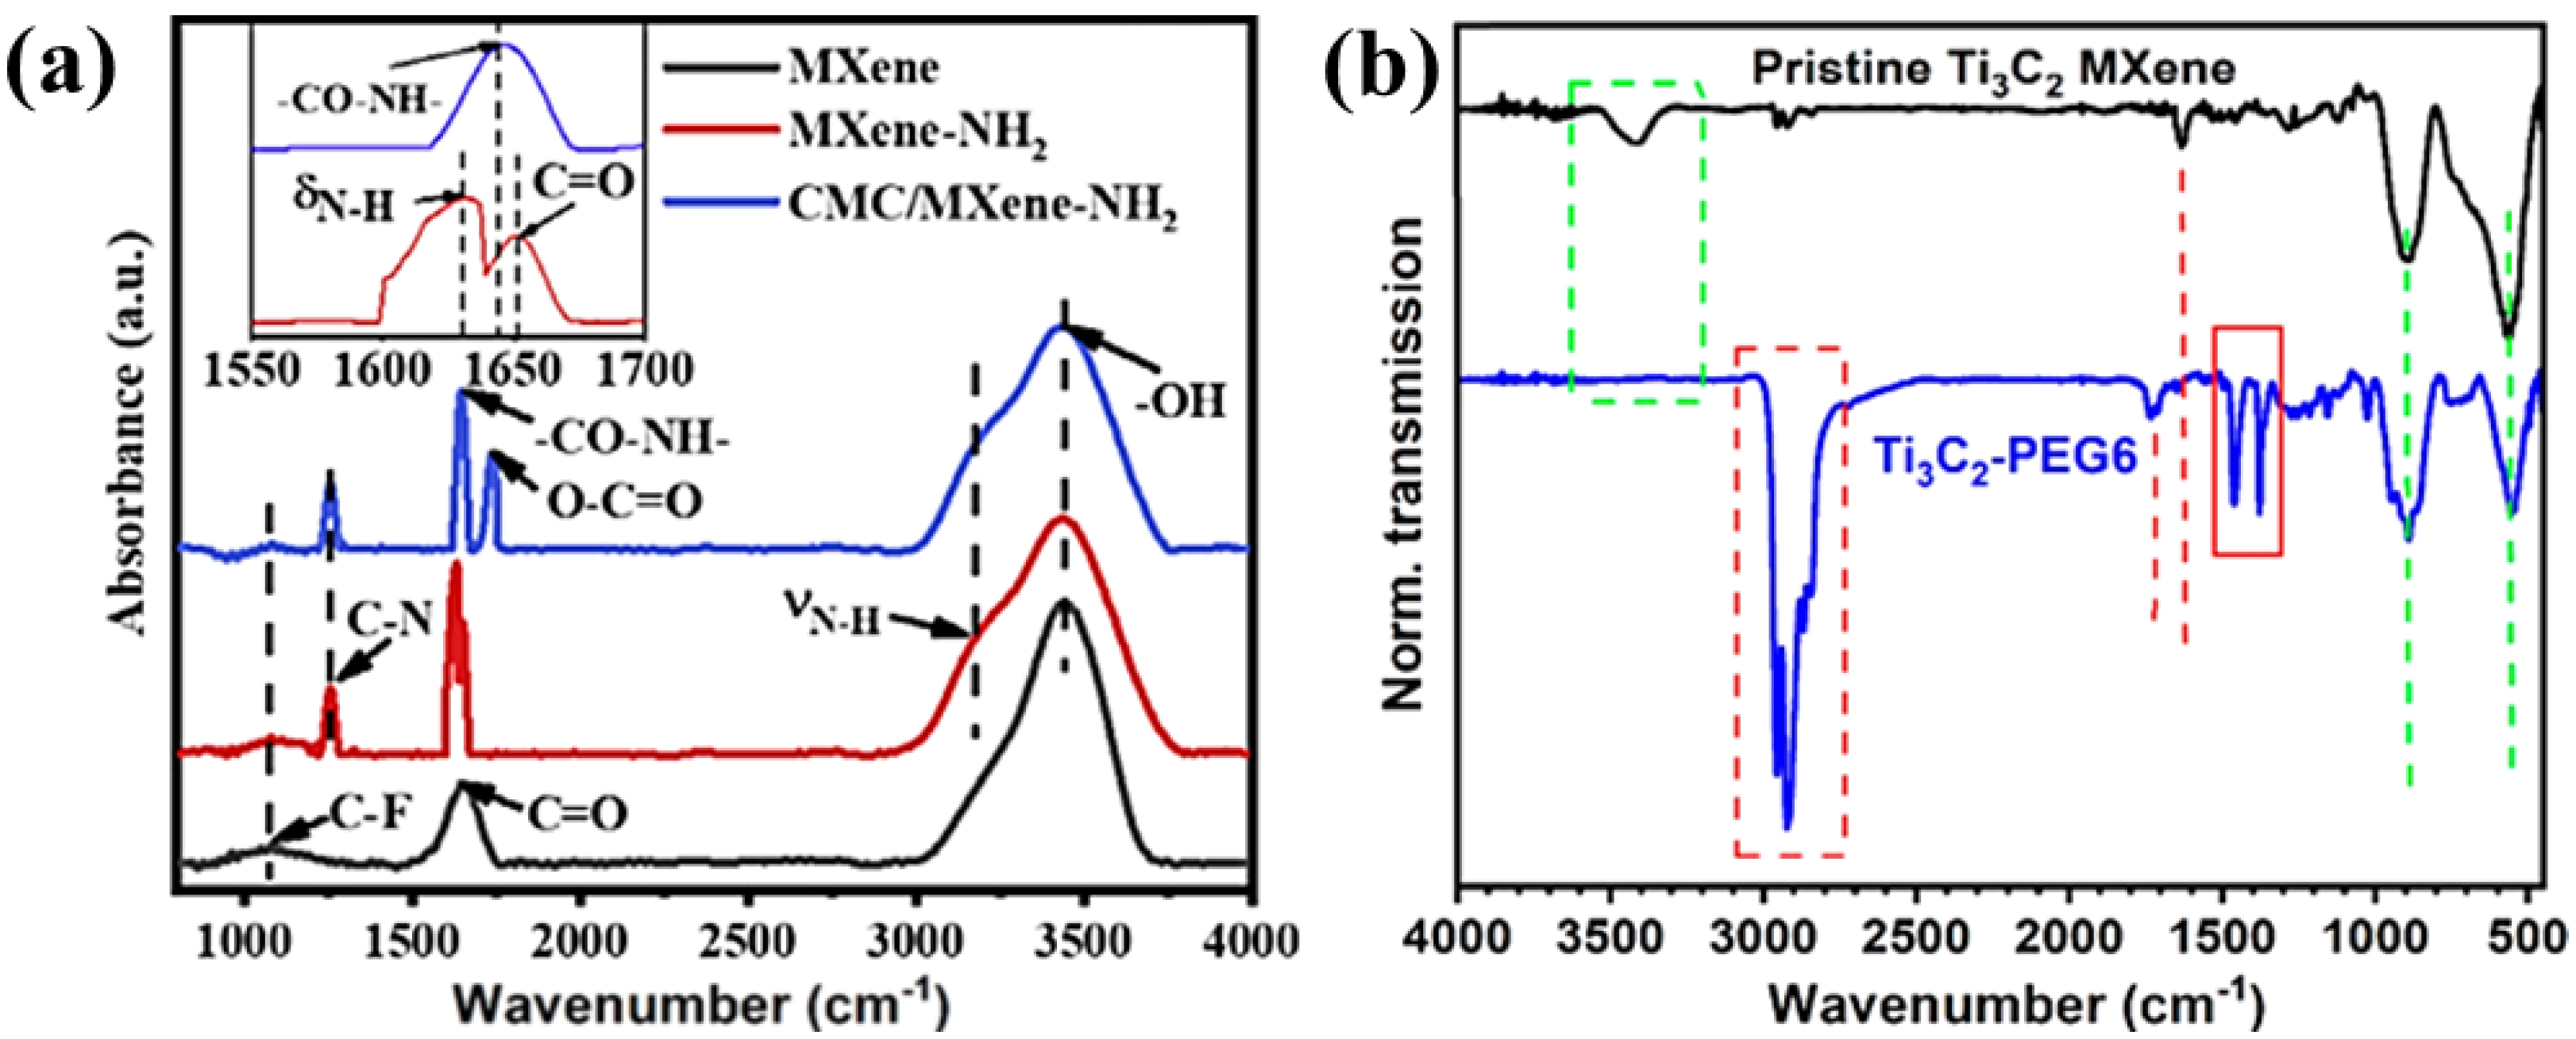
In order to determine the amino end groups on the surface of Ti 3 C 2 , FTIR spectroscopy was performed. As shown in Figure 8a, MXene-NH 2 also has -F, -O, -OH groups similar to traditional MXene. However, the appearance of two characteristic peaks can be observed. Generally, the characteristic peak at 3313 cm −1 corresponds to the N-H stretching vibration, and the peak at 1617 cm −1 is caused by the N-H bending vibration. Therefore, it can be preliminarily proved that amino groups are successfully introduced on the surface of MXene. In addition, the peak of the 1650 cm −1 CMC/MXene-NH 2 film was assigned to the amide group (-NH-CO-) stretching vibration, which was attributed to the thermal reaction between the carboxyl group in the CMC and the amino group on the MXene-NH 2 film. Thus, it further confirms the amination termination on the surface of MXene-NH 2 . This also makes the MXene-NH 2 nanosheets in the CMC/MXene-NH 2 composite film more compactly stacked. These interfacial covalent bonds will also impart enhanced mechanical properties to the CMC/MXene-NH 2 film. Figure 8b shows the FTIR spectra of pure Ti 3 C 2 MXene flakes and surface modification with PEG6-COOH. The green box indicates the presence of -OH in the sheet structure, and the green line represents a typical surface group bound to a Ti atom, such as the vibrational mode of Ti-O at ~550 cm −1 . The characteristic low-energy vibrational mode (green dashed line) remains unchanged even after the attachment of PEG6 (see blue spectrum). The O-H stretch at ~3400 cm −1 is absent, and it is thought that this may be due to the formation of -COO bonds by the esterification chemistry of all -OH. In addition, the carbonyl stretch of pristine Ti 3 C 2 is present in the Ti 3 C 2 -PEG6 flakes, as well as an additional carbonyl stretch at 1704 cm −1 , derived from the ester bond carbonyl. Therefore, the FTIR characterization strongly supports the covalent surface modification of pristine Ti 3 C 2 MXene with PEG6-COOH through ester bond formation.
6. Others
Figure 9a shows Ti 3 C 2 with Cl atoms as surface terminations. Ti 3 C 2 Cl 2 MXene shows good ordering along the basal plane, which is consistent with the strong (000l) peak in the XRD pattern. The electronic band structure and phonon spectrum calculated by DFT for a single layer of Ti 3 C 2 Cl 2 , which is essentially a metallic layer with a finite density of states at the Fermi level, are shown in Figure 9b. The phonon spectra also show that all phonon frequencies are positive, i.e., Ti 3 C 2 Cl 2 MXene is dynamically stable [1].

Figure 9. ( a ) The STEM/EDS of Ti 3 C 2 Cl 2 MXene [1]. ( b ) Electron band structure and phonon spectrum of monolayer Ti 3 C 2 Cl 2 calculated by DFT [1]. ( c ) The HAADF-STEM image of Ti 3 C 2 Br 2 and corresponding EDS element map [4]. ( d ) The HR-TEM image of Ti 3 C 2 Br 2 [4]. ( e ) The STEM image of Ti 3 C 2 Br 2 [4]. ( f ) EDS element diagram corresponding to Figure 21 e [4]. ( g ) Atomic and electronic structure of Ti 3 C 2 Br 2 , and Ti 3 C 2 I 2 [4]. ( h ) AFM image and size distribution of MXene-NH 2 nanosheets [13].
Figure 9c shows the HAADF-STEM image of Ti 3 C 2 Br 2 and the corresponding EDS elemental map. Br element was uniformly distributed on the particles, and no element segregation was observed. Figure 9d, HR-TEM image of Ti 3 C 2 Br 2 shows that the d value of the (0002) plane is ~11.77 Å, which is consistent with the XRD result [4]. Figure 9e,f are atomic resolution scanning transmission electron microscopy (STEM) images, and the corresponding EDS elemental maps show the -Br terminations of the Ti 3 C 2 surface. The brightness of the atoms depends on the mass-dependent scattering conditions, demonstrating also the successful functionalization of the MXene surface by Br. The atomic and electronic structures of two single-halogen-terminated MXene, Ti 3 C 2 Br 2, and Ti 3 C 2 I 2 , were investigated by density functional theory (DFT) calculations, as shown in Figure 9 9g. Atomic and electronic structures of Ti 3 C 2 Br 2 and Ti 3 C 2 I 2 . -Br and -I preferentially occupy the FCC site, which is similar to -Cl in Ti 3 C 2 Cl 2 and -O and -F in Ti 3 C 2 (OF). For the interplanar spacing of Ti 3 C 2 Br 2 and Ti 3 C 2 I 2 , the halogen terminations and the outermost Ti layer are 1.86 and 2.0606 Å, respectively, corresponding to the strong bonding of Ti-Br with a bond length of 2.6464 Å and the weaker bonding of Ti-I with a bond length of 2.8383 Å [4]. The bonding strength is further confirmed by the formation energy (Ef) of the halogen atoms on the surface of MXene, which is directly related to the bonding strength between the end group and the Ti 3 C 2 matrix. The calculated Ef for Ti 3 C 2 Br 2 and Ti 3 C 2 I 2 are −5.624 and −3.644 eV, respectively, which are less negative than the previously reported Ti 3 C 2 Cl 2 value of −6.694 eV, Ti 3 C 2 F 2 (−7.111 eV) and Ti 3 C 2 O 2 (−9.589 eV). In addition, the AFM image and size distribution of the obtained MXene-NH 2 nanosheets are shown in Figure 9h [13].
To establish an MXene characterization platform measuring the termination structure, elemental composition, and coordination relationship, and developing accurate quantitative test methods are the key route for MXene research.
However, quantitative analysis of MXene is still challenging due to the lack of accuracy. As well, most of the functional groups are light and difficult to detect and resolve. The development of new characterization methods is necessary for a further study of MXene surface terminations.
References
- Li, M.; Lu, J.; Luo, K.; Li, Y.; Chang, K.; Chen, K.; Zhou, J.; Rosen, J.; Hultman, L.; Eklund, P.; et al. Element Replacement Approach by Reaction with Lewis Acidic Molten Salts to Synthesize Nanolaminated MAX Phases and MXenes. J. Am. Chem. Soc. 2019, 141, 4730–4737.
- Naguib, M.; Kurtoglu, M.; Presser, V.; Lu, J.; Niu, J.; Heon, M.; Hultman, L.; Gogotsi, Y.; Barsoum, M.W. Two-Dimensional Nanocrystals Produced by Exfoliation of Ti3AlC2. Adv. Mater. 2011, 23, 4248–4253.
- Shen, M.; Jiang, W.; Liang, K.; Zhao, S.; Tang, R.; Zhang, L.; Wang, J. One-Pot Green Process to Synthesize MXene with Controllable Surface Terminations Using Molten Salts. Angew. Chem. Int. Ed. 2021, 60, 27013–27018.
- Li, M.; Li, X.; Qin, G.; Luo, K.; Lu, J.; Li, Y.; Liang, G.; Huang, Z.; Zhou, J.; Hultman, L.; et al. Halogenated Ti3C2 MXenes with Electrochemically Active Terminals for High-Performance Zinc Ion Batteries. ACS Nano 2021, 15, 1077–1085.
- Wu, Q.; Li, N.; Wang, Y.; Xu, Y.; Wu, J.; Jia, G.; Ji, F.; Fang, X.; Chen, F.; Cui, X. Ultrasensitive and Selective Determination of Carcinoembryonic Antigen Using Multifunctional Ultrathin Amino-Functionalized Ti3C2-MXene Nanosheets. Anal. Chem. 2020, 92, 3354–3360.
- Halim, J.; Cook, K.M.; Naguib, M.; Eklund, P.; Gogotsi, Y.; Rosen, J.; Barsoum, M.W. X-Ray Photoelectron Spectroscopy of Select Multi-Layered Transition Metal Carbides (MXenes). Appl. Surf. Sci. 2016, 362, 406–417.
- Schier, V.; Michel, H.-J.; Halbritter, J. ARXPS-Analysis of Sputtered TiC, SiC and Ti0.5Si0.5C Layers. Fresenius J. Anal. Chem. 1993, 346, 227–232.
- Magni, E.; Somorjai, G. Preparation of a Model Ziegler-Natta Catalyst: Electron Irradiation Induced Titanium Chloride Deposition on Magnesium Chloride Thin Films Grown on Gold. Surf. Sci. 1996, 345, 1–16.
- Mousty-Desbuquoit, C.; Riga, J.; Verbist, J.J. Solid State Effects in the Electronic Structure of TiCl4 Studied by XPS. J. Chem. Phys. 1983, 79, 26–32.
- Kamysbayev, V.; Filatov, A.S.; Hu, H.; Rui, X.; Lagunas, F.; Wang, D.; Klie, R.F.; Talapin, D.V. Covalent Surface Modifications and Superconductivity of Two-Dimensional Metal Carbide MXenes. Science 2020, 369, 979–983.
- Saha, N.C.; Tompkins, H.G. Titanium Nitride Oxidation Chemistry: An x-ray Photoelectron Spectroscopy Study. J. Appl. Phys. 1992, 72, 3072–3079.
- Tong, X.; Liu, S.; Zhao, Y.; Huang, L.; Crittenden, J.; Chen, Y. MXene Composite Membranes with Enhanced Ion Transport and Regulated Ion Selectivity. Environ. Sci. Technol. 2022, 56, 8964–8974.
- Peng, M.; Dong, M.; Wei, W.; Xu, H.; Liu, C.; Shen, C. The Introduction of Amino Termination on Ti3C2 MXene Surface for Its Flexible Film with Excellent Property. Carbon 2021, 179, 400–407.
- Lee, J.T.; Wyatt, B.C.; Davis, G.A.; Masterson, A.N.; Pagan, A.L.; Shah, A.; Anasori, B.; Sardar, R. Covalent Surface Modification of Ti3C2Tx MXene with Chemically Active Polymeric Ligands Producing Highly Conductive and Ordered Microstructure Films. ACS Nano 2021, 15, 19600–19612.
- Zhang, J.; Huang, C.; Sun, Y.; Yu, H. Amino-Functionalized Niobium-Carbide MXene Serving as Electron Transport Layer and Perovskite Additive for the Preparation of High-Performance and Stable Methylammonium-Free Perovskite Solar Cells. Adv. Funct. Mater. 2022, 32, 2113367.
- Miao, N.; Wang, J.; Gong, Y.; Wu, J.; Niu, H.; Wang, S.; Li, K.; Oganov, A.R.; Tada, T.; Hosono, H. Computational Prediction of Boron-Based MAX Phases and MXene Derivatives. Chem. Mater. 2020, 32, 6947.
- Karlsson, L.H.; Birch, J.; Halim, J.; Barsoum, M.W.; Persson, P.O.A. Atomically Resolved Structural and Chemical Investigation of Single MXene Sheets. Nano Lett. 2015, 15, 4955–4960.
More
Information
Subjects:
Physics, Atomic, Molecular & Chemical
Contributors
MDPI registered users' name will be linked to their SciProfiles pages. To register with us, please refer to https://encyclopedia.pub/register
:
View Times:
4.0K
Revisions:
2 times
(View History)
Update Date:
09 Nov 2022
Table of Contents


Notice
You are not a member of the advisory board for this topic. If you want to update advisory board member profile, please contact office@encyclopedia.pub.
OK
Confirm
Only members of the Encyclopedia advisory board for this topic are allowed to note entries. Would you like to become an advisory board member of the Encyclopedia?
Yes
No
${ textCharacter }/${ maxCharacter }
Submit
Cancel
Back
Comments
${ item }
|
${ item.createdUser.fullName }
${ item.createdAt }
${ item.vote }
${ item.reply }
Delete
${ reply.createdUser.fullName }
${ reply.createdAt }
${ reply.vote }
Delete
There is no reply to this comment~
${ item.replyTextCharacter }/${ item.replyMaxCharacter }
Submit
Cancel
More
No more~
There is no comment~
${ textCharacter }/${ maxCharacter }
Submit
Cancel
${ selectedItem.replyTextCharacter }/${ selectedItem.replyMaxCharacter }
Submit
Cancel
Confirm
Are you sure to Delete?
Yes
No