 +1 credit
| Version | Summary | Created by | Modification | Content Size | Created at | Operation |
|---|---|---|---|---|---|---|
| 1 | Dean Liu | -- | 4035 | 2022-11-03 01:39:32 |
Video Upload Options
The Flynn effect is the substantial and long-sustained increase in both fluid and crystallized intelligence test scores that were measured in many parts of the world over the 20th century. When intelligence quotient (IQ) tests are initially standardized using a sample of test-takers, by convention the average of the test results is set to 100 and their standard deviation is set to 15 or 16 IQ points. When IQ tests are revised, they are again standardized using a new sample of test-takers, usually born more recently than the first. Again, the average result is set to 100. However, when the new test subjects take the older tests, in almost every case their average scores are significantly above 100. Test score increases have been continuous and approximately linear from the earliest years of testing to the present. For example, a study published in the year 2009 found that British children's average scores on the Raven's Progressive Matrices test rose by 14 IQ points from 1942 to 2008. Similar gains have been observed in many other countries in which IQ testing has long been widely used, including other Western European countries, Japan, and South Korea. There are numerous proposed explanations of the Flynn effect, as well as some skepticism about its implications. Similar improvements have been reported for semantic and episodic memory. Some research suggests that there may be an ongoing reversed Flynn effect, i.e. a decline in IQ scores, in Norway, Denmark, Australia, Britain, the Netherlands, Sweden, Finland, and German-speaking countries, a development which appears to have started in the 1990s, but in certain cases an apparent reversal is due to cultural changes making parts of intelligence tests obsolete. Meta-analyses indicate that overall, the Flynn effect continues either at the same rate or at a slower rate in developed countries.
1. Origin of Term
The Flynn effect is named for James R. Flynn, who did much to document it and promote awareness of its implications. The term itself was coined by Richard Herrnstein and Charles Murray in their book The Bell Curve.[1][2][3] Although the general term for the phenomenon—referring to no researcher in particular—continues to be "secular rise in IQ scores", many textbooks on psychology and IQ testing have now followed the lead of Herrnstein and Murray in calling the phenomenon the Flynn effect.[4]
2. Rise in IQ
IQ tests are updated periodically. For example, the Wechsler Intelligence Scale for Children (WISC), originally developed in 1949, was updated in 1974, 1991, 2003, and again in 2014. The revised versions are standardized based on the performance of test-takers in standardization samples. A standard score of IQ 100 is defined as the median performance of the standardization sample. Thus one way to see changes in norms over time is to conduct a study in which the same test-takers take both an old and new version of the same test. Doing so confirms IQ gains over time. Some IQ tests, for example, tests used for military draftees in NATO countries in Europe, report raw scores, and those also confirm a trend of rising scores over time. The average rate of increase seems to be about three IQ points per decade in the United States, as scaled by the Wechsler tests. The increasing test performance over time appears on every major test, in every age range, at every ability level, and in every modern industrialized country, although not necessarily at the same rate as in the United States. The increase was continuous and roughly linear from the earliest days of testing to the mid-1990s.[5] Though the effect is most associated with IQ increases, a similar effect has been found with increases in attention and of semantic and episodic memory.[6]
Ulric Neisser estimated that using the IQ values of 1997, the average IQ of the United States in 1932, according to the first Stanford–Binet Intelligence Scales standardization sample, was 80. Neisser states that "Hardly any of them would have scored 'very superior', but nearly one-quarter would have appeared to be 'deficient.'" He also wrote that "Test scores are certainly going up all over the world, but whether intelligence itself has risen remains controversial."[5]
Trahan et al. (2014) found that the effect was about 2.93 points per decade, based on both Stanford–Binet and Wechsler tests; they also found no evidence the effect was diminishing.[7] In contrast, Pietschnig and Voracek (2015) reported, in their meta-analysis of studies involving nearly 4 million participants, that the Flynn effect had decreased in recent decades. They also reported that the magnitude of the effect was different for different types of intelligence ("0.41, 0.30, 0.28, and 0.21 IQ points annually for fluid, spatial, full-scale, and crystallized IQ test performance, respectively"), and that the effect was stronger for adults than for children.[8]
Raven (2000) found that, as Flynn suggested, data interpreted as showing a decrease in many abilities with increasing age must be re-interpreted as showing that there has been a dramatic increase of these abilities with the date of birth. On many tests this occurs at all levels of ability.[9]
Some studies have found the gains of the Flynn effect to be particularly concentrated at the lower end of the distribution. Teasdale and Owen (1989), for example, found the effect primarily reduced the number of low-end scores, resulting in an increased number of moderately high scores, with no increase in very high scores.[10] In another study, two large samples of Spanish children were assessed with a 30-year gap. Comparison of the IQ distributions indicated that the mean IQ scores on the test had increased by 9.7 points (the Flynn effect), the gains were concentrated in the lower half of the distribution and negligible in the top half, and the gains gradually decreased as the IQ of the individuals increased.[11] Some studies have found a reverse Flynn effect with declining scores for those with high IQ.[8][12]
In 1987, Flynn took the position that the very large increase indicates that IQ tests do not measure intelligence but only a minor sort of "abstract problem-solving ability" with little practical significance. He argued that if IQ gains do reflect intelligence increases, there would have been consequent changes of our society that have not been observed (a presumed non-occurrence of a "cultural renaissance").[5] Flynn no longer endorses this view of intelligence and has since elaborated and refined his view of what rising IQ scores mean.[13]
2.1. Precursors to Flynn's Publications
Earlier investigators had discovered rises in raw IQ test scores in some study populations, but had not published general investigations of that issue in particular. Historian Daniel C. Calhoun cited earlier psychology literature on IQ score trends in his book The Intelligence of a People (1973).[14] R. L. Thorndike drew attention to rises in Stanford-Binet scores in a 1975 review of the history of intelligence testing.[15] Richard Lynn recorded an increase in Japanese IQ in 1982.[16]
2.2. Intelligence
There is debate about whether the rise in IQ scores also corresponds to a rise in general intelligence, or only a rise in special skills related to taking IQ tests. Because children attend school longer now and have become much more familiar with the testing of school-related material, one might expect the greatest gains to occur on such school content-related tests as vocabulary, arithmetic or general information. Just the opposite is the case: abilities such as these have experienced relatively small gains and even occasional decreases over the years. Meta-analytic findings indicate that Flynn effects occur for tests assessing both fluid and crystallized abilities. For example, Dutch conscripts gained 21 points during only 30 years, or 7 points per decade, between 1952 and 1982.[5] But this rise in IQ test scores is not wholly explained by an increase in general intelligence. Studies have shown that while test scores have improved over time, the improvement is not fully correlated with latent factors related to intelligence.[17] Rushton argues that the gains in IQ over time (the Lynn-Flynn effect) are unrelated to g.[18][19] Other researchers argue that the IQ gains described by the Flynn effect are due in part to increasing intelligence, and in part to increases in test-specific skills.[20][21][22] In parallel with the measured gains in IQ scores, long-term declines have been found for "mental speed, digit span backwards, the use of difficult words, and color acuity, all of which are related to intelligence".[23]
3. Proposed Explanations
3.1. Schooling and Test Familiarity
The duration of average schooling has increased steadily. One problem with this explanation is that if in the US comparing older and more recent subjects with similar educational levels, then the IQ gains appear almost undiminished in each such group considered individually.[5]
Many studies find that children who do not attend school score drastically lower on the tests than their regularly attending peers. During the 1960s, when some Virginia counties closed their public schools to avoid racial integration, compensatory private schooling was available only for Caucasian children. On average, the scores of African-American children who received no formal education during that period decreased at a rate of about six IQ points per year.[5]
Another explanation is an increased familiarity of the general population with tests and testing. For example, children who take the very same IQ test a second time usually gain five or six points. However, this seems to set an upper limit on the effects of test sophistication. One problem with this explanation and others related to schooling is that in the US, the groups with greater test familiarity show smaller IQ increases.[5]
Early intervention programs have shown mixed results. Some preschool (ages 3–4) intervention programs like "Head Start" do not produce lasting changes of IQ, although they may confer other benefits. The "Abecedarian Early Intervention Project", an all-day program that provided various forms of environmental enrichment to children from infancy onward, showed IQ gains that did not diminish over time. The IQ difference between the groups, although only five points, was still present at age 12. Not all such projects have been successful.[5] Also, such IQ gains can diminish until age 18.[24]
Citing a high correlation between rising literacy rates and gains in IQ, David Marks has argued that the Flynn effect is caused by changes in literacy rates.[25]
3.2. Generally More Stimulating Environment
Still another theory is that the general environment today is much more complex and stimulating. One of the most striking 20th-century changes in the human intellectual environment has come from the increase of exposure to many types of visual media. From pictures on the wall to movies to television to video games to computers, each successive generation has been exposed to richer optical displays than the one before and may have become more adept at visual analysis. This would explain why visual tests like the Raven's have shown the greatest increases. An increase only of particular forms of intelligence would explain why the Flynn effect has not caused a "cultural renaissance too great to be overlooked."[5]
In 2001, William Dickens and James Flynn presented a model for resolving several contradictory findings regarding IQ. They argue that the measure "heritability" includes both a direct effect of the genotype on IQ and also indirect effects such that the genotype changes the environment, thereby affecting IQ. That is, those with a greater IQ tend to seek stimulating environments that further increase IQ. These reciprocal effects result in gene environment correlation. The direct effect could initially have been very small, but feedback can create large differences in IQ. In their model, an environmental stimulus can have a very great effect on IQ, even for adults, but this effect also decays over time unless the stimulus continues (the model could be adapted to include possible factors, like nutrition during early childhood, that may cause permanent effects). The Flynn effect can be explained by a generally more stimulating environment for all people. The authors suggest that any program designed to increase IQ may produce long-term IQ gains if that program teaches children how to replicate the types of cognitively demanding experiences that produce IQ gains outside the program. To maximize lifetime IQ, the programs should also motivate them to continue searching for cognitively demanding experiences after they have left the program.[26][27]
Flynn in his 2007 book What Is Intelligence? further expanded on this theory. Environmental changes resulting from modernization—such as more intellectually demanding work, greater use of technology, and smaller families—have meant that a much larger proportion of people are more accustomed to manipulating abstract concepts such as hypotheses and categories than a century ago. Substantial portions of IQ tests deal with these abilities. Flynn gives, as an example, the question 'What do a dog and a rabbit have in common?' A modern respondent might say they are both mammals (an abstract, or a priori answer, which depends only on the meanings of the words dog and rabbit), whereas someone a century ago might have said that humans catch rabbits with dogs (a concrete, or a posteriori answer, which depended on what happened to be the case at that time).
3.3. Nutrition
Improved nutrition is another possible explanation. Today's average adult from an industrialized nation is taller than a comparable adult of a century ago. That increase of stature, likely the result of general improvements in nutrition and health, has been at a rate of more than a centimeter per decade. Available data suggest that these gains have been accompanied by analogous increases in head size, and by an increase in the average size of the brain.[5][28] This argument had been thought to suffer the difficulty that groups who tend to be of smaller overall body size (e.g. women, or people of Asian ancestry) do not have lower average IQs.[10]
A 2005 study presented data supporting the nutrition hypothesis, which predicts that gains will occur predominantly at the low end of the IQ distribution, where nutritional deprivation is probably most severe.[11] An alternative interpretation of skewed IQ gains could be that improved education has been particularly important for this group.[10] Richard Lynn makes the case for nutrition, arguing that cultural factors cannot typically explain the Flynn effect because its gains are observed even at infant and preschool levels, with rates of IQ test score increase about equal to those of school students and adults. Lynn states that "This rules out improvements in education, greater test sophistication, etc., and most of the other factors that have been proposed to explain the Flynn effect. He proposes that the most probable factor has been improvements in pre-natal and early post-natal nutrition."[29]
A century ago, nutritional deficiencies may have limited body and organ functionality, including skull volume. The first two years of life are a critical time for nutrition. The consequences of malnutrition can be irreversible and may include poor cognitive development, educability, and future economic productivity.[30] On the other hand, Flynn has pointed to 20-point gains on Dutch military (Raven's type) IQ tests between 1952, 1962, 1972, and 1982. He observes that the Dutch 18-year-olds of 1962 had a major nutritional handicap. They were either in the womb or were recently born, during the great Dutch famine of 1944—when German troops monopolized food and 18,000 people died of starvation.[31] Yet, concludes Flynn, "they do not show up even as a blip in the pattern of Dutch IQ gains. It is as if the famine had never occurred."[32][33] It appears that the effects of diet are gradual, taking effect over decades (affecting mother as well as the child) rather than a few months.
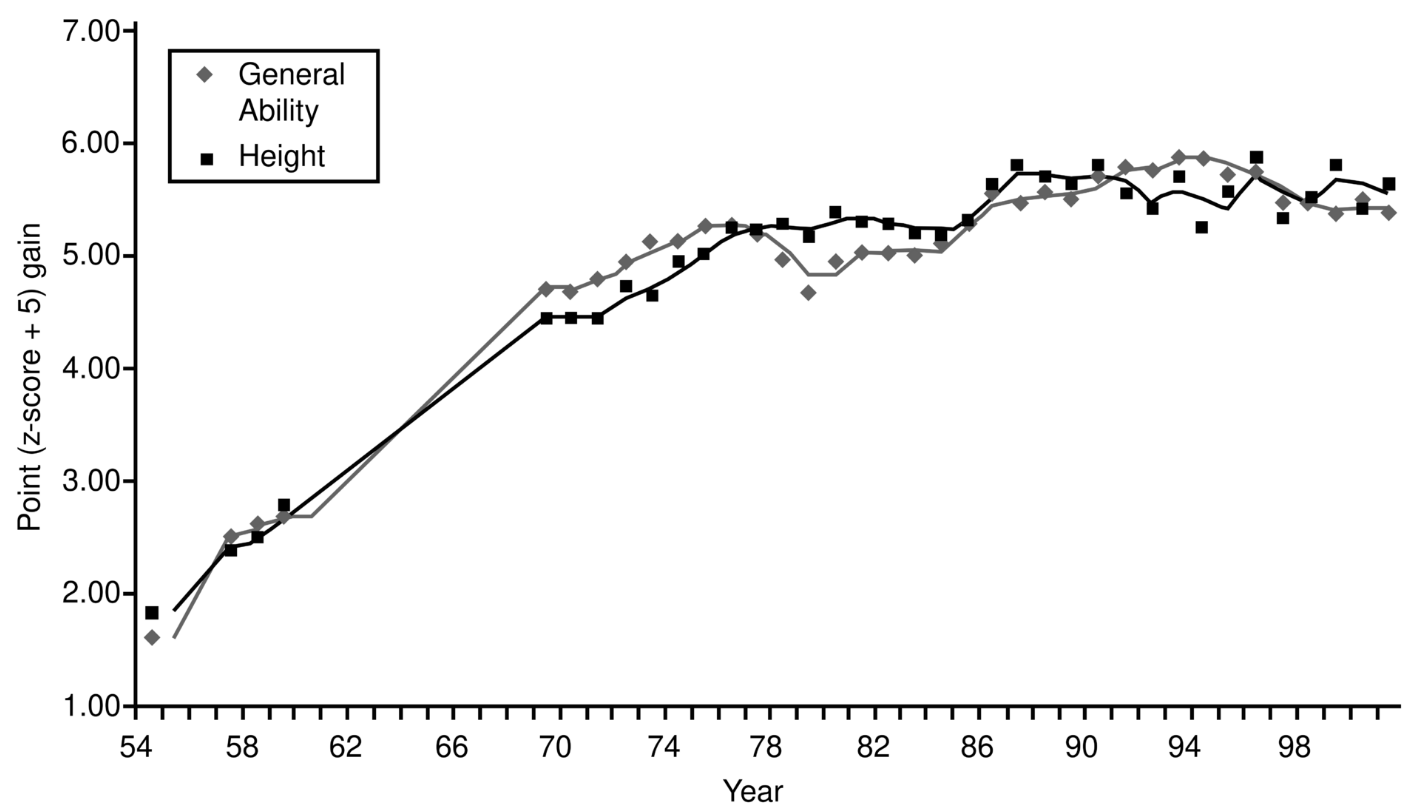
In support of the nutritional hypothesis, it is known that, in the United States, the average height before 1900 was about 10 cm (∼4 inches) shorter than it is today.[34] Possibly related to the Flynn effect is a similar change of skull size and shape during the last 150 years. Though the idea that brain size is unrelated to race and intelligence was popularized in the 1980s, studies continue to show significant correlations.[35] A Norwegian study found that height gains were strongly correlated with intelligence gains until the cessation of height gains in military conscript cohorts towards the end of the 1980s.[36] Both height and skull size increases probably result from a combination of phenotypic plasticity and genetic selection over this period.[37] With only five or six human generations in 150 years, time for natural selection has been very limited, suggesting that increased skeletal size resulting from changes in population phenotypes is more likely than recent genetic evolution.
It is well known that micronutrient deficiencies change the development of intelligence. For instance, one study has found that iodine deficiency causes a fall, on average, of 12 IQ points in China.[38]
Scientists James Feyrer, Dimitra Politi, and David N. Weil have found in the U.S. that the proliferation of iodized salt increased IQ by 15 points in some areas. Journalist Max Nisen has stated that with this type of salt becoming popular, that "the aggregate effect has been extremely positive."[39]
Daley et al. (2003) found a significant Flynn effect among children in rural Kenya, and concluded that nutrition was one of the hypothesized explanations that best explained their results (the others were parental literacy and family structure).[40]
3.4. Infectious Diseases
Eppig, Fincher, and Thornhill (2009) argue that "From an energetics standpoint, a developing human will have difficulty building a brain and fighting off infectious diseases at the same time, as both are very metabolically costly tasks" and that "the Flynn effect may be caused in part by the decrease in the intensity of infectious diseases as nations develop." They suggest that improvements in gross domestic product (GDP), education, literacy, and nutrition may have an effect on IQ mainly through reducing the intensity of infectious diseases.[41]
Eppig, Fincher, and Thornhill (2011) in a similar study instead looking at different US states found that states with a higher prevalence of infectious diseases had lower average IQ. The effect remained after controlling for the effects of wealth and educational variation.[42]
Atheendar Venkataramani (2010) studied the effect of malaria on IQ in a sample of Mexicans. Malaria eradication during the birth year was associated with increases in IQ. It also increased the probability of employment in a skilled occupation. The author suggests that this may be one explanation for the Flynn effect and that this may be an important explanation for the link between national malaria burden and economic development.[43] A literature review of 44 papers states that cognitive abilities and school performance were shown to be impaired in sub-groups of patients (with either cerebral malaria or uncomplicated malaria) when compared with healthy controls. Studies comparing cognitive functions before and after treatment for acute malarial illness continued to show significantly impaired school performance and cognitive abilities even after recovery. Malaria prophylaxis was shown to improve cognitive function and school performance in clinical trials when compared to placebo groups.[44]
3.5. Heterosis
Heterosis, or hybrid vigor associated with historical reductions of the levels of inbreeding, has been proposed by Michael Mingroni as an alternative explanation of the Flynn effect. However, James Flynn has pointed out that even if everyone mated with a sibling in 1900, subsequent increases in heterosis would not be a sufficient explanation of the observed IQ gains.[45]
4. Possible End of Progression
Jon Martin Sundet and colleagues (2004) examined scores on intelligence tests given to Norway conscripts between the 1950s and 2002. They found that the increase of scores of general intelligence stopped after the mid-1990s and declined in numerical reasoning sub-tests.[36]
Teasdale and Owen (2005) examined the results of IQ tests given to Denmark male conscripts. Between 1959 and 1979 the gains were 3 points per decade. Between 1979 and 1989 the increase approached 2 IQ points. Between 1989 and 1998 the gain was about 1.3 points. Between 1998 and 2004 IQ declined by about the same amount as it gained between 1989 and 1998. They speculate that "a contributing factor in this recent fall could be a simultaneous decline in proportions of students entering 3-year advanced-level school programs for 16–18-year-olds."[46] The same authors in a more comprehensive 2008 study, again on Danish male conscripts, found that there was a 1.5-point increase between 1988 and 1998, but a 1.5-point decrease between 1998 and 2003/2004. A possible contributing factor to the more recent decline may be the changes in the Danish educational system. Another may be the rising proportion of immigrants or their immediate descendants in Denmark. This is supported by data on Danish draftees where first or second-generation immigrants with Danish nationality score below average.[47]
In Australia, the IQ of 6–12 year olds as measured by the Colored Progressive Matrices has shown no increase from 1975–2003.[48]
In the United Kingdom, a study by Flynn (2009) found that tests carried out in 1980 and again in 2008 show that the IQ score of an average 14-year-old dropped by more than two points over the period. For the upper half of the results, the performance was even worse. Average IQ scores declined by six points. However, children aged between five and 10 saw their IQs increase by up to half a point a year over the three decades. Flynn argues that the abnormal drop in British teenage IQ could be due to youth culture having "stagnated" or even dumbed down. He also states that the youth culture is more oriented towards computer games than towards reading and holding conversations. Researcher Richard House, commenting on the study, also mentions the computer culture diminishing reading books as well as a tendency towards teaching to the test.[49][50]
Stefansson et al. (2017) argue for a decline in polygenic scores pertaining to educational attainment in Icelandic individuals born from 1910 to 1990. They point out that the effect observed is extremely negligible, however, and may only be of concern if the trend is assumed to be larger in genomic effect and continues across centuries.[51]
Bratsberg & Rogeberg (2018) present evidence that the Flynn effect in Norway has reversed, and that both the original rise in mean IQ scores and their subsequent decline was caused by environmental factors. They conclude that environmental factors explain all or almost all of the decline, and the hypothesized declines in genotypic IQ is negligible, although they "cannot rule out the theoretical possibility of negative selection on a genetic component that is masked when assessed using environmentally influenced measures", not being able to rule out the decline posited by Stefansson et al.[52]
One possible explanation of a worldwide decline in intelligence, suggested by the World Health Organization and the Forum of International Respiratory Societies' Environmental Committee, is an increase in air pollution, which now affects over 90% of the world's population.[53][54]
5. IQ Group Differences
If the Flynn effect has ended in developed nations but continues in less developed ones, this would tend to diminish national differences in IQ scores.[47]
Also, if the Flynn effect has ended for the majority in developed nations, it may still continue for minorities, especially for groups like immigrants where many may have received poor nutrition during early childhood or have had other disadvantages. A study in the Netherlands found that children of non-Western immigrants had improvements for g, educational achievements, and work proficiency compared to their parents, although there were still remaining differences compared to ethnic Dutch.[21]
In the United States, the IQ gap between black and white people was gradually closing over the last decades of the 20th century, as black test-takers increased their average scores relative to white test-takers. For instance, Vincent reported in 1991 that the black–white IQ gap was decreasing among children, but that it was remaining constant among adults.[55] Similarly, a 2006 study by Dickens and Flynn estimated that the difference between mean scores of black people and white people closed by about 5 or 6 IQ points between 1972 and 2002,[56] a reduction of about one-third. In the same period, the educational achievement disparity also diminished.[57] Reviews by Flynn and Dickens,[58] Mackintosh,[59] and Nisbett et al. [60][61] all concluded that the gradual closing of the gap was a real phenomenon.
Flynn has commented that he never claimed that the Flynn effect has the same causes as the black-white gap, but that it shows that environmental factors can create IQ differences of a magnitude similar to the gap.[62] Research that has examined whether g factor and IQ gains from the Flynn effect are related have found there is a negative correlation between the two, which may indicate that group differences and the Flynn effect are possibly due to differing causes.[63]
The Flynn effect has also been part of the discussions regarding Spearman's hypothesis, which states that differences in the g factor are the major source of differences between blacks and whites observed in many studies of race and intelligence.[64]
References
- Flynn, James R. (2009). What Is Intelligence: Beyond the Flynn Effect (expanded paperback ed.). Cambridge: Cambridge University Press. pp. 1–2. ISBN 978-0-521-74147-7. "The 'Flynn effect' is the name that has become attached to an exciting development, namely, that the twentieth century saw massive IQ gains from one generation to another. To forestall a diagnosis of megalomania, the label was coined by Herrnstein and Murray, the authors of The Bell Curve, and not by myself." https://www.wikipedia.org/wiki/Cambridge%20University%20Press
- Shalizi, Cosma (27 April 2009). "The Domestication of the Savage Mind". http://www.cscs.umich.edu/~crshalizi/reviews/flynn-beyond/.
- Herrnstein, Richard J.; Murray, Charles (1994). The Bell Curve: Intelligence and Class Structure in American Life. New York: The Free Press. pp. 307. ISBN 0-02-914673-9. https://archive.org/details/bellcurveintell00herr/page/307/mode/1up.
- Fletcher, Richard B.; Hattie, John (2011). Intelligence and Intelligence Testing. Taylor & Francis. p. 26. ISBN 978-1-136-82321-3. https://books.google.com/books?id=8pzDawey6akC. Retrieved August 31, 2013. "Indeed, this effect, now called the 'Flynn effect', is well established. Nations, almost without exception, have shown gains of about 20 IQ points per generation (30 years). These gains are highest for IQ tests that are most related to reasoning and the capacity to figure out novel problems (this is often called 'fluid intelligence', see Chapter 5); and least related to knowledge, which arises from better educational opportunity, a history of persistence and good motivation for learning (this is often called 'crystallized intelligence', see Chapter 5)." Freeman, Joan (2010). Gifted Lives: What Happens when Gifted Children Grow Up. London: Routledge. pp. 290–91. ISBN 978-0-415-47009-4. "A strange new phenomenon has been growing since about 1950, called the 'Flynn Effect' after Professor James Flynn of the University of Otago, New Zealand. In his book What is Intelligence ?, Flynn describes a year-on-year rise in measured intelligence, about three IQ points a decade." Barbieri, Annalisa (8 October 2010). "Young, gifted and likely to suffer for it". The Guardian. https://www.theguardian.com/lifeandstyle/2010/oct/09/gifted-children-joan-freeman-psychologist. Urbina, Susana (2004). Essentials of Psychological Testing. John Wiley & Sons. p. 103. ISBN 978-0-471-41978-5. "A puzzling longitudinal trend in the opposite direction, known as the 'Flynn effect', has been well documented in successive revisions of major intelligence tests (like the S-B and the Wechsler scales) that invariably involve the administration of both the old and new versions to a segment of the newer standardization sample, for comparative purposes. Data from revisions of various intelligence tests in the United States as well as in other countries—extensively analyzed by J.R. Flynn (1984, 1987)—show a pronounced, long-term upward trend in the level of performance required to obtain any given IQ score. The Flynn effect presumably reflects population gains over time in the kinds of cognitive performance that intelligence tests sample." Wasserman, John D. (2012). "Chapter 18: Assessment of Intellectual Functioning". in Weiner, Irving B.; Graham, John R.; Naglieri, Jack A.. Handbook of Psychology. 10: Assessment Psychology. John Wiley & Sons. p. 486. ISBN 978-0-470-89127-8. "Both definitions also specify that the intellectual functioning criterion for a diagnosis of intellectual disability is approximately 2 SDs or more below the normative mean, but factors such as test score statistical error (standard error of measurement), test fairness, normative expectations for the population of interest, the Flynn effect, and practice effects from previous testing need to be considered before arriving at any diagnosis." Chamorro-Premuzic, Tomas (2011). Personality and Individual Differences. Wiley. p. 221. ISBN 978-1-4051-9927-8. "Flynn effect The finding by sociologist James Flynn that there are generational increases in IQ across nations."
- Neisser U (1997). "Rising Scores on Intelligence Tests". American Scientist 85 (5): 440–47. Bibcode: 1997AmSci..85..440N. http://www.americanscientist.org/issues/feature/rising-scores-on-intelligence-tests/99999.
- "Flynn effects on sub-factors of episodic and semantic memory: parallel gains over time and the same set of determining factors". Neuropsychologia 47 (11): 2174–80. September 2009. doi:10.1016/j.neuropsychologia.2008.11.007. PMID 19056409. https://dx.doi.org/10.1016%2Fj.neuropsychologia.2008.11.007
- Trahan, LH; Stuebing, KK; Fletcher, JM; Hiscock, M (September 2014). "The Flynn effect: a meta-analysis.". Psychological Bulletin 140 (5): 1332–60. doi:10.1037/a0037173. PMID 24979188. http://www.pubmedcentral.nih.gov/articlerender.fcgi?tool=pmcentrez&artid=4152423
- Jakob Pietschnig; Martin Voracek (May 1, 2015). "One Century of Global IQ Gains: A Formal Meta-Analysis of the Flynn Effect (1909–2013)" (in en). Perspectives on Psychological Science 10 (3): 282–306. doi:10.1177/1745691615577701. ISSN 1745-6916. PMID 25987509. https://dx.doi.org/10.1177%2F1745691615577701
- Raven John (2000). "The Raven's Progressive Matrices: Change and Stability over Culture and Time". Cognitive Psychology 41 (1): 1–48. doi:10.1006/cogp.1999.0735. PMID 10945921. http://eyeonsociety.co.uk/resources/RPMChangeAndStability.pdf. Retrieved July 9, 2011.
- Teasdale, T. (1989). "Continuing secular increases in intelligence and a stable prevalence of high intelligence levels". Intelligence 13 (3): 255–62. doi:10.1016/0160-2896(89)90021-4. https://dx.doi.org/10.1016%2F0160-2896%2889%2990021-4
- Colom, R.; Lluis-Font, J.M.; Andrés-Pueyo, A. (2005). "The generational intelligence gains are caused by decreasing variance in the lower half of the distribution: Supporting evidence for the nutrition hypothesis". Intelligence 33 (1): 83–91. doi:10.1016/j.intell.2004.07.010. http://synapse.princeton.edu/~brained/chapter15/colom_andres-pueyo05_intelligence_Spanish-schoolchildren-nutrition-hypothesis.pdf. Retrieved October 4, 2012.
- Dutton Edward; Lynn Richard (2013). "A negative Flynn effect in Finland, 1997–2009". Intelligence 41 (6): 817–20. doi:10.1016/j.intell.2013.05.008. https://dx.doi.org/10.1016%2Fj.intell.2013.05.008
- Tucker, Ian (2012-09-22). "James Flynn: IQ may go up as well as down" (in en-GB). The Guardian. ISSN 0261-3077. https://www.theguardian.com/technology/2012/sep/23/james-flynn-iq-scores-environment.
- Calhoun, Daniel (1973). The Intelligence of a People. Princeton University Press. ISBN 978-0-691-04619-8. https://archive.org/details/intelligenceofpe0000calh.
- Thorndike, R.L. (1975). "Mr. Binet's Test 70 Years Later". Educational Researcher 4 (5): 3–7. doi:10.3102/0013189X004005003. ISSN 0013-189X. https://dx.doi.org/10.3102%2F0013189X004005003
- Richard Lynn, 1982 https://doi.org/10.1038/297222a0
- "The secular rise in IQs: In Estonia, the Flynn effect is not a Jensen effect". Intelligence 31 (5): 461–71. 2003. doi:10.1016/S0160-2896(03)00013-8. http://www.iapsych.com/iqmr/fe/LinkedDocuments/Must2003.pdf. Retrieved September 13, 2011.
- Rushton, J.P. (1999). "Secular Gains in IQ Not Related to the g Factor and Inbreeding Depression – Unlike Black-White Differences: A Reply to Flynn". Personality and Individual Differences 26 (2): 381–89. doi:10.1016/S0191-8869(98)00148-2. http://www.ssc.uwo.ca/psychology/faculty/rushtonpdfs/PAID-1999.pdf.
- Rushton, J.P.; Jensen, A. (2010). "The rise and fall of the Flynn effect as a reason to expect a narrowing of the Black–White IQ gap". Intelligence 38 (2): 213–19. doi:10.1016/j.intell.2009.12.002. http://cat.inist.fr/?aModele=afficheN&cpsidt=22799390. Retrieved October 19, 2010.
- Wicherts, J.M.; Dolan, C.V.; Hessen, D.J.; Oosterveld, P.; Baal, G.C.M. van; Boomsma, D.I.; Span, M.M. (2004). "Are intelligence tests measurement invariant over time? Investigating the nature of the Flynn effect". Intelligence 32 (5): 509537. doi:10.1016/j.intell.2004.07.002. http://users.fmg.uva.nl/jwicherts/wicherts2004.pdf. "The overall conclusion of the present paper is that factorial invariance with respect to cohorts is not tenable . . . . The fact that the gains cannot be explained solely by increases at the level of the latent variables (common factors), which IQ tests purport to measure, should not sit well with explanations that appeal solely to changes at the level of the latent variables.".
- "Are cognitive differences between immigrant and majority groups diminishing?". European Journal of Personality 18 (5): 405–34. 2004. doi:10.1002/per.511. https://research.vu.nl/ws/files/1957002/Nijenhuis%20European%20Journal%20of%20Personality%2018%202004%20u.pdf. Retrieved November 10, 2019.
- "Secular Gains in Fluid Intelligence: Evidence from the Culture-Fair Intelligence Test". Journal of Biosocial Science 35 (1): 33–39. 2003. doi:10.1017/S0021932003000336. PMID 12537154. https://dx.doi.org/10.1017%2FS0021932003000336
- Rindermann et al., 2017 https://doi.org/10.1016/j.paid.2016.10.061
- Plomin R.; DeFries J.C.; Craig I.W.; McGuffin P. (2003). Behavioral genetics in the postgenomic era (4th ed.).
- David F Marks (2010). "IQ variations across time, race, and nationality:an artifact of differences in literacy skills". Psychological Reports 106 (3): 643–64. doi:10.2466/pr0.106.3.643-664. PMID 20712152. https://semanticscholar.org/paper/888e97997b7e08afe236abc8d60eecc1b1fa24df.
- "Heritability estimates versus large environmental effects: The IQ paradox resolved". Psychological Review 108 (2): 346–369. 2001. doi:10.1037/0033-295X.108.2.346. PMID 11381833. https://www.psychologytoday.com/files/u81/Dickens_and_Flynn__2001_.pdf.
- "The IQ Paradox: Still Resolved". Psychological Review 109 (4): 764–71. 2002. doi:10.1037/0033-295x.109.4.764. http://www.brookings.edu/views/papers/dickens/20020205.pdf.
- 3.0.CO;2-1. PMID 11534023. https://dx.doi.org/10.1002%2F%28SICI%291520-6300%28200005%2F06%2912%3A3%3C327%3A%3AAID-AJHB3%3E3.0.CO%3B2-1" id="ref_28">Jantz, R.; Meadows Jantz, L. (2000). "Secular change in craniofacial morphology". American Journal of Human Biology 12 (3): 327–38. doi:10.1002/(SICI)1520-6300(200005/06)12:3<327::AID-AJHB3>3.0.CO;2-1. PMID 11534023. https://dx.doi.org/10.1002%2F%28SICI%291520-6300%28200005%2F06%2912%3A3%3C327%3A%3AAID-AJHB3%3E3.0.CO%3B2-1
- Lynn, Richard (January–February 2009). "What has caused the Flynn effect? Secular increases in the Development Quotients of infants". Intelligence 37 (1): 16–24. doi:10.1016/j.intell.2008.07.008. https://dx.doi.org/10.1016%2Fj.intell.2008.07.008
- "The Lancet Series on Maternal and Child Undernutrition". 2008. http://www.thelancet.com/series/maternal-and-child-undernutrition.
- C. Banning (1946). "Food Shortage and Public Health, First Half of 1945". Annals of the American Academy of Political and Social Science Vol. 245, The Netherlands during German Occupation (May 1946), pp. 93–110
- Flynn J.R. (1987). "Massive IQ gains in 14 nations: What IQ tests really measure". Psychological Bulletin 101 (2): 171–91. doi:10.1037/0033-2909.101.2.171. https://dx.doi.org/10.1037%2F0033-2909.101.2.171
- Flynn, James R. (2009). What Is Intelligence? (p. 103). Cambridge University Press. Kindle Edition.
- Samaras, Thomas T.; Elrick, Harold (May 2002). "Group Height, body size, and longevity: is smaller better for the human body?". West J Med 176 (3): 206–08. doi:10.1136/ewjm.176.3.206. PMID 12016250. http://www.pubmedcentral.nih.gov/articlerender.fcgi?tool=pmcentrez&artid=1071721
- Lynn, Richard (2006). Race Differences in Intelligence. An Evolutionary Analysis. Washington Summit Publishers, Augusta, GA.
- Sundet, J.; Barlaug, D.; Torjussen, T. (2004). "The end of the Flynn effect?: A study of secular trends in mean intelligence test scores of Norwegian conscripts during half a century". Intelligence 32 (4): 349–62. doi:10.1016/j.intell.2004.06.004. https://dx.doi.org/10.1016%2Fj.intell.2004.06.004
- 3.0.CO;2-1. PMID 11534023. Jantz RL (July 2001). "Cranial change in Americans: 1850–1975". J. Forensic Sci. 46 (4): 784–87. doi:10.1520/JFS15047J. PMID 11451056. https://dx.doi.org/10.1002%2F%28SICI%291520-6300%28200005%2F06%2912%3A3%3C327%3A%3AAID-AJHB3%3E3.0.CO%3B2-1" id="ref_37">"Secular change in craniofacial morphology". Am. J. Hum. Biol. 12 (3): 327–38. May 2000. doi:10.1002/(SICI)1520-6300(200005/06)12:3<327::AID-AJHB3>3.0.CO;2-1. PMID 11534023. Jantz RL (July 2001). "Cranial change in Americans: 1850–1975". J. Forensic Sci. 46 (4): 784–87. doi:10.1520/JFS15047J. PMID 11451056. https://dx.doi.org/10.1002%2F%28SICI%291520-6300%28200005%2F06%2912%3A3%3C327%3A%3AAID-AJHB3%3E3.0.CO%3B2-1
- Qian M; Wang D; Watkins WE et al. (2005). "The effects of iodine on intelligence in children: a meta-analysis of studies conducted in China". Asia Pacific Journal of Clinical Nutrition 14 (1): 32–42. PMID 15734706. http://www.ncbi.nlm.nih.gov/pubmed/15734706
- "How Adding Iodine To Salt Resulted In A Decade's Worth Of IQ Gains For The United States" , By Max Nisen, July 23, 2013 Business Insider http://www.businessinsider.com/iodization-effect-on-iq-2013-7#ixzz2ZuFjmyY7
- Daley, TC; Whaley, SE; Sigman, MD; Espinosa, MP; Neumann, C (May 2003). "IQ on the rise: the Flynn effect in rural Kenyan children.". Psychological Science 14 (3): 215–19. doi:10.1111/1467-9280.02434. PMID 12741743. https://dx.doi.org/10.1111%2F1467-9280.02434
- "Parasite prevalence and the worldwide distribution of cognitive ability". Proc. Biol. Sci. 277 (1701): 3801–08. December 2010. doi:10.1098/rspb.2010.0973. PMID 20591860. http://www.pubmedcentral.nih.gov/articlerender.fcgi?tool=pmcentrez&artid=2992705
- "Parasite prevalence and the distribution of intelligence among the states of the USA". Intelligence 39 (2–3): 155–60. 2011. doi:10.1016/j.intell.2011.02.008. https://dx.doi.org/10.1016%2Fj.intell.2011.02.008
- Venkataramani A (September 18, 2010). "Early Life Exposure to Malaria and Cognition and Skills in Adulthood: Evidence from Mexico". SSRN 1679164. //ssrn.com/abstract=1679164
- "The 'hidden' burden of malaria: cognitive impairment following infection". Malar. J. 9 (1): 366. 2010. doi:10.1186/1475-2875-9-366. PMID 21171998. http://www.pubmedcentral.nih.gov/articlerender.fcgi?tool=pmcentrez&artid=3018393
- Mackintosh, N.J. (2011). IQ and Human Intelligence. Oxford: Oxford University Press, p. 291.
- "A long-term rise and recent decline in intelligence test performance: The Flynn Effect in reverse". Personality and Individual Differences 39 (4): 837–43. 2005. doi:10.1016/j.paid.2005.01.029. https://dx.doi.org/10.1016%2Fj.paid.2005.01.029
- "Secular declines in cognitive test scores: A reversal of the Flynn Effect". Intelligence 36 (2): 121–26. 2008. doi:10.1016/j.intell.2007.01.007. http://www.iapsych.com/iqmr/fe/LinkedDocuments/teasdale2008.pdf. Retrieved April 18, 2010.
- Cotton, S.M.; Kiely, P.M.; Crewther, D.P.; Thomson, B.; Laycock, R.; Crewther, S.G. (2005). "A normative and reliability study for the Raven's Colored Progressive Matrices for primary school aged children in Australia". Personality and Individual Differences 39 (3): 647–60. doi:10.1016/j.paid.2005.02.015. https://dx.doi.org/10.1016%2Fj.paid.2005.02.015
- Gray, Richard (February 7, 2009). "British teenagers have lower IQs than their counterparts did 30 years ago". The Telegraph (London). https://www.telegraph.co.uk/education/educationnews/4548943/British-teenagers-have-lower-IQs-than-their-counterparts-did-30-years-ago.html.
- Flynn, J.R. (2009). "Requiem for nutrition as the cause of IQ gains: Raven's gains in Britain 1938–2008". Economics & Human Biology 7 (1): 18–27. doi:10.1016/j.ehb.2009.01.009. PMID 19251490. https://dx.doi.org/10.1016%2Fj.ehb.2009.01.009
- Kong, Augustine; Frigge, Michael L.; Thorleifsson, Gudmar; Stefansson, Hreinn; Young, Alexander I.; Zink, Florian; Jonsdottir, Gudrun A.; Okbay, Aysu et al. (2017-01-31). "Selection against variants in the genome associated with educational attainment" (in en). Proceedings of the National Academy of Sciences 114 (5): E727–E732. doi:10.1073/pnas.1612113114. ISSN 0027-8424. PMID 28096410. http://www.pubmedcentral.nih.gov/articlerender.fcgi?tool=pmcentrez&artid=5293043
- Bratsberg, Bernt; Rogeberg, Ole (June 6, 2018). "Flynn effect and its reversal are both environmentally caused" (in en). Proceedings of the National Academy of Sciences 115 (26): 6674–78. doi:10.1073/pnas.1718793115. ISSN 0027-8424. PMID 29891660. http://www.pubmedcentral.nih.gov/articlerender.fcgi?tool=pmcentrez&artid=6042097
- Carrington, Damian (17 May 2019). "Revealed: air pollution may be damaging 'every organ in the body'" (in en). http://www.theguardian.com/environment/ng-interactive/2019/may/17/air-pollution-may-be-damaging-every-organ-and-cell-in-the-body-finds-global-review.
- Wuebbles, Donald J.; Vanker, Anessa; To, Teresa; Thurston, George D.; Sood, Akshay; Riojas-Rodriguez, Horacio; Rice, Mary B.; Perez-Padilla, Rogelio et al. (February 2019). "Air Pollution and Noncommunicable Diseases: A Review by the Forum of International Respiratory Societies' Environmental Committee, Part 2: Air Pollution and Organ Systems" (in en). Chest 155 (2): 417–426. doi:10.1016/j.chest.2018.10.041. ISSN 0012-3692. PMID 30419237. http://www.pubmedcentral.nih.gov/articlerender.fcgi?tool=pmcentrez&artid=6904854
- 3.0.co;2-s. PMID 2030133. https://dx.doi.org/10.1002%2F1097-4679%28199103%2947%3A2%3C266%3A%3Aaid-jclp2270470213%3E3.0.co%3B2-s" id="ref_55">Vincent, Ken R. (March 1991). "Black/white IQ differences: Does age make the difference?". Journal of Clinical Psychology 47 (2): 266–270. doi:10.1002/1097-4679(199103)47:2<266::aid-jclp2270470213>3.0.co;2-s. PMID 2030133. https://dx.doi.org/10.1002%2F1097-4679%28199103%2947%3A2%3C266%3A%3Aaid-jclp2270470213%3E3.0.co%3B2-s
- Dickens & Flynn 2006.
- Neisser, Ulric (Ed). 1998. The rising curve: Long-term gains in IQ and related measures. Washington, DC, US: American Psychological Association
- Dickens, William T; Flynn, James R (2006). "Black Americans Reduce the Racial IQ Gap: Evidence from Standardization Samples". Psychological Science 17 (10): 913–20. doi:10.1111/j.1467-9280.2006.01802.x. PMID 17100793. http://www.brookings.edu/views/papers/dickens/20060619_iq.pdf.
- Mackintosh, N. J. (2011). IQ and Human Intelligence (second ed.). Oxford: Oxford University Press. ISBN 978-0-19-958559-5.
- Nisbett, Richard E.; Aronson, Joshua; Blair, Clancy; Dickens, William; Flynn, James; Halpern, Diane F.; Turkheimer, Eric (2012a). "Intelligence: new findings and theoretical developments". American Psychologist 67 (2): 130–159. doi:10.1037/a0026699. ISSN 0003-066X. PMID 22233090. http://people.virginia.edu/~ent3c/papers2/nisbett2012int.pdf. Retrieved 22 July 2013.
- Willingham, Dan (10 May 2012). "The latest on intelligence". http://www.danielwillingham.com/1/post/2012/05/the-latest-on-intelligence.html.
- Flynn, J.R. (2010). "The spectacles through which I see the race and IQ debate". Intelligence 38 (4): 363–66. doi:10.1016/j.intell.2010.05.001. https://dx.doi.org/10.1016%2Fj.intell.2010.05.001
- Nijenhuis, J.; van der Flierb, H. (2013). "Is the Flynn effect on g?: A meta-analysis". Intelligence 41 (6): 802–07. doi:10.1016/j.intell.2013.03.001. https://dx.doi.org/10.1016%2Fj.intell.2013.03.001
- Flynn, J.R. (1999). "Searching for justice: the discovery of IQ gains over time". American Psychologist 54: 5–9. doi:10.1037/0003-066X.54.1.5. http://www.stat.columbia.edu/~gelman/stuff_for_blog/flynn.pdf. Retrieved October 26, 2017.


