Your browser does not fully support modern features. Please upgrade for a smoother experience.
Submitted Successfully!
 +1 credit
Thank you for your contribution! You can also upload a video entry or images related to this topic.
For video creation, please contact our Academic Video Service.
| Version | Summary | Created by | Modification | Content Size | Created at | Operation |
|---|---|---|---|---|---|---|
| 1 | Giuseppe Ciaburro | -- | 2643 | 2022-11-02 10:13:38 | | | |
| 2 | Amina Yu | + 2 word(s) | 2645 | 2022-11-03 02:31:06 | | |
Video Upload Options
We provide professional Academic Video Service to translate complex research into visually appealing presentations. Would you like to try it?
Cite
If you have any further questions, please contact Encyclopedia Editorial Office.
Ciaburro, G.; Iannace, G. Machine-Learning-Based Methods for Acoustic Emission Testing. Encyclopedia. Available online: https://encyclopedia.pub/entry/32514 (accessed on 27 July 2026).
Ciaburro G, Iannace G. Machine-Learning-Based Methods for Acoustic Emission Testing. Encyclopedia. Available at: https://encyclopedia.pub/entry/32514. Accessed July 27, 2026.
Ciaburro, Giuseppe, Gino Iannace. "Machine-Learning-Based Methods for Acoustic Emission Testing" Encyclopedia, https://encyclopedia.pub/entry/32514 (accessed July 27, 2026).
Ciaburro, G., & Iannace, G. (2022, November 02). Machine-Learning-Based Methods for Acoustic Emission Testing. In Encyclopedia. https://encyclopedia.pub/entry/32514
Ciaburro, Giuseppe and Gino Iannace. "Machine-Learning-Based Methods for Acoustic Emission Testing." Encyclopedia. Web. 02 November, 2022.
Copy Citation
Acoustic emission (AE) testing has obvious limitations regarding its reproducibility: as it was said, this type of test involves the formation or progression of cracks in the material. Even when referring to specimens of the same material, of the same dimensions, and subjected to the same load cycle, they do not necessarily produce the same results. This is especially true in the case of anisotropic and heterogeneous materials. Moreover, since the signals used by precursors are of modest entity, to be able to detect possible forms of energy in the material, it is necessary to use particularly sensitive sensors. Further problems arise due to the attenuation phenomena of the acoustic stress wave that is dispersed in the material as it propagates: just as the noise due to sources independent of the possible structural defect can disturb the detection methodology. To overcome these limitations, researchers adopted alternative methodologies to improve the results of the structural damage identification procedures. The capabilities demonstrated by the technologies based on ML in detecting patterns were immediately noticed by AE researchers. To make this nondestructive testing method even more effective, all the methodologies based on ML for the recognition of the stress wave can be applied during the detection phase of the acoustic emission generated by the source. In this way, it is possible to carry out a test that is robust regarding noise and effective in detecting waves of modest entity. The most common methodologies based on ML applied in the field of AE are presented below. ML is a branch of artificial intelligence whose goal is to allow machines to automatically learn something from experience, without the need for them to be programmed in advance. Experience is a collection of data, which can be fixed and immutable, or even expand over time. Learning can be carried out through two main approaches: supervised and unsupervised.
acoustic emission testing
damage detection
machine learning
1. Clustering Techniques
Clustering techniques are based on unsupervised algorithms that work on data but without knowing the class they belong to. All clustering techniques are based on distance measurements between all the elements that are part of the dataset to be analyzed [1]. The elements that are more like each other will end up in the same cluster, that is, in the same group, whereas the less similar elements will end up in different clusters. Clustering techniques can be mainly used for two different purposes. The first is understanding: by observing the clusters that are formed from a dataset, it is possible to trace any relationships and patterns between the data themselves. The other purpose for which clustering can be used is the reduction of a dataset with too many elements to a smaller one [2]. This may be necessary, for example, to train faster a classification algorithm that had too large training set. By applying a clustering algorithm, it will be possible, in fact, to find which are its main clusters, such as those subsets of data that are like each other, taking only some of them, which are the most representative for each cluster [3].
Clustering algorithms can be grouped into two large families:
-
Aggregative or bottom-up methods: Initially, all the elements of the dataset are identified as separate clusters. The elements closest to each other are then merged into a single cluster, thus aggregating smaller clusters into larger clusters. All this is carried out until a predetermined condition is reached, which could be the number of clusters, a minimum distance between clusters or other, depending on the algorithm used.
-
Divisive or top-down methods: It starts from a single large cluster that contains all the elements. Subsequently, the cluster is divided into smaller and smaller clusters. Proceed until a stop condition is reached, which is usually the desired number of clusters.
There are also other subdivisions of clustering algorithms. One of these sees the contrast between exclusive and nonexclusive clustering. In exclusive clustering, an element can belong to one and only one cluster. In nonexclusive clustering, also known as fuzzy clustering, an element can belong to several clusters at the same time, to each according to a probability p. Obviously, the sum of the probabilities of belonging of an element to the various clusters must be equal to one [4].
Fuzzy c-means clustering iteratively searches for a set of fuzzy clusters and associated cluster centers that characterize the data structure in the best possible way [5]. The user specifies the number of clusters to locate in the dataset to be grouped. Omkar et al. [6] applied fuzzy c-means (FCM) techniques to classify the acoustic emission (AE) signal into different signal sources. The authors performed the test using a pulse, pencil, and spark signal source on the surface of the solid block of steel. Using the AET 5000 system, they measured four parameters: event duration, peak width, rise time, and loop back count. Marec et al. [7] investigated local damage in composite materials based on the analysis of acoustic emission (AE) signals. The authors applied fuzzy C-means clustering techniques associated with principal component analysis to analyze AE data clusters and subsequently correlate them to material damage mechanisms. Continuous and discrete wavelet transforms are applied to typical AE signal damage mechanisms.
Oskouei et al. [8] adopted fuzzy C-means clustering associated with a principal component analysis to detect damage in glass–polyester composites with the AE technique. Behnia et al. [9] evaluated the damage of concrete structures subjected to pure torsional load by proposing a method based on AE and kernel fuzzy c-means. Time and frequency domain signals were used to classify the damage. Mohammadi et al. [10] studied the damage mechanisms in standard open-hole tensile (OHT) laminated composites through the AE. The authors used wavelet transforms as a descriptor and fuzzy C-means technology to distinguish sample damage mechanisms. Three damages were detected: matrix break, fiber–matrix detachment, and fiber break. Saeedifar et al. [11] detected interlaminar and intralaminar damage induced by dentation in laminated carbon–epoxy composites with AE and six different clustering methods including fuzzy C-means. Zhu et al. [12] estimated the leakage rate of a valve in a pipeline using various clustering techniques including fuzzy C-means using AE signals. Shateri et al. [13] detected damage in fiber-reinforced polymer (FRP) bars by applying a fuzzy c-means clustering algorithm to AE signals. Fotouhi et al. [14] identified the damage in the mixed-mode delamination of laminated composites using fuzzy clustering and the acoustic emission technique. Sayar et al. [15] investigated damage mechanisms in an open-hole carbon–epoxy laminate composite using wavelet packet transform and fuzzy C-means methods. Zhao et al. [16] detected failure of carbon–glass epoxy hybrid braided composites under tensile load based on acoustic emission signals and a fuzzy c-means algorithm. Mi et al. [17] have adopted fuzzy c-means to detect damage in fiber–resin composite structures that are closely related to fiber weaving methods (FWMs). Pei et al. [18] identified the progressive tensile damage of carbon fiber composites reinforced with multiwalled carbon nanotubes using AE and fuzzy c-means algorithms. Pomponi et al. [19] adopted an unsupervised approach for detecting plastic deformation, crack initiation, and corrosion cracking. The authors proposed a simple but effective non-iterative clustering algorithm (adaptive sequential k-means), oriented to acoustic emissions (AEs). The number of clusters is not specified a priori but deduced from the data, whereas the properties of the background noise control the creation of new clusters. The approach adopted has proved effective in grouping the AE signals associated with different emission sources (performance indexes = 0.776, 0.751). In Table 1, the essential characteristics of the methodology based on clustering are summarized.
Table 1. Clustering methods for AE testing.
| Reference | Input | Type | Accuracy (%) |
|---|---|---|---|
| Omkar et al. [6] | AE from pulse, pencil, and spark | Fuzzy c-means | 80–93 |
| Marec et al. [7] | AE from glass-fiber-reinforced polymer | Fuzzy c-means | 90–94 |
| Oskouei et al. [8] | AE from glass–polyester composites | Fuzzy c-means | 90 |
| Behnia et al. [9] | AE from concrete structures | Kernel fuzzy c-means | - |
| Mohammadi et al. [10] | AE from open-hole tensile laminated composites | Fuzzy c-means | 85–89 |
| Saeedifar et al. [11] | AE from laminated composites | k-Means, genetic k-Means, fuzzy c-means, Self-organizing map (SOM), Gaussian mixture model (GMM) | - |
| Zhu et al. [12] | AE from natural gas pipeline | Fuzzy c-means, k-means and, k-medoids | 95.8–96.3 |
| Shateri et al. [13] | AE from fiber-reinforced polymer rods | Fuzzy c-means | - |
| Sayar et al. [14] | AE from open-hole laminated carbon–epoxy composite | Fuzzy c-means | 92–94 |
| Zhao et al. [16] | AE from carbon–glass-fiber-reinforced hybrid composites | Fuzzy c-means | - |
| Mi et al. [17] | AE from fiber–resin composite materials | Fuzzy c-means | 89–91 |
| Pei et al. [18] | AE from multiwalled carbon nanotube reinforced carbon fiber composites | Fuzzy c-means | - |
| Pomponi et al. [19] | AE from different emitting sources | k-Means | 91–93 |
2. Artificial Neural Network (ANN) Techniques
ANNs are composed of artificial neurons that are organized in an interconnected structure that allows the connection of the inputs and outputs of various neurons [20]. This type of structure allows neurons to receive both initial and processed data from other neurons, depending on the level of the neuron. The ANN architecture arranges neurons on different levels, with several levels and a number of neurons for each level characterizing their structure [21].
ANNs are composed of levels containing a certain number of nodes: each node connects to another in which a weight and a threshold are associated with it. If the output of any single node is above the specified threshold, that node is activated and sends the data to the next network layer. Otherwise, no data are passed to the next network layer. From a mathematical point of view underlying ANNs, a function ƒ could be expressed as a composition of other g functions, which, in turn, can be expressed in simpler functions. An ANN is an interconnected set of elementary functions in which the outputs are the inputs of the subsequent functions. In general, ANNs rely on training data to learn how to improve their accuracy. Once optimized, these learning algorithms are powerful tools in computer science and artificial intelligence. At the base of the ANN, there is the perceptron, in complete analogy with the neuron in a biological neural network. In Figure 1, each dot is a node representing a perceptron. These are functions that take n input elements and return only a single output, which is sent as input for subsequent perceptrons [22].
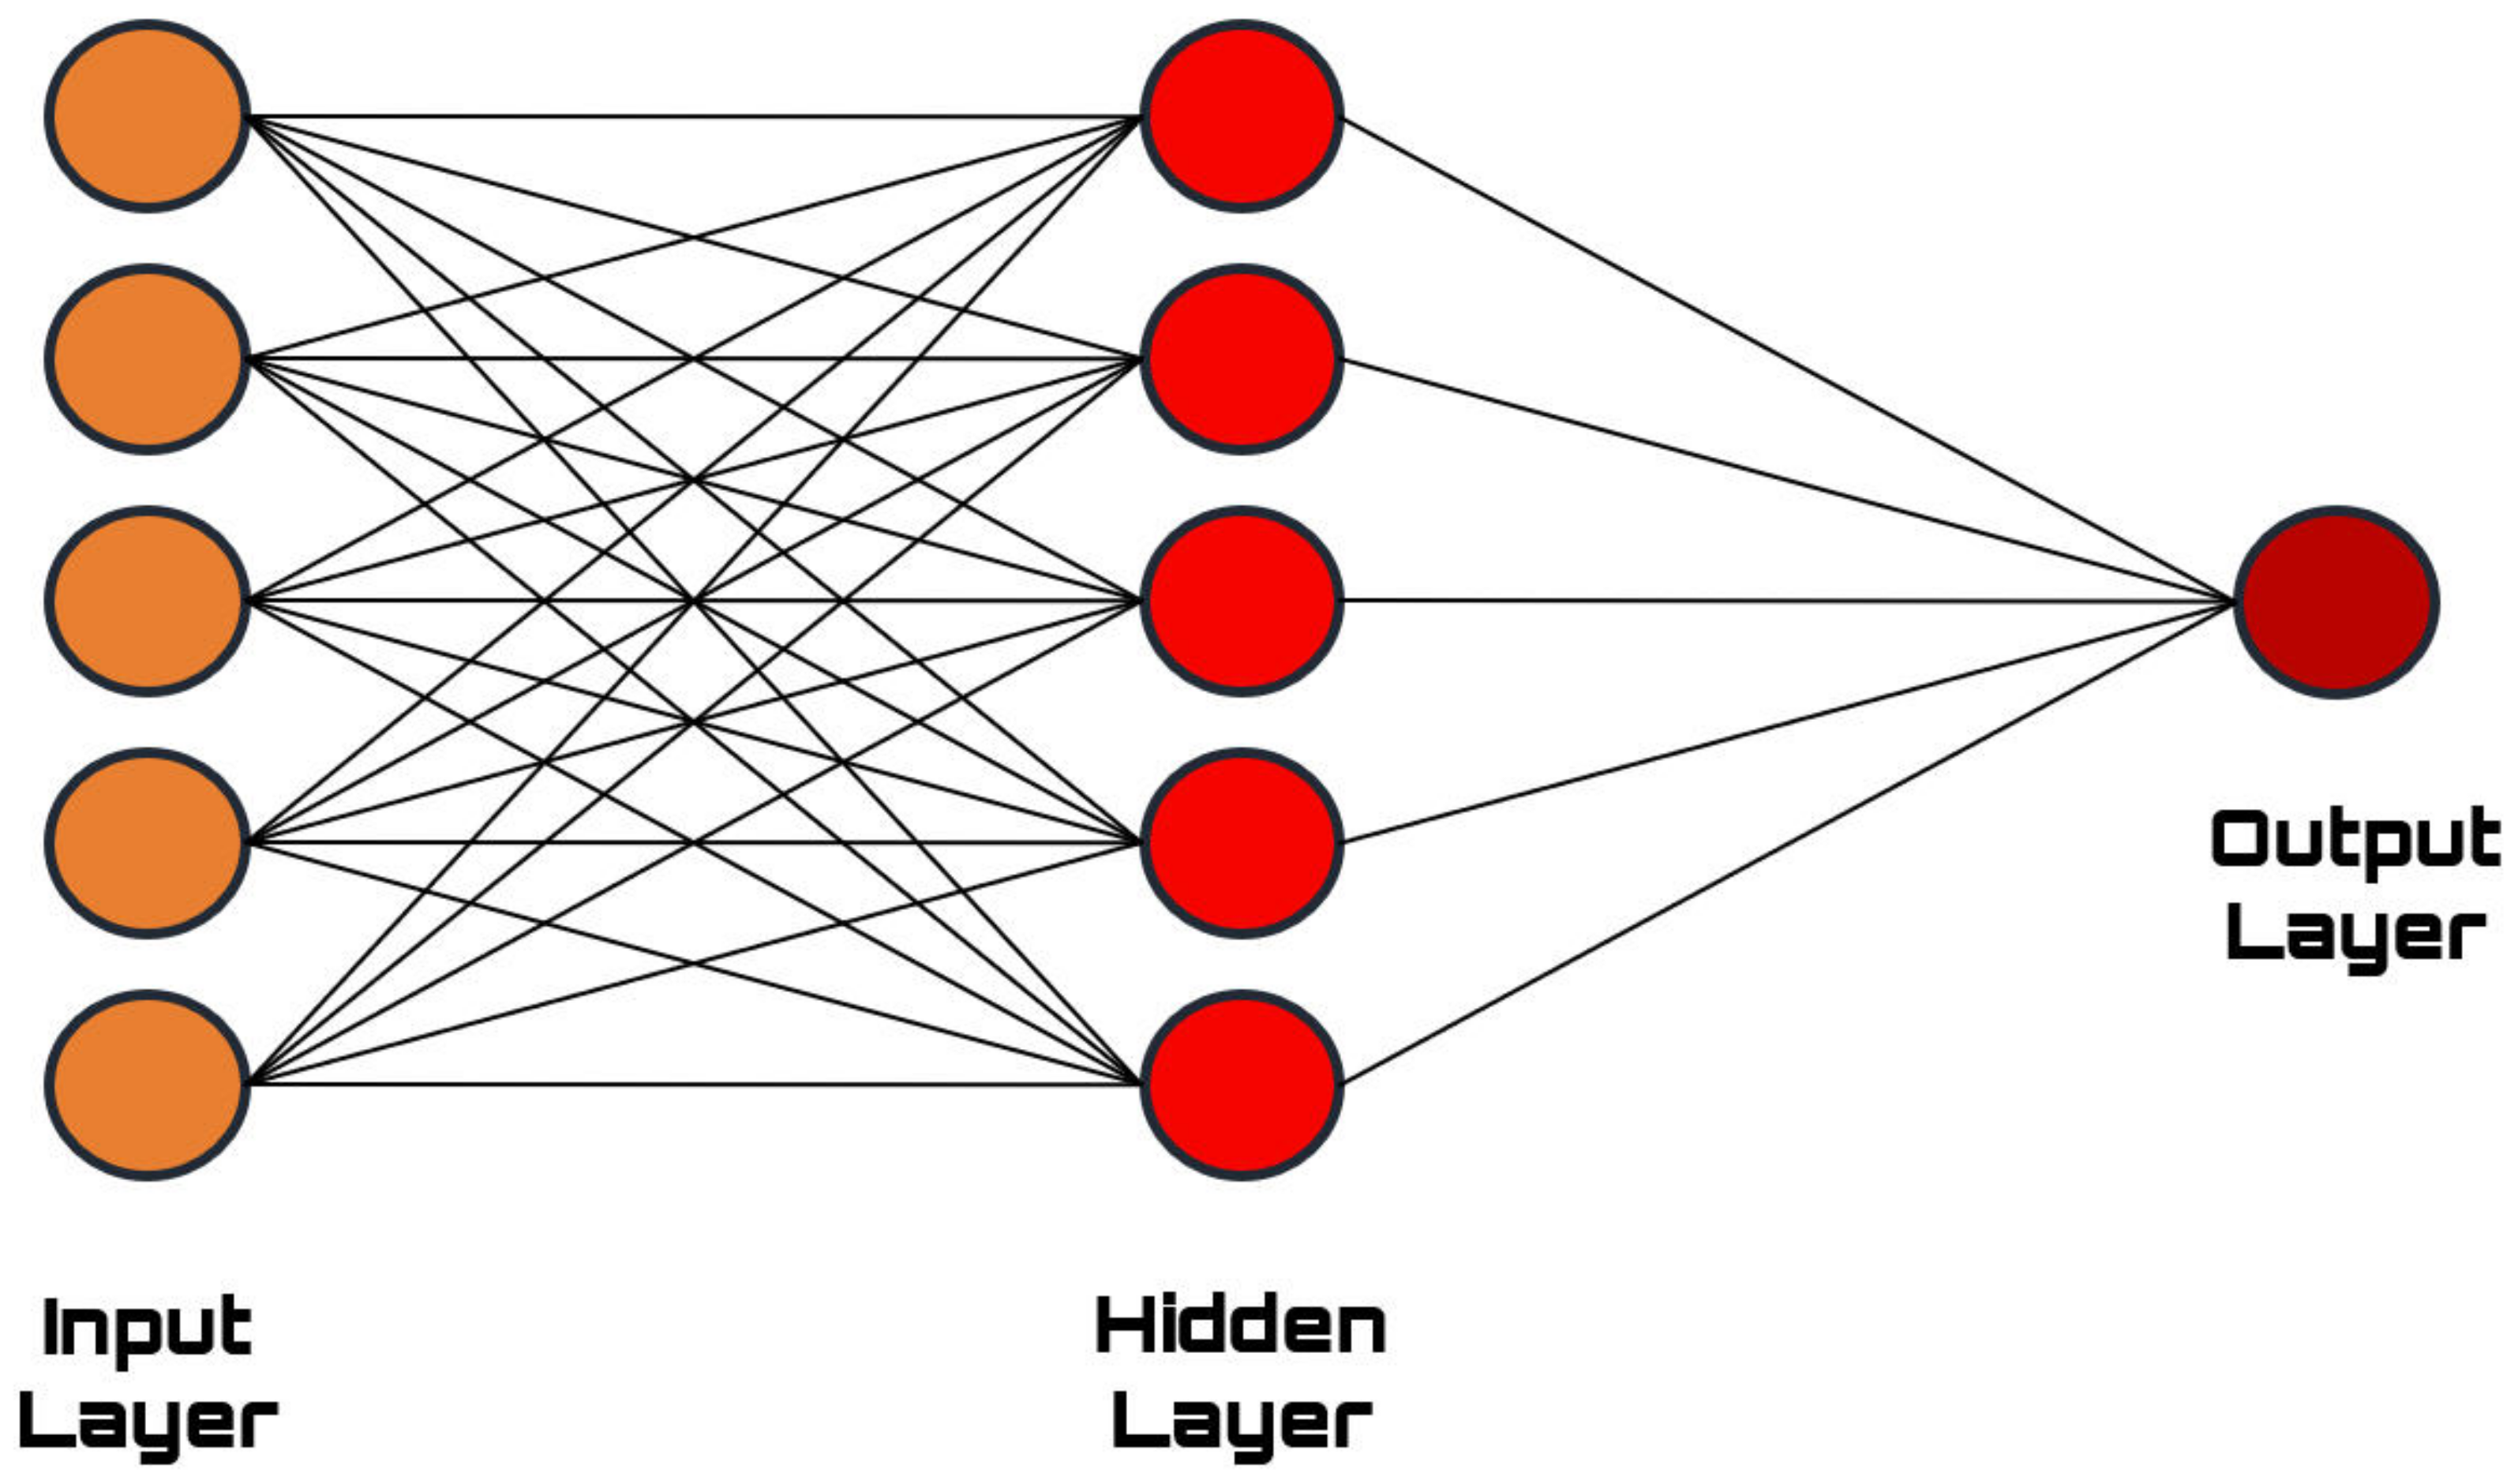
Figure 1. Typical ANN architecture: an input layer that presents the data to the structure could be identified, a hidden layer that takes care of processing data, and, finally, an output layer that returns the results.
An ANN is an adaptive system capable of modifying its structure based on both external data and internal information that connects and passes through the ANN during the learning phase. A biological ANN receives external data and signals; these are processed into information through an impressive number of interconnected neurons in a nonlinear and variable structure in response to those data and external stimuli themselves. Similarly, ANNs are nonlinear structures of statistical data organized as modeling tools: they receive external signals on a layer of nodes. Each of these input nodes is connected to various internal nodes of the network, which, typically, are organized at multiple levels so that each single node can process the received signals by transmitting the result of its processing to subsequent levels [23].
Generally, ANNs consist of three layers (Figure 1):
-
Input layer: It is the one that has the task of receiving and processing the input signals, adapting them to the demands of the neurons in the network.
-
Hidden layer: In this layer, the data processing takes place.
-
Output layer: The results of the processing of the H layer are collected here and adapted to the requests of the next level block of the neural network.
ANNs have been widely used to classify the acoustic emission (AE) signal. De Oliveira et al. [24] have developed a procedure for the identification of damage for composite materials based on the grouping of acoustic emission signals using artificial neural networks. The authors adopted an unsupervised methodology based on the Kohonen self-organization map. The methodology was tested on a cross-layered fiberglass–polyester laminate subjected to a tensile test. Kalafat et al. [25] have developed an acoustic emission localization system based on the use of ANNs. The acoustic sources were applied to the test object to obtain data to be sent as input to an ANN. The method was tested on a type III carbon-fiber-reinforced polymer pressure vessel with metal coating. Boczar et al. [26] investigated the recognition of single-source one-off partial discharge forms that occur in isolation systems of power transformers. The system developed by the authors uses unidirectional artificial neural networks for the recognition of the acoustic emissions generated by the paper-oil isolation altered by the aging processes. Ativitavas et al. [27] identified the type of discontinuity and failure mechanisms within fiber-reinforced plastic (FRP) structures using acoustic emission (AE) data as input to be sent to an ANN-based system. The authors developed two types of networks based on back-propagation and probabilistic method with two levels to improve the accuracy of the forecast. Moia et al. [28] monitored the dressing operation of an aluminum oxide wheel: the dressing operation is necessary to restore the normal operation of a worn wheel. The statistics obtained from the measured acoustic emission (AE) signal were used as input from a classification algorithm based on neural networks. Two classes have been identified: sharp and dull wheel. Jierula et al. [29] used ANNs to identify damage locations in deep piles using AEs. The authors performed an impact test on a circular-section concrete column of a building. Łazarska et al. [30] monitored the steel hardening process using AEs and neural networks. Three types of events were detected in this study: high, medium, and low energy. These events allow the monitoring of the decay process of metastable austenite into bainite and martensite. The method made it possible to identify the alterations that occur on a microscopic scale. Schabowicz et al. [31] studied the degree of degradation of fiber cement panels exposed to fire with the AE method and with the use of ANNs. The fiber cement panels were exposed to fire and subsequently subjected to a three-point curvature with the relief of the acoustic emission: The collected signals were used as input for the ANNs. The degradation of the fibers contained in the boards increases with increasing exposure to fire, with a decrease in the number of AE events recognized by the ANNs as identifiers of fiber breakage. Nasir et al. [32] used AEs of thermally modified western hemlock wood as an input to an ANN-based model for the classification of the heat treatment level.
The authors used a high-sensitivity broadband differential AE sensor to detect the stress wave generated in the wood: this signal was subsequently processed to extract the time, frequency, and wavelet domain features. These signals were sent as input to three types of networks: multilayer perceptron, group method of data handling, and linear vector quantization. Elforjani et al. [33] identified deviations from normal bearing operating conditions by detecting AE signals and using ANNs. The AE measurements were performed with piezoelectric sensors mounted on bearings placed on a test bench at a speed of 72 rpm with an axial load of 50 kN. Three models have been implemented: ANN, support vector machine, and Gaussian process regression. In Table 2, the crucial aspect of the methodology based on ANNs is summarized.
Table 2. ANN-based methods for AET.
| Reference | Input | ANN Architecture | Results |
|---|---|---|---|
| De Oliveira et al. [24] | AE from fiberglass–polyester laminate | Kohonen Map | - |
| Kalafat et al. [25] | AE from reinforced polymer | Back-propagation—hyperbolic tangent activation function | 96% |
| Boczar et al. [26] | AE from partial discharges | Back-propagation with resilient—sigmoid activation function | 51.1–98.6% |
| Ativitavas et al. [27] | AE from fiber-reinforced plastic | Back-propagation—probabilistic neural network | 51.5–83.8% |
| Moia et al. [28] | AE from aluminum oxide grinding wheel in dressing operation | Back-propagation | 100% |
| Jierula et al. [29] | AE from deep piles | Back-propagation | 93–95% |
| Łazarska et al. [30] | AE from austempering of steels | Back-propagation | - |
| Schabowicz et al. [31] | AE from fiber–cement boards exposed to fire | Back-propagation | - |
| Nasir et al. [32] | AE from thermally modified wood | Feedforward multilayer perceptron, group method of data handling, linear vector quantization | 89.1–91.1% |
| Elforjani et al. [33] | AE from bearing | ANN, support vector machine, Gaussian process regression | - |
References
- Saxena, A.; Prasad, M.; Gupta, A.; Bharill, N.; Patel, O.P.; Tiwari, A.; Er, M.J.; Ding, W.; Lin, C.-T. A review of clustering techniques and developments. Neurocomputing 2017, 267, 664–681.
- Ghosal, A.; Nandy, A.; Das, A.K.; Goswami, S.; Panday, M. A Short Review on Different Clustering Techniques and Their Applications. In Emerging Technology in Modelling and Graphics; Springer: Singapore, 2020; pp. 69–83.
- Cooper, C.; Franklin, D.; Ros, M.; Safaei, F.; Abolhasan, M. A Comparative Survey of VANET Clustering Techniques. IEEE Commun. Surv. Tutor. 2016, 19, 657–681.
- Kaur, P.J. A survey of clustering techniques and algorithms. In Proceedings of the 2015 2nd IEEE International Conference on Computing for Sustainable Global Development (INDIACom), New Delhi, India, 11–13 March 2015; pp. 304–307.
- Ghosh, S.; Dubey, S.K. Comparative analysis of k-means and fuzzy c-means algorithms. Int. J. Adv. Comput. Sci. Appl. 2013, 4, 35–39.
- Omkar, S.N.; Suresh, S.; Raghavendra, T.R.; Mani, V. Acoustic emission signal classification using fuzzy C-means clustering. In Proceedings of the 9th International Conference on Neural Information Processing, ICONIP’02, Singapore, 18–22 November 2002; IEEE: Piscataway, NJ, USA, 2003; Volume 4, pp. 1827–1831.
- Marec, A.; Thomas, J.H.; El Guerjouma, R. Damage characterization of polymer-based composite materials: Multivariable analysis and wavelet transform for clustering acoustic emission data. Mech. Syst. Signal Process. 2008, 22, 1441–1464.
- Oskouei, A.R.; Heidary, H.; Ahmadi, M.; Farajpur, M. Unsupervised acoustic emission data clustering for the analysis of damage mechanisms in glass/polyester composites. Mater. Des. 2012, 37, 416–422.
- Behnia, A.; Chai, H.K.; GhasemiGol, M.; Sepehrinezhad, A.; Mousa, A.A. Advanced damage detection technique by integration of unsupervised clustering into acoustic emission. Eng. Fract. Mech. 2018, 210, 212–227.
- Mohammadi, R.; Najafabadi, M.A.; Saeedifar, M.; Yousefi, J.; Minak, G. Correlation of acoustic emission with finite element predicted damages in open-hole tensile laminated composites. Compos. Part B Eng. 2016, 108, 427–435.
- Saeedifar, M.; Najafabadi, M.A.; Zarouchas, D.; Toudeshky, H.H.; Jalalvand, M. Clustering of interlaminar and in-tralaminar damages in laminated composites under indentation loading using Acoustic Emission. Compos. Part B Eng. 2018, 144, 206–219.
- Zhu, S.-B.; Li, Z.-L.; Zhang, S.-M.; Liang, L.-L.; Zhang, H.-F. Natural gas pipeline valve leakage rate estimation via factor and cluster analysis of acoustic emissions. Measurement 2018, 125, 48–55.
- Shateri, M.; Ghaib, M.; Svecova, D.; Thomson, D. On acoustic emission for damage detection and failure prediction in fiber reinforced polymer rods using pattern recognition analysis. Smart Mater. Struct. 2017, 26, 065023.
- Fotouhi, M.; Sadeghi, S.; Jalalvand, M.; Ahmadi, M. Analysis of the damage mechanisms in mixed-mode delamination of laminated composites using acoustic emission data clustering. J. Thermoplast. Compos. Mater. 2016, 30, 318–340.
- Sayar, H.; Azadi, M.; Ghasemi-Ghalebahman, A.; Jafari, S.M. Clustering effect on damage mechanisms in open-hole laminated carbon/epoxy composite under constant tensile loading rate, using acoustic emission. Compos. Struct. 2018, 204, 1–11.
- Zhao, W.-Z.; Zhou, W. Cluster analysis of acoustic emission signals and tensile properties of carbon/glass fiber–reinforced hybrid composites. Struct. Health Monit. 2018, 18, 1686–1697.
- Mi, Y.; Zhu, C.; Li, X.; Wu, D. Acoustic emission study of effect of fiber weaving on properties of fiber-resin composite materials. Compos. Struct. 2020, 237, 111906.
- Pei, N.; Shang, J.; Bond, L.J. Analysis of Progressive Tensile Damage of Multi-walled Carbon Nanotube Reinforced Carbon Fiber Composites by Using Acoustic Emission and Micro-CT. J. Nondestruct. Eval. 2021, 40, 51.
- Pomponi, E.; Vinogradov, A. A real-time approach to acoustic emission clustering. Mech. Syst. Signal Process. 2013, 40, 791–804.
- Jain, A.; Mao, J.; Mohiuddin, K. Artificial neural networks: A tutorial. Computer 1996, 29, 31–44.
- Hopfield, J.J. Artificial neural networks. IEEE Circuits Devices Mag. 1988, 4, 3–10.
- Hassoun, M.H.; Intrator, N.; McKay, S.; Christian, W. Fundamentals of Artificial Neural Networks. Comput. Phys. 1996, 10, 137.
- Ciaburro, G.; Iannace, G.; Puyana-Romero, V.; Trematerra, A. A Comparison between Numerical Simulation Models for the Prediction of Acoustic Behavior of Giant Reeds Shredded. Appl. Sci. 2020, 10, 6881.
- De Oliveira, R.; Marques, A. Health monitoring of FRP using acoustic emission and artificial neural networks. Comput. Struct. 2008, 86, 367–373.
- Kalafat, S.; Sause, M.G. Acoustic emission source localization by artificial neural networks. Struct. Health Monit. 2015, 14, 633–647.
- Boczar, T.; Borucki, S.; Cichon, A.; Zmarzly, D. Application possibilities of artificial neural networks for recognizing partial discharges measured by the acoustic emission method. IEEE Trans. Dielectr. Electr. Insul. 2009, 16, 214–223.
- Ativitavas, N.; Pothisiri, T.; Fowler, T.J. Identification of Fiber-reinforced Plastic Failure Mechanisms from Acoustic Emission Data using Neural Networks. J. Compos. Mater. 2005, 40, 193–226.
- Moia, D.F.G.; Thomazella, I.H.; Aguiar, P.R.; Bianchi, E.C.; Martins, C.H.R.; Marchi, M. Tool condition monitoring of aluminum oxide grinding wheel in dressing operation using acoustic emission and neural networks. J. Braz. Soc. Mech. Sci. Eng. 2014, 37, 627–640.
- Jierula, A.; Wang, S.; Oh, T.-M.; Wang, P. Study on Accuracy Metrics for Evaluating the Predictions of Damage Locations in Deep Piles Using Artificial Neural Networks with Acoustic Emission Data. Appl. Sci. 2021, 11, 2314.
- Łazarska, M.; Wozniak, T.Z.; Ranachowski, Z.; Trafarski, A.; Domek, G. Analysis of acoustic emission signals at austempering of steels using neural networks. Met. Mater. Int. 2017, 23, 426–433.
- Schabowicz, K.; Gorzelańczyk, T.; Szymków, M. Identification of the degree of degradation of fibre-cement boards exposed to fire by means of the acoustic emission method and artificial neural networks. Materials 2019, 12, 656.
- Nasir, V.; Nourian, S.; Avramidis, S.; Cool, J. Stress wave evaluation by accelerometer and acoustic emission sensor for thermally modified wood classification using three types of neural networks. Eur. J. Wood Wood Prod. 2019, 77, 45–55.
- Elforjani, M.; Shanbr, S. Prognosis of Bearing Acoustic Emission Signals Using Supervised Machine Learning. IEEE Trans. Ind. Electron. 2018, 65, 5864–5871.
More
Information
Subjects:
Acoustics
Contributors
MDPI registered users' name will be linked to their SciProfiles pages. To register with us, please refer to https://encyclopedia.pub/register
:
View Times:
1.3K
Revisions:
2 times
(View History)
Update Date:
03 Nov 2022
Table of Contents


Notice
You are not a member of the advisory board for this topic. If you want to update advisory board member profile, please contact office@encyclopedia.pub.
OK
Confirm
Only members of the Encyclopedia advisory board for this topic are allowed to note entries. Would you like to become an advisory board member of the Encyclopedia?
Yes
No
${ textCharacter }/${ maxCharacter }
Submit
Cancel
Back
Comments
${ item }
|
${ item.createdUser.fullName }
${ item.createdAt }
${ item.vote }
${ item.reply }
Delete
${ reply.createdUser.fullName }
${ reply.createdAt }
${ reply.vote }
Delete
There is no reply to this comment~
${ item.replyTextCharacter }/${ item.replyMaxCharacter }
Submit
Cancel
More
No more~
There is no comment~
${ textCharacter }/${ maxCharacter }
Submit
Cancel
${ selectedItem.replyTextCharacter }/${ selectedItem.replyMaxCharacter }
Submit
Cancel
Confirm
Are you sure to Delete?
Yes
No