 +1 credit
| Version | Summary | Created by | Modification | Content Size | Created at | Operation |
|---|---|---|---|---|---|---|
| 1 | Sirius Huang | -- | 1324 | 2022-10-27 01:30:50 |
Video Upload Options
The cubic mile of oil (CMO) is a unit of energy, aiming to give the general public an understanding of large quantities of energy. It is approximately equal to 1.6×10²⁰ joule. It was created by Hew Crane of SRI International to aid in public understanding of global-scale energy consumption and resources. Large scale sources of energy include wind, solar photovoltaic, solar thermal, nuclear, hydroelectric, oil, coal, natural gas, geothermal, and biomass (primarily the burning of wood). Traditionally, many different units are commonly used to measure these sources (e.g., joules, BTUs, kilowatt hours, therms) but only some of them are familiar to a global general public, and some argue that fewer are needed and a standard should be chosen. Still, these common energy units are mainly sized for everyday activities, for example a joule is the energy required to lift a small apple one metre vertically. For regional, national, and global scales, larger energy units, such as exajoule, terawatt-hour, billion barrels of oil equivalent (BBOE) and quad are used. Derived by multiplying the small common units by large powers of ten these larger units pose additional conceptual difficulties for many citizens. Crane intended the cubic mile of oil to provide a visualizable scale for comparing the contributions of these diverse energy components as a percentage of total worldwide, energy use. In 2005, the global economy was consuming approximately 30 billion barrels (4.8 billion cubic metres; 1.3 trillion US gallons) of oil each year. Numbers of this magnitude are difficult to conceive by most people. The volume occupied by 1 trillion US gallons (3.8 billion cubic metres) is about 1 cubic mile (4.2 billion cubic metres). Crane felt that a cubic mile would be an easier concept for the general public than a trillion gallons.
1. Definition and Energy Equivalents
The CMO is defined as the energy released by burning a cubic mile of oil. One cubic mile is equal to about 4.2 billion cubic metres, 4.2 cubic kilometres or 26 billion barrels. Since the energy released by burning oil is about 38 gigajoules per cubic metre (5.8 million British thermal units per barrel), [1], the energy released by burning one cubic mile of oil is approximately equal to:
- 1.6×10²⁰ joules or 160 exajoules
- 4.4×10¹³ kilowatt-hours or 44 petawatt-hours
- 1.5×10¹⁷ British thermal units or 150 quads
As the energy released by burning natural gas is about 38 megajoules per cubic metre (1,000 British thermal units per cubic foot), the same energy is released by burning 4.2 trillion cubic metres (150×10^12 cu ft) of natural gas.
2. Annual Energy Consumption by Source
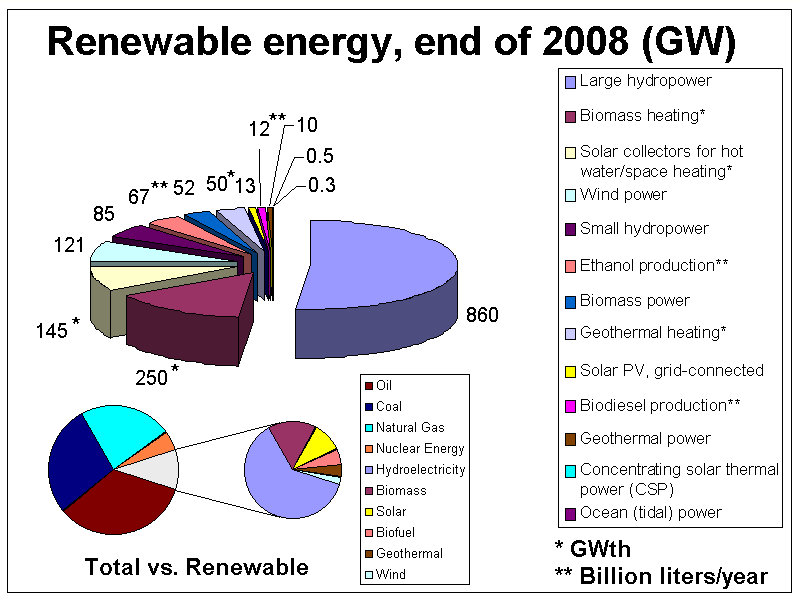
The world consumes approximately 3 CMO annually from all sources. The table [3] shows the small contribution from alternative energies in 2006.
| Source | CMO/yr |
|---|---|
| Oil | 1.06 |
| Coal | 0.81 |
| Natural gas | 0.61 |
| Biomass | 0.19 |
| Nuclear | 0.15 |
| Hydroelectric | 0.17 |
| Geothermal | <0.01 |
| Wind+Photovoltaic+Solar thermal | <0.005 |
A CMO/yr is about 5.084 TW continuous, making current world energy use around 15 TW.
3. Global Energy Reserves
Proved oil reserves are those that can be extracted with reasonable certainty under existing conditions using existing technology. Global proved oil reserves are estimated at approximately 1,300 billion barrels (210 billion cubic metres).[4] This corresponds to roughly 43 cubic miles, or 43 CMO. At the current rate of use, this would last about 40 years. Technological advances, new discoveries, and political changes will likely lead to additional proved oil reserves in the future. Concurrently, the International Energy Agency predicted in its 2005 World Energy Outlook that the annual consumption will increase by 50% by 2030.[5] Coal and natural gas currently provide 1.42 CMO of energy per year. Global reserves of these fossil resources are as follows:
- Natural gas reserves total 42 CMOs (69 years at current consumption)
- Coal reserves total 121 CMOs (150 years at current consumption)
- Additionally, there are large, albeit uncertain, amounts of tar sands, shale gas, and other unconventional fossil sources
4. Replacement of Oil by Alternative Sources
While oil has many other important uses (lubrication, plastics, roadways, roofing) this section considers only its use as an energy source.
The CMO is a powerful means of understanding the difficulty of replacing oil energy by other sources. In 2007, SRI International chemist Ripudaman Malhotra, working with Crane and colleague Ed Kinderman, used it to describe the looming energy crisis in sobering terms.[6] Malhotra illustrates the problem of producing one CMO energy that we currently derive from oil each year from five different alternative sources. Installing capacity to produce 1 CMO per year requires long and significant development.
Allowing fifty years to develop the requisite capacity, 1 CMO of energy per year could be produced by any one of these developments:
- 4 Three Gorges Dams,[7] developed each year for 50 years, or
- 52 nuclear power plants,[8] developed each year for 50 years, or
- 104 coal-fired power plants,[9] developed each year for 50 years, or
- 32,850 wind turbines,[10][11] developed each year for 50 years, or
- 91,250,000 rooftop solar photovoltaic panels[12] developed each year for 50 years
The energy produced is the power rating of the source multiplied by the duration it is operational. These comparisons take into account the variability of available power (solar panels work only during the day, turbines work only when the wind blows). In practice, due to losses as waste heat, it takes about 3 kWh (10,000 BTU) of primary heat energy to produce 1 kWh of electricity from coal and other fossil sources. Thus, when considering sources such as wind and solar which directly produce electricity, the required installed capacity was calculated by using 1 kWh as equivalent to 3 kWh (10,000 BTU).
The environmental, social, and financial costs of such development projects are immense:
- The Three Gorges Dam is the world's largest, flooding 632 km2, displacing 1.25 million people, and costing roughly US$30 billion.
- A conventional nuclear power plant produces hazardous radioactive waste, raises fears of radiation or nuclear proliferation, requires 4 years to construct for a 60-year lifetime, occupies about 4 km2, and may cost upwards of US$5 billion.
- A 500 MW coal-fired power plant may contribute to acid rain, global warming, and air pollution, occupies about 2 km2, may obtain its fuel via controversial methods such as mountaintop removal, and costs about US$650 million.
- A large wind turbine requires a location with an abundance of steady wind, may be visually obtrusive, can interfere with aviation, needs about 0.16 km2 to avoid interfering with adjacent turbines, and costs about US$2 million.[13]
- A 2.1 kW rooftop solar array requires technical skills for installation, needs a sunny location, presents few aesthetic or environmental problems, covers about 14 m2, but costs around US$15,000.
| Source | Number | Cost (US$1 trillion) | Area | |
|---|---|---|---|---|
| (km2) | (sq mi) | |||
| Dams | 200 | 6 | 1,264,400 | 488,200 |
| Nuclear plants | 2,600 | 13 | 10,400 | 4,000 |
| Coal plants | 5,200 | 3.4 | 10,400 | 4,000 |
| Wind turbines | 1,642,000 | 3.3 | 273,667 | 105,663 |
| Rooftop photovoltaics | 4,562,500,000 | 68 | 63,875 | 24,662 |
For comparison, US$3.2 trillion is the approximate gross domestic product of Germany, China, or the United Kingdom. The total land area of New Zealand is approximately 270,000 square kilometres (100,000 sq mi).[14]
At a 2008 market price of US$120 per barrel (US$750/m3), the cost of one CMO was about US$3 trillion. So for the cost of about one year's global oil consumption at 2008 market prices, enough wind turbines could be built to generate the same energy for 40 years, assuming sites are available.
5. Replacement of Oil by Speculative Alternative Sources
Space-based solar power and solar power above the clouds offers potential future energy technologies. As about five terawatt equals one CMO per year, it would take about 1000 five gigawatt power satellites to replace a CMO. To compete with coal, the maximum cost for space-based solar power plants would be US$2.4 billion per gigawatt. At that, the cost would be about $12 trillion for one CMO or about $36 trillion to replace the entire fossil fuel use of humans, or about 45 % of the gross world product for one year ((As of 2017) about US$80 trillion[15]). There is room in geostationary orbit for more than ten times the 2015 energy use.[16] At a peak production of 315 new power satellites per year, it would take less than a decade to get off fossil fuels.
The potential future technology of solar power above the clouds has the advantage that solar can be tapped at 20 km regardless of the local weather.
In both cases, a huge energy flow to carbon-neutral synthetic fuel plants could be utilized for transport sectors where electrification pose a challenge, (As of 2020) for example aviation.
References
- https://www.irs.gov/pub/irs-drop/n-99-18.pdf
- Renewables Global Status Report 2009 Update (PDF). http://www.ren21.net/pdf/RE_GSR_2009_Update.pdf
- "Can renewable energy make a dent in fossil fuels? | Green Tech - CNET News". http://news.cnet.com/8301-11128_3-9928068-54.html.
- "World Proved Reserves of Oil and Natural Gas, Most Recent Estimates". Energy Information Administration. 27 August 2008. http://www.eia.doe.gov/emeu/international/reserves.html. Retrieved 2008-12-06.
- "World Energy Outlook 2005" (pdf). International Energy Agency. 2005. pp. 43. http://www.iea.org/textbase/nppdf/free/2005/weo2005.pdf. Retrieved 2008-12-06.
- Joules, BTUs, Quads-Let's Call the Whole Thing Off - IEEE Spectrum https://spectrum.ieee.org/energy/fossil-fuels/joules-btus-quads-lets-call-the-whole-thing-off
- at rated 18 gigawatts
- at 1.1 gigawatts, such as the Diablo Canyon Power Plant
- at 500 megawatts
- A large turbine with 70-100 meter blade span, rated at 1.65 MW.
- "General Electric Wind Turbines". http://www.ge-energy.com/products_and_services/products/wind_turbines/index.jsp.
- a typical 2.1 kW panel
- "Archived copy". http://www.sunjournal.com/story/226451-3/Business/Wind_turbine_shortage_continues_costs_rising/.
- "New Zealand Facts". http://www.ace.net.nz/larryogden/facts.html. Retrieved 22 January 2011.
- "World Factbook". CIA World Factbook. 24 July 2019. https://www.cia.gov/library/publications/the-world-factbook/geos/xx.html. Retrieved 24 July 2019.
- Stine, G. Harry (1981). Space Power. National Space Society USA. [1]


