1. Introduction
A uniform solidification structure of fine and equiaxed grains is usually desirable for most engineering alloys, since it results in significant reduction of casting defects, leading to improved integrity and mechanical performance of the alloy castings
[1][2][3][4][5]. Grain refinement of engineering alloys is usually achieved by inoculation through externally added grain refiners, which is common foundry practice in Al- and Mg- industries. The most widely used commercial grain refiners for Al alloys are Al-Ti-B based master alloys containing excess Ti (e.g., Al-3Ti-1B or Al-5Ti-1B), while Mg-Zr master alloy is the grain refiner commercially available for Mg alloys, although it is only effective for Al-free Mg alloys
[3][6][7]. It has been well documented in the literature that promotion of the heterogeneous nucleation process by potent solid substrates, such as TiB
2 particles for Al- alloys and Zr for Mg- alloys, is an effective approach to achieving grain refinement, based on which a great deal of effort has been made over the last decades in the search for various particles potent for nucleation; yet, in spite of these efforts, there has only been success to some degree.
During solidification, heterogeneous nucleation occurs on solid substrates (either endogenous or exogenous particles) present in an alloy melt, and nucleation potency of the substrates is dependent on the atomic arrangement in their surface plane
[8]. As one of the important factors determining the nucleating potency, the lattice misfit at the interface between a substrate and nucleated new solid phase can be greatly modified by altering the atomic configuration of the substrate surface. In addition, the recent studies revealed that substrate surface roughness at atomic level
[9] and chemical interaction between the substrate and the melt
[10] affect nucleation potency considerably. Modification of atomic configuration and chemistry of substrate surface has been found to result in significant changes in nucleation potency. A good example is that, instead of TiB
2 itself, an atomic layer of Al
3Ti 2-dimensional compound (2DC) on the (0 0 0 1) TiB
2 surface is actually responsible for the extremely high potency of the TiB
2 particles for nucleation of α-Al
[11].
2. Segregation at Al/TiB2 Interface
2.1. Nature of TiB2 Particles
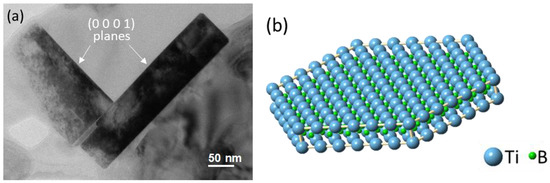
Figure 1a shows the morphology of TiB
2 particles in a commercial Al-5Ti-1B grain refiner master alloy, and
Figure 1b is the statistical result of the particle size which fits a log-normal distribution with the size spreading over the range of 0.15 µm to 2.5 µm and with a geometrical mean of
d0 = 0.43 µm
[12]. The faceted boride particles are typically of hexagonal shape, with the majority of the particles having a diameter/thickness ratio in the range of 3.1 to 5.6. The TEM image in
Figure 2a confirms that the TiB
2 particles are faceted with their {0 0 0 1} basal and {1 1 0 0} prismatic planes
[11], as shown schematically in
Figure 2b. It has been well documented in the literature that heterogeneous nucleation of Al occurs on the basal surface of TiB
2, where the (1 1 1)Al plane has the same hexagonal atomic arrangement to that of the basal plane of TiB
2.
2.2. Al/TiB2 Interface
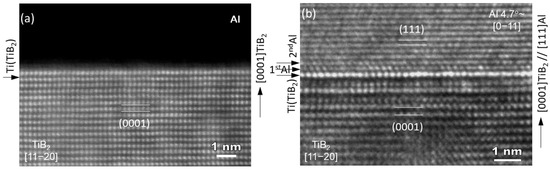
Extensive TEM examination of multiple TiB2 particles, which have clean surfaces without any elemental segregation, revealed that the majority of TiB2 particles have no specific orientation relationship (OR) with the Al matrix. The high resolution TEM images in Figure 3a show an interface between Al and faceted (0 0 0 1) surface of a TiB2 particle. It is seen that Al is away from any low index orientation while TiB2 is in its [1 1 2¯ 0]
direction. Despite a low possibility, Figure 3b confirms that heterogeneous nucleation of Al does occur on theTiB2 particle surface, where the (1 1 1)Al and (0 0 0 1)TiB2 planes are paralleled to each other, with a deviation of 4.7 degrees between the [0 1¯ 1]Al and [1 1 2¯0]TiB2 directions. Therefore, the OR for “clean” (no interfacial segregation) TiB2 and Al is:

This is the direct experimental evidence to verify that clean a TiB
2 particle nucleates Al on its basal (0 0 0 1) surface. Theoretical work using molecular dynamics (MD) simulations by Fan et al.
[13] recently demonstrated that, for a system with a negative lattice misfit, heterogeneous nucleation proceeds layer-by-layer, with the first layer accommodating the misfit through an edge dislocation network; the second layer twisting an angle through a partial screw dislocation network to reduce lattice distortion; and the third layer creating a crystal plane of the solid (the 2D nucleus) that templates further growth. The experimental TEM observation in
Figure 3b confirms the theoretical prediction that the −4.22% misfit between Al and TiB
2 requires such an orientational deviation, except for the first atomic layer for the TiB
2 templated Al nucleation, i.e., a twist of the nucleated solid relative to the substrate.
In the practice of inoculation to achieve grain refinement of Al alloys in industry, TiB
2 particles are introduced to the alloy melt by addition of commercial Al-5Ti-1B master alloy prior to solidification. Similar to the case in
Figure 3a, the majority of the added TiB
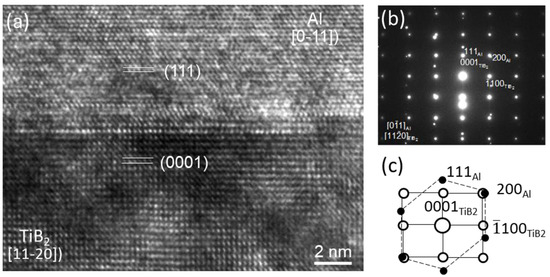
2 particles show no specific OR with Al. However, well-defined OR was observed between the two crystals. As shown by the high-resolution TEM image in
Figure 4a, the crystal planes of (1 1 1)Al and (0 0 0 1)TiB
2 are parallel to each other. Importantly, the directions of [0
1¯1]Al and [1 1
2¯ 0]TiB
2 are perfectly parallel to each other with no deviation, as indicated by the corresponding selected area electron diffraction (SAED) pattern in
Figure 4b,c obtained from the area across the Al/TiB
2 interface. The OR for the TiB
2 from Al-5Ti-1B master alloy is thus identified as
[11]:

Figure 4. The interface between Al and TiB
2 from Al-5Ti-1B grain refiner
[11]. (
a) HR-TEM image showing the Al/TiB
2 interface viewed in the direction of [1 1
2¯0] TiB
2 and [0
1¯ 1]Al; (
b) selected area electron diffraction (SAED) pattern taken from TiB
2 and Al across the interface; and (
c) the indexed pattern of (
b). The orientation relationship (OR) between TiB
2 and Al is: (0 0 0 1)[1 1
2¯ 0] TiB
2 // (1 1 1)[0
1¯1]Al.
By comparing
Figure 3b and
Figure 4, it is noted that there is no deviation between [0
1¯1]
Al and [1 1
2¯0]
TiB2 directions for the TiB
2 from the grain refiner. This is attributed to Ti segregation at the Al/TiB
2 interface, leading to a reduced lattice misfit between Al and TiB
2 at the interface
[11][13], which is further discussed in the next section.
OR2 indicates that, at the Al/TiB
2 interface, the most densely packed crystal planes with a hexagonal atomic arrangement of TiB
2 and α-Al, i.e., (0 0 0 1)
TiB2 and (1 1 1)
α-Al, are matching each other, with their most-densely packed directions, i.e., [1 1
2¯0]
TiB2 and [0
1¯1]
α-Al, being parallel to each other. The fact that the majority of TiB
2 particles were far away from any particular OR with α-Al indicates that most of the added boride particles did not contribute to the nucleation process, consistent with the conclusion derived from the free growth model, that only 0.1~1% of the added TiB
2 particles are active for heterogeneous nucleation
[14].
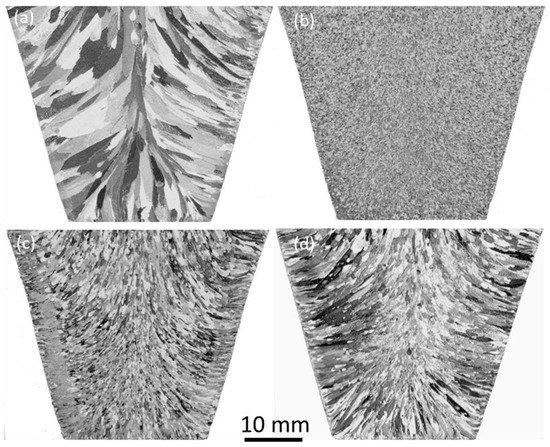
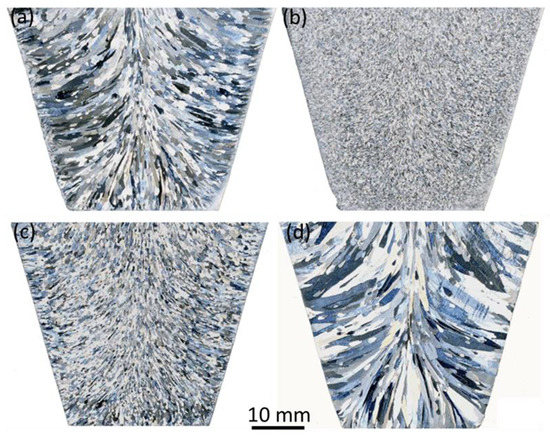
Addition of Al-Ti-B grain refiners to Al alloy melts prior to solidification is a common practice in the Al industry, which gives castings a significant grain refinement with fully columnar-to-equiaxed transition (CET). As shown in
Figure 5a,b, the grain structure of CP-Al solidified in the TP-1 mold changed dramatically from coarse columnar to fine equiaxed when 0.2% commercial Al-5Ti-1B grain refiner was added. The average size of α-Al grains achieved with the inoculation by TiB
2 was quantified as 175 ± 16 µm
[11], indicating the powerful grain refining effect of the grain refiner. However, additions of synthetic TiB
2 particles (
Figure 5c), or the synthetic particles plus 56 ppm excess Ti (
Figure 5d), where the size distribution and number density of the added synthetic TiB
2 particles and the excess Ti concentration were equivalent to those of the addition of 0.2% Al-5Ti-1B
[11], showed no grain refining effect. A coarse and columnar grain structure resulted, although the width of the columnar grains appeared finer than those of the sample without addition of the particles. This demonstrates that synthetic TiB
2 particles do not have the ability to grain refine α-Al, even combined with access to Ti in the melt
[11]. The result from grain refinement tests and the absence of deviation in OR2 suggest that there is something different between the synthetic TiB
2 and those from the commercial Al-5Ti-1B grain refiner.
2.3. Ti Segregation at Al/TiB2 Interface
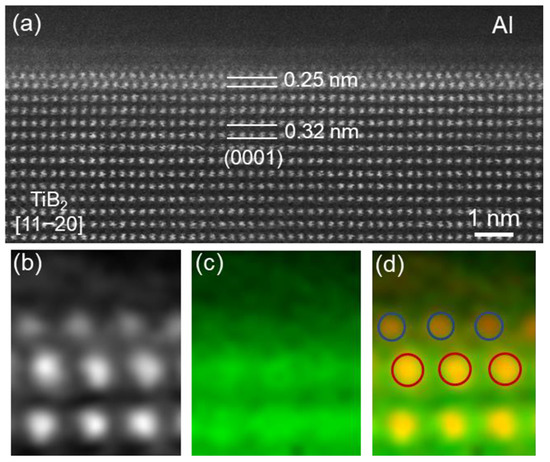
The high resolution STEM HAADF image in Figure 6a shows the interface between Al and a TiB2 particles from the Al-5Ti-1B grain refiner, where the electron beam is along the [1 1 2¯
0]
TiB2 direction but off from any low-index zone axis of α-Al. An atomic monolayer is clearly seen on the (0 0 0 1) surface of the TiB
2, with the spacing between the atomic monolayer and the surface (0 0 0 1)
TiB2 plane being measured as 0.25 nm, compared to 0.32 nm of the
d-spacing of (0 0 0 1)
TiB2 planes
[11]. SuperSTEM/EELS maps in
Figure 6b–d reveal the chemical nature of the local region across the Al/TiB
2 interface, confirming that the atomic monolayer contains Ti atoms
[11]. According to the experimental evidence of structure and chemistry, and supported by results obtained by MD simulation
[15], this Ti segregation layer was, therefore, identified as Al
3Ti 2-dimesional compound (2DC)
[11].
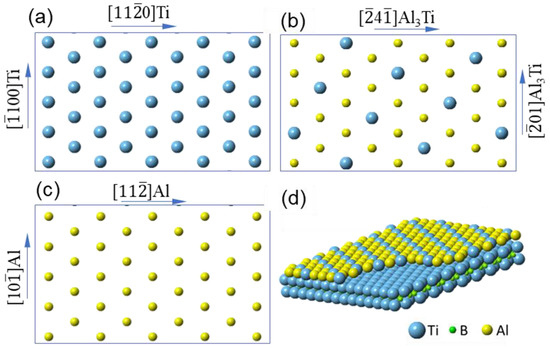
Figure 7a–c show schematically the atomic arrangement of (0 0 0 1)TiB
2, Al
3Ti 2DC layer and (1 1 1) Al plane respectively, and the schematic in
Figure 7d is the 3-dimensional construction of the monolayer on the (0 0 0 1) surface of TiB
2.
MD simulation was conducted by Qin and Fan to investigate the involvement of Al
3Ti in the heterogeneous nucleation of Al on TiB
2 at an atomistic scale
[15]. It was found that a two-dimensional Al
3Ti layer might remain on TiB
2 at a temperature above the Al liquidus. The simulation results showed that this 2D Al
3Ti underwent interface reconstruction by forming a triangular pattern, which consisted of different alternative stacking sequences. The transition region between the triangles forms an area of strain concentration. Through this mechanism, the interfacial Al
3Ti layer stabilizes itself by localizing the large misfit strain between TiB
2 and Al
3Ti.
The heterogeneous nucleation behavior of Al on TiB
2/Al
3Ti substrates was analyzed by Wang et al.
[16] using AIMD simulations. Structural ordering was clearly seen in the liquid close to the TiB
2 and Al
3Ti substrates at temperatures below the Al melting point. They found that the Ti-terminated TiB
2 surface had greater potential to nucleate Al. In particular, they observed that, compared to the TiB
2 substrate, the ordering in liquid Al close to the (1 1 2) terminating surface of Al
3Ti substrate was stronger on the Al
3Ti substrate and that the liquid Al readily transformed into a solid fcc-like structure at a smaller undercooling. This verified the higher nucleation potency of Al
3Ti over TiB
2. Simulations by Ma et al.
[17] also revealed an almost fully ordered liquid Al layer on (0 0 0 1)TiB
2 substrates.
The nucleation potency of a substrate is usually reflected, to a certain extent, by the lattice misfit at the interface between the substrate and the nucleated new solid phase at the moment of nucleation. According to OR2, the lattice misfit between Al and TiB2 at the interface is −4.22% at 660 °C, and the misfit decreases to 0.09% when the Al3Ti 2DC layer is formed. This means that the formation of the Al3Ti 2DC on the TiB2 surface results in a significantly increased nucleation potency of TiB2 particles by the much-reduced absolute lattice misfit.
A bulk Al
3Ti phase is stable in an Al-Ti alloy melt only when Ti concentration is greater than 0.15% according to the Al-Ti equilibrium phase diagram. However, Al
3Ti 2DC could be stable at the metal/substrate interface at a much lower Ti concentration of the bulk melt, driven by reduction of interfacial energy, due to Ti segregation according to Gibbs adsorption theorem, as shown by the theoretical analysis in
[18]. This is the case of the present work where Al
3Ti 2DC is readily observed on the (0 0 0 1) surface of TiB
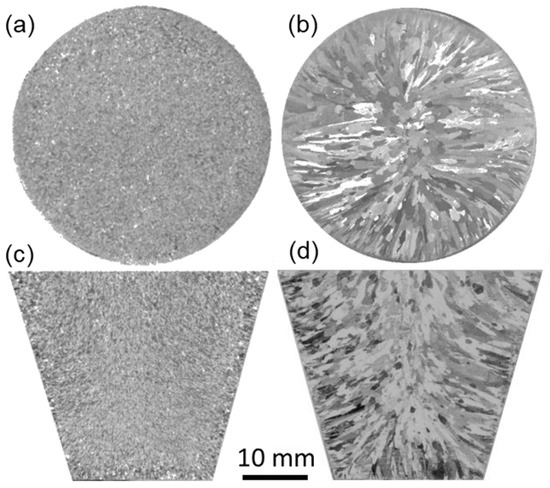
2 particles. Further experiment demonstrated that the Al
3Ti 2DC layer could be deliberately formed on the surface of synthetic TiB
2 particles by interfacial Ti segregation
[11]. As shown in
Figure 8a,b, the synthetic TiB
2 particles treated by melt shearing in Al-Ti alloy melt for 10 min at 850 °C became highly effective in grain refining CP-Al (
Figure 8b)
[11], comparable to those in a commercial Al-5Ti-1B grain refiner (
Figure 5b). However, the pre-existing Al
3Ti 2DC could be dissolved from the TiB
2 surface. TiB
2 particles from a commercial Al-5Ti-1B grain refiner have been seen to have no grain refining ability after being held in a CP-Al melt at 720 °C for 78 h (
Figure 8c) or treated in the CP-Al melt by high shear at the temperature for 45 min (
Figure 8d), respectively
[11]. The result verified that Al
3Ti 2DC, instead of TiB
2 itself, is responsible for the increased potency and, thus, the significant refining effectiveness of the commercial Al-5Ti-1B master alloys.
The difference between the TiB2 particles from commercial Al-Ti-B grain refiners and the synthetic ones is that the former have the Al3Ti 2DC layer on their surface, with the 2DC layer being readily formed at the high processing temperature and high excess Ti concentration during the production processes of the grain refiners.
Grain refinement of Al alloys achieved by addition of Al-5Ti-1B grain refiner is attributed to the factors below:
- (i)
-
Formation of Al3Ti 2DC on the surface of TiB2 particles during the grain refiner production process, which significantly increased the potency of TiB2 for nucleation of α-Al;
- (ii)
-
Sufficient numbers of added TiB2 particles which were coated with the Al3Ti 2DC layer, and suitable particle size and size distribution, which guaranteed sufficient number of grains to be initiated and grown from the nucleating TiB2 particles and achieved grain refinement;
- (iii)
-
Excess Ti in the alloy melt after grain refiner addition generated growth restriction, which increased the effectiveness of the grain refiner by allowing more TiB2 particles to be active for heterogeneous nucleation, which, in turn, promoted the columnar-to-equiaxed transition.
2.4. Zr Segregation at Al/TiB2 Interface
Zr-containing Al- alloys are usually difficult to be grain refined by commercial Al-Ti-B grain refiners with standard addition rates
[19][20][21][22][23][24][25]. Experiments have demonstrated that addition of Zr, even in a concentration of as low as a few hundred ppm, to Al alloy melts inoculated by Al-Ti-B grain refiner would result in no grain refinement after solidification
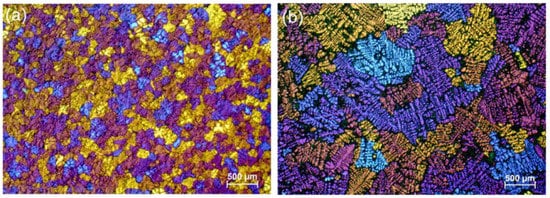
[2][19][22]. The loss of grain refining ability for Al-Ti-B grain refiners caused by Zr addition is referred to as “Zr poisoning”. The refined grain structure (
Figure 9a,c) of CP-Al by Al-5Ti-1B grain refiner is replaced by a coarse and columnar one (
Figure 9b,d) when 0.0558% (558 ppm) Zr is added to the Al melt
[26][27].
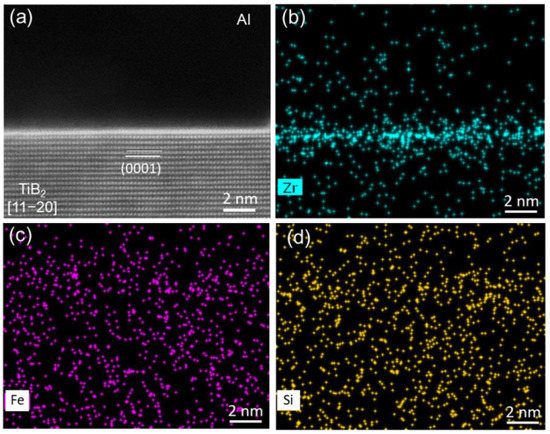
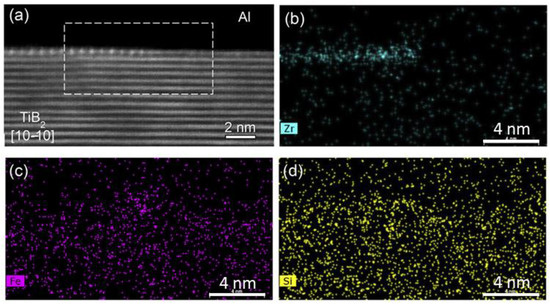
STEM examinations of TiB
2 particles introduced to the Al-Zr alloy melts by addition of a commercial Al-5Ti-1B grain refiner were carried out to study the effect of Zr on TiB
2 particles
[26]. STEM HAADF image and the corresponding super-X EDS maps across the Al/TiB
2 interface are shown in
Figure 10, where Zr enrichment at the interface is clearly seen (
Figure 10b), even at such a low Zr concentration (558 ppm). The Zr segregation corresponds to the brighter contrast of the interfacial layer seen in the HAADF image (
Figure 10a).
Figure 10c,d indicate that the main impurities in the alloy melt, Fe and Si, did not segregate at the interface.
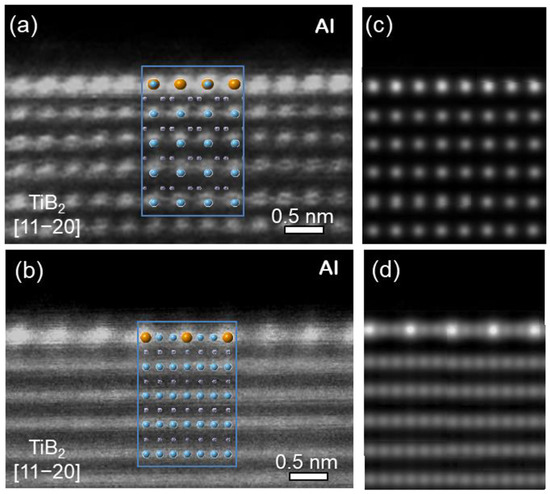
STEM HAADF imaging at high magnifications reveals that the Zr interfacial segregation results in the formation of an atomic monolayer at the Al/(0 0 0 1)TiB
2 interface, with the atomic columns in the monolayer being brighter than the Ti columns in the (0 0 0 1) plane of TiB
2, as shown in
Figure 11a, where the interface is viewed along [1 1
2¯0]TiB
2 direction
[26]. The higher brightness of the atom columns verifies the presence of heavier Zr atoms (than Ti) in the monolayer. When viewed along [1 0
1¯0]TiB
2 direction, the brighter atomic columns of the monolayer appear in a periodic pattern, i.e., one bright column between two darker ones, as shown in
Figure 11b. This suggests that, apart from Zr atoms, there is at least one type of other atom in the layer, with the in-plane atomic arrangement being ordered.
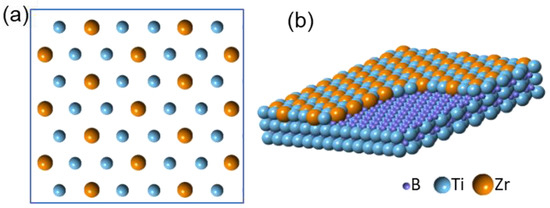
According to the experimental evidence of both structure and chemistry, the interfacial segregation layer is identified as Ti
2Zr 2DC
[26][29], with its in-plane atomic arrangement and 3D construction being shown schematically in
Figure 12a,b, respectively. With the inputs derived from the atomic configuration of the Ti
2Zr 2DC, HAADF image simulation was carried out using the QSTEM multi-slice package
[28]. The simulation result in
Figure 11c,d is in good agreement with the experimental images in
Figure 11a,b along both [1 1
2¯0]TiB
2 and [1 0
1¯0]TiB
2 directions, validating the nature of the Zr segregation layer at the interface. Formation of the Ti
2Zr 2DC layer resulted from the substitution of one third of Ti atoms in the top (0 0 0 1) Ti plane of TiB
2 by Zr atoms from the melt, which was possibly due to ZrB
2 being thermodynamically more stable than TiB
2. However, further penetration of Zr atoms into the TiB
2 crystal structure beyond the top (0 0 0 1) Ti plane is difficult due to the presence of the layer of B atoms beneath the Ti
2Zr 2DC, which have strong covalent bonds between the B atoms. Formation of any bulk ZrB
2 or (Zr
xTi
1−x)B
2 are kinetically unfavorable, even if they are thermodynamically feasible, as suggested in the literature
[19][30][31].
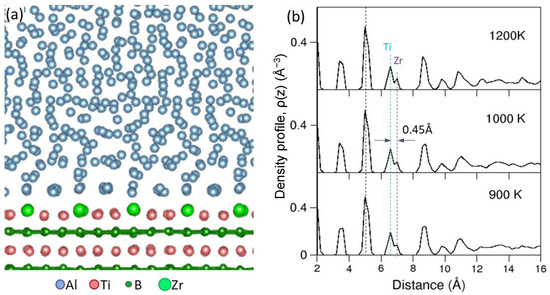
Atomic ordering in the liquid Al adjacent to the TiB
2 substrate at a temperature close to the alloy liquidus has been carried out by ab initio MD simulations (AIDM) for the Al(
l)/TiB
2 (Ti
2Zr 2DC) system at 900 K, 1000 K and 1200 K, respectively
[26].
Figure 13a shows the snapshot of the system equilibrated at 1000 K viewed along the [1 0
1¯0]
TiB2 direction, and
Figure 13b shows the atomic density profiles of the liquid Al adjacent to the Al(
l)/TiB
2 (Ti
2Zr 2DC) interface equilibrated at the three different temperatures. It is clear from the experimental evidence in
Figure 11 that the Zr atoms present in the Ti
2Zr 2DC layer protrude into the liquid Al. This protrusion of Zr atoms is evident in the atomic density profile in
Figure 13b where the peak for Ti
2Zr 2DC is seen to be separated into two sub-peaks, marked as Ti and Zr. Quantified by the atomic density profile, the central positions of the Zr atoms in the 2DC layer were 0.45 Å away from that of the Ti atoms, which represents 19% of Al (1 1 1)
d-spacing (0.2338 nm). This meant that the formation of Ti
2Zr 2DC on the (0 0 0 1) TiB
2 surface introduced a 19% atomic roughness to the TiB
2 surface. The consequent effect of the 2DC formation was that the atomic ordering in the liquid Al adjacent to the L/S interface was significantly weakened; only two clear peaks are shown in the atomic density profile (
Figure 13b), compared with 6 peaks on an atomically flat substrate surface
[32]. In addition, the protrusion of Zr atoms in the Ti
2Zr 2DC existed over a wide range of temperatures of 900 to 1200 K.
With Zr being in Al alloy melts, the pre-existing Al
3Ti 2DC on the TiB
2 surface becam thermodynamically unstable and dissolved. Due to the higher thermodynamic stability of ZrB
2 than that of TiB
2 [19][30], Zr atoms from the melt gradually substituted for some of the Ti atoms in the top (0 0 0 1) TiB
2 plane and the Ti
2Zr 2DC structure was, thus, formed.
Figure 14 shows the on-going process of the Ti
2Zr 2DC formation on the TiB
2 surface, where the 2DC layer seen at the left-hand side would extend to cover the whole (0 0 0 1) surface of the TiB
2 particle with proceeding of the segregation process
[26].
The Ti2Zr 2DC layer was coherent with (0 0 0 1) TiB2 plane, so the lattice misfit between the 2DC layer and Al was back to the value of −4.22%. The small lattice misfit 0.09% between Al3Ti 2DC and Al no longer existed. This would make the TiB2 particles with Ti2Zr 2DC impotent for heterogeneous nucleation of α-Al.
The spacing between Ti
2Zr 2DC layer and the first (0 0 0 1) Ti plane was experimentally measured as 0.34 nm, larger than 0.32 nm of d-spacing of (0 0 0 1)Ti planes. As shown above, ab initio MD simulations performed for the Al(liquid)/TiB
2 (Ti
2Zr 2DC) system revealed that the Zr atoms in Ti
2Zr 2DC protruded into the liquid Al by 0.45 Å
[26]. This meant that formation of Ti
2Zr 2DC resulted in roughness at the atomic level on the TiB
2 surface. The simulation also demonstrated that, with such a large lattice misfit and atomically rough surface, the atomic ordering in the liquid Al adjacent to the Al(
l)/TiB
2 interface was significantly weakened
[26], indicating a great decrease in nucleation potency of the TiB
2 particles with Ti
2Zr 2DC.
The mechanism underlying “Zr poisoning” of Al-Ti-B grain refiners is closely related to the dissolution of the pre-existing Al3Ti 2DC on the TiB2 surface in the commercial Al-Ti-B based grain refiners and the formation of Ti2Zr 2DC in Al-Zr melt, rendering the TiB2 particles impotent for heterogeneous nucleation of α-Al. With addition of Zr to Al alloy melts, despite a concentration as low as a few hundred ppm, the Zr atoms tend to segregate at the TiB2/melt interface, resulting in the following effects: (i) dissolution of the pre-existed Al3Ti 2DC on the TiB2 surface; (ii) the segregated Zr atoms at the interface substituting for some of the Ti atoms in the (0 0 0 1) surface to form the Ti2Zr 2DC atomic layer; and (iii) the Ti2Zr 2DC layer becoming atomically rough due to the considerably larger atomic size of Zr than that of Ti. The increased amplitude of lattice misfit (from 0.09% to 4.22%) and atomically roughened particle surface render TiB particles impotent for heterogeneous nucleation and they are, thus, poisoned.
2.5. Si Segregation at Al/TiB2 Interface
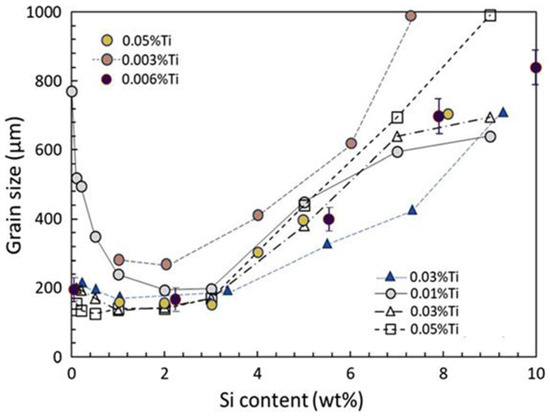
Si is also one of those elements which give rise to a poisoning effect on Al-Ti-B grain refiners. Experiments have shown that the Al-Ti-B based grain refiners are not effective for grain refining Al-Si alloys containing high Si concentrations
[33]. As shown in
Figure 15, the grain structure of Al-2.0Si alloy is refined by inoculation of 0.2% Al-5Ti-1B grain refiner with the average grain size being 195 ± 22 µm. However, the Al-8.4Si alloy added with the same amount of the grain refiner shows a much coarser microstructure, with the average grain size being 686 ± 73 µm, although the grain structure remains equiaxed. The experimental results in previous studies agree that, when inoculated with Al-Ti-B grain refiners with usual addition rates (0.1~0.2%), the grain size of hypoeutectic Al-Si alloys decreases marginally with increasing Si concentration until about 2–3% and then it starts increasing with further increase in Si content, as shown by the representative data collected from the literature in
Figure 16, plotted in Ref.
[33].
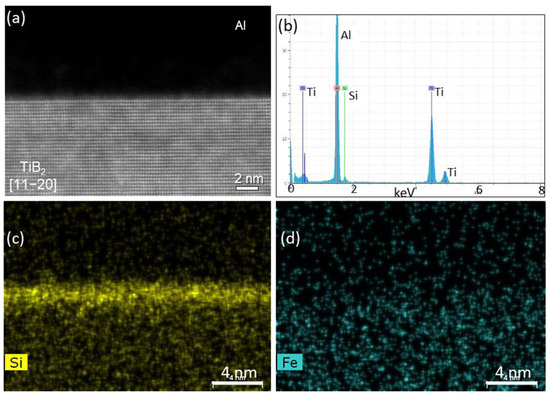
STEM/super-X EDS analysis on chemical profiles of the local region across the Al/TiB
2 interface reveals Si segregation at the interface
[33]. As shown in
Figure 17, a peak at the position of energy 1.74 keV, i.e., the characteristic Kα peak of Si, is clearly seen in the EDS spectrum in
Figure 17b, which was acquired from the Al/TiB
2 interfacial region, and the Si interfacial segregation is also shown in the corresponding EDS Si map in
Figure 17c. Fe, as one of the main impurities in CP-Al, was not detected at the interface (
Figure 17d). EDS analysis indicated that Si segregation at Al/TiB
2 interface was common to all the tested TiB
2 particles collected from Al-Si alloys containing 2–10% Si and 0.2% Al-5Ti-1B grain refiner
[33].
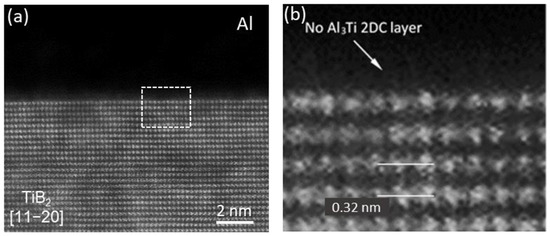
As shown earlier, TiB2 particles in commercial Al-Ti-B grain refiners are covered by an Al3Ti 2DC layer on their surfaces due to Ti segregation and the 2DC layer is responsible for the powerful ability for grain refinement. However, high resolution STEM examinations of multiple TiB2 particles which had been added to Al-Si alloy melts, revealed that the pre-existing Al3Ti 2DC on TiB2 surface was missing. Figure 18 shows the Al/TiB2 interface viewed from [1 1 2¯
0]TiB
2 direction of a TiB
2 particle from Al-8.4Si alloy melt, where no extra atomic layer, other than the (0 0 0 1)Ti layer of TiB
2, is seen, indicating the disappearance of the Al
3Ti 2DC
[33].
It is believed that, when TiB
2 particles are added to Al-Si melt, the Al
3Ti 2DC on their surface is not stable and dissolves into the melt. Evidence of such dissolution was experimentally observed in Al-Si alloys with a low Si concentration.
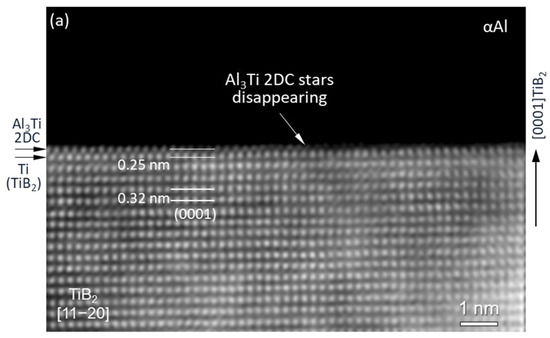
Figure 19 shows the on-going dissolution of Al
3Ti 2DC where the 2DC layer remained on the left-hand side but was missing on the right-hand side of the (0 0 0 1) TiB
2 surface. The remainder of the 2DC layer was more readily observed in low Si Al-Si alloys than in high Si ones, indicating that Al
3Ti 2DC was more unstable thermodynamically and kinetically, and, thus, dissolved faster in a high Si Al-Si melt than in a lower Si Al-Si melt
[33].
Si segregation does not lead to the formation of any 2DC layer or 3D bulk phase at the Al/TiB
2 interface. According to the Gibbs adsorption isotherm, solute segregation driven by interfacial energy reduction occurs only in one or two atomic layers. It is believed that Si enrichment by segregation at the interface can be considered a 2-dimensional solution (2DS), different from the cases of segregation of Ti or Zr, where in-plane ordered Al
3Ti 2DC
[11] or Ti
2Zr 2DC
[26] resulted at the Al/TiB
2 interface, respectively.
Dissolution of Al3Ti 2DC due to Si segregation results in the reduced nucleation potency of TiB2. As shown earlier, nucleation of α-Al now takes place directly on the (0 0 0 1) surface of TiB2 with a much increased lattice misfit −4.22% between {0 0 0 1}TiB2 and {1 1 1}Al instead of the small value 0.09% between Al3Ti 2DC and {1 1 1}Al at the interface. The mechanism for Si poisoning is, therefore, identified as.
-
Si interfacial segregation leads to enrichment of Si at the Al-Si melt/TiB2 interface. The higher the Si concentration in the melt, the more Si enrichment at the interface there is.
-
Si segregation at the Al-Si/TiB2 melt interface makes the pre-existed Al3Ti 2DC layer unstable on the TiB2 surface, and, thus, the 2DC dissolves gradually, resulting in a greatly decreased nucleation potency for the TiB2 particles. The dissolution rate of the 2DC layer increases with increasing Si enrichment at the interface.
-
The subsequence of the 2DC dissolution is a reduced total number of potent TiB2 particles available for heterogeneous nucleation and grain initiation of α-Al, and, hence, an increased grain size.
2.6. Fe Segregation at Al/TiB2 Interface
Fe segregation has not been observed at the Al/TiB
2 interface when its concentration is in an impurity level, e.g., ~0.08% in a commercial purity (99.8%) Al
[26][33]. However, Fe readily segregates at the interface when a relatively high Fe concentration, e.g., a few percent, is present in Al melt
[34][35][36][37].
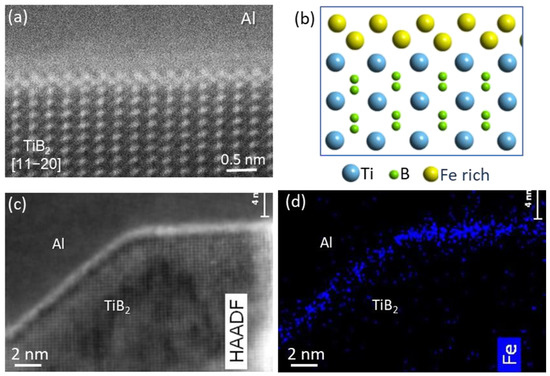
Figure 20 shows Fe segregation at Al/(1 1 0 0)
TiB2 (AlB2) interface in a sample in which the boride particles were in-situ synthesized by reaction of Al-8Fe and Al-10Ti master alloys in the CP-Al melt at 920 °C.
Figure 20a shows that a Fe-rich interfacial segregation layer on the prismatic surface of TiB
2 formed in a zig-zag fashion when viewed along [1 1
2¯0]TiB2 direction, with its atomic arrangement being schematically illustrated in Figure 20b. The EDS mapping in Figure 20d across the interface region in Figure 20c confirmed the Fe segregation at the interface. Interestingly, no Fe segregation was on the {0 0 0 1} basal surface of TiB2.
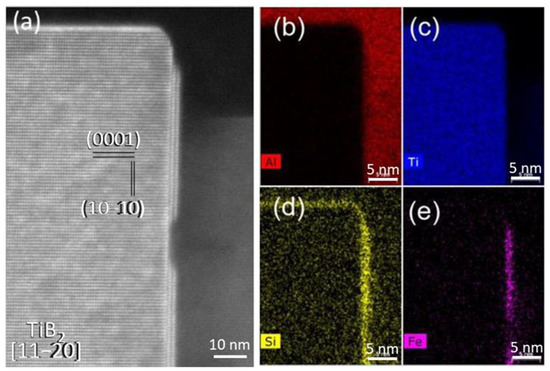
The behavior of Fe segregating selectively only on prismatic TiB2 surfaces has been repeatedly observed, as shown in Figure 21, with Fe segregation occurring discontinuously on the prismatic surface, but Si segregation covering both basal and prismatic surfaces of TiB2. Interestingly, accompanied by Si segregation, there are two atomic layers in the regions where Fe is enriched when observed in [1 1 2¯0]TiB2 direction.
It has been demonstrated that TiB
2 particles with Fe and Si segregation are effective to refine the primary α-Al
15(Fe,Mn)
3Si
2 intermetallic phase in Al-Fe-Si-Mn alloys, with the size of the intermetallic phase being reduced from a few tens of micrometers to a few of micrometers
[34][35][36][37][38]. The Fe- and Si-coated TiB
2 particles are frequently found inside the primary α-Al
15(Fe,Mn)
3Si
2 phase particles and have specific orientation relationships with the intermetallic phase, suggesting that more of such TiB
2 particles participated in nucleation of the Fe-rich intermetallic compounds
[35][36][37][38]. This is because, in addition to a structural templating, an extra compositional templating is provided by segregation of Fe and Si, and, thus, the heterogeneous nucleation and grain initiation processes are enhanced for the intermetallic compounds
[34][38].
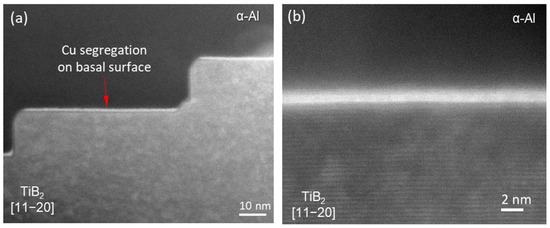
2.7. Cu Segregation at Al/TiB2 Interface
Cu is readily observed to segregate at the Al/TiB2 interface. The STEM HAADE images in Figure 22 show the interface between Al and both the (0 0 0 1) basal and (1 1 0 0) prismatic surfaces of a TiB2 particle from an Al-3Ti-1B-4.2Cu alloy. A brighter layer is visible at the (0 0 0 1)TiB2 surface, indicating the segregation of the heaver (than Ti) Cu atoms on the (0 0 0 1) basal surface of TiB2. As shown in Figure 22a, Cu seems not to segregate on the prismatic surface of TiB2.
In an Al-3.5Cu alloy containing TiB
2 particles which had been introduced by addition of commercial Al-5Ti-1B master alloy, Li et al.
[39] observed that there was a Cu-rich layer about 2 nm thick covering both the basal and prismatic plane surfaces of TiB
2 particles. It was further revealed that, on top of the (0 0 0 1) basal plane surface of TiB
2, there was an Al and Ti rich region which was an Al
3Ti 2DC layer, followed by an Al-rich layer with a much lower Ti content, and, finally, a Cu-rich layer of about several atomic planes (2–3 atoms) thick which exhibited in-plane ordering. On the {1 1 0 0} prismatic surface of TiB
2, Cu segregation was also detected, although no Al
3Ti 2DC layer was observed. The observation of an Al
3Ti 2DC layer on the TiB
2 surface was in agreement with the earlier work, with the 2DC layer being formed during the production of the commercial Al-5Ti-1B grain refiner.
It has been seen that segregation of Zr or Si results in dissolution of the pre-existed Al
3Ti 2DC layer. However, Cu segregation apparently does not interfere with the pre-existing Al
3Ti 2DC layer at the Al/TiB
2 interface. Instead, the Cu-rich layer resulting from interfacial segregation was on the top of the Al
3Ti 2DC
[39]. Consequently, such a Cu-rich layer at the interface is expected to affect heterogeneous nucleation, although the actual effect has yet to be determined.
3. Segregation at Mg/MgO Interface
3.1. Nature of Native MgO Particles in Mg Alloy Melt
Magnesium oxide (MgO) is readily formed in-situ during heating and melting of Mg alloys due to the very high affinity of Mg with oxygen. The native MgO in Mg alloy melts are usually in the form of films that consist of numerous nano-sized MgO particles
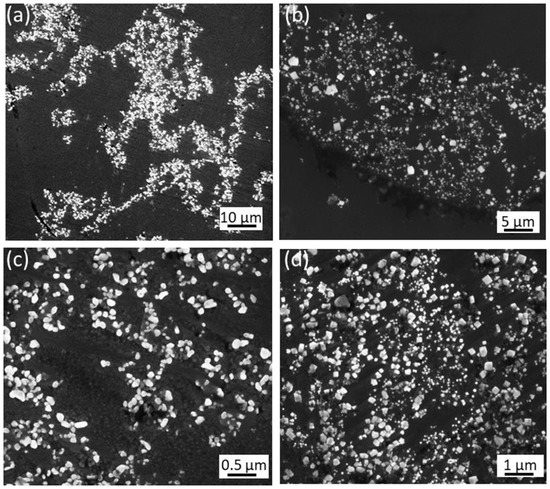
[40][41][42][43][44]. The oxide films in Mg alloy melts can be dispersed by means of intensive physical stirring; high shear, for instance, resulting in more discrete particles.
Figure 23 gives such an example where the high shear imposed to the melt is demonstrated to disperse the oxide films in Mg-9Al alloy (
Figure 23a) and commercial purity Mg (
Figure 23b) and makes the MgO particles uniformly distribute in the melt (
Figure 23c,d)
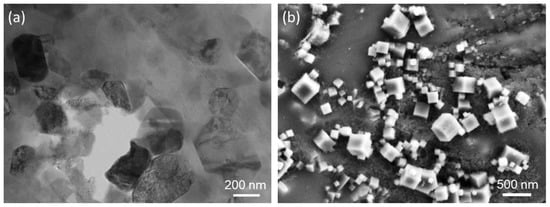
[41][42][43][44]. The individual MgO particles are faceted with either {1 1 1} or {1 0 0} planes, being the terminating surfaces, displaying two distinctive morphologies, i.e., {1 1 1} terminated octahedral (
Figure 24a) and {1 0 0} terminated cubic (
Figure 24b). The size of the MgO particles follows the log-normal distribution, with the average size being about 70–80 nm
[43][44].
3.2. MgO Acting as Nucleation Substrate
Native MgO has been demonstrated to act as an efficient substrate for nucleation of Mg, leading to significant grain refinement and improved mechanical properties for various Mg alloys
[41][42][44][45][46][47][48][49][50][51][52][53]. The experimental and theoretical investigations have shown that the key factors for native MgO to achieve grain refinement are its relatively poor nucleation potency and availability of high number density in the melt. The low nucleation potency of MgO enables a large nucleation undercooling ΔT
n which is required for triggering a so-called explosive grain initiation (EGI) scheme
[47][53] and the latter ensures numerous solid grains initiate and grow. MgO has a poor lattice matching with Mg at the interface with the lattice misfit of 7.9% when it nucleates Mg solid on its faceted {1 1 1} or {1 0 0} surfaces
[40][43]. With intensive melt shearing prior to solidification, the native MgO particles in the melt are well dispersed and the number density of the particles can be as high as ~10
17/m
3 [54], 3 order of magnitude higher than ~10
14/m
3 of TiB
2 when 0.1% Al-5Ti-1B grain refiner is introduced in Al melt
[14]. Given the current situation in the Mg industry where no commercial grain refiner is available, except Zr, which is only for Al-free Mg alloys, harnessing the native oxides in Mg alloy melts to achieve grain refinement is of great significance
[47][53].
3.3. Mg/MgO Interface
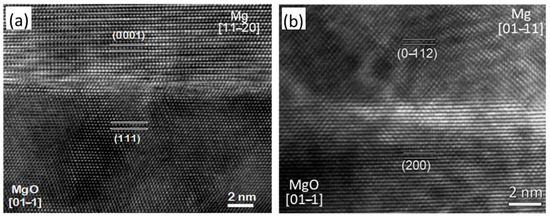
Among the two types of morphology, i.e., {1 1 1}MgO and {1 0 0}MgO faceted, the {1 1 1}MgO particles are dominant in terms of particle numbers
[41][43]. Well-defined ORs has been observed experimentally by high resolution TEM examinations of multiple MgO particles. As shown in
Figure 25, two ORs between the two types, MgO and Mg, have been identified as
[41][43][44]:

This is the direct evidence that solid Mg does nucleate heterogeneously on both {1 1 1} and {1 0 0} MgO particles.
Ab initio molecular dynamics (AIMD) simulation has been carried out to study the terminating surfaces of MgO and the ordering of atoms in the local region of melt adjacent to the L-Mg/MgO interface at a temperature above the liquidus, i.e., prenucleation
[55].
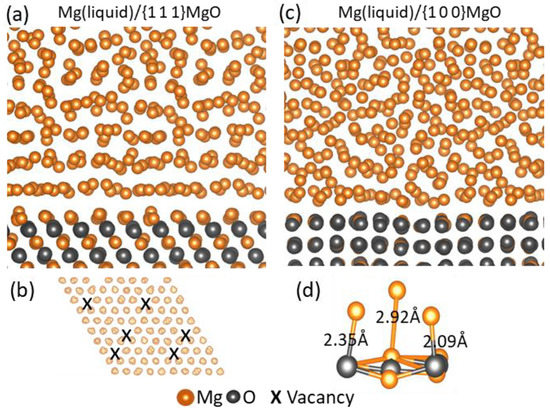
Figure 26a,b shows the snapshots of in-plane view of the newly formed terminating Mg layer on the {1 1 1}MgO surface and the corresponding sideview of the Mg/{1 1 1}MgO interface, respectively, after the thermodynamically equilibrium state was reached during the simulation at 1000 K. The new terminating layer was found to contain vacancies (marked by the crosses in
Figure 26b), introducing roughness on the atomic scale to the {1 1 1} MgO surface and, thus, greatly weakening the atomic layering in the melt adjacent to the L/S interface, as shown in
Figure 26b.
Figure 26c,d shows chemical bonding of liquid Mg atoms to the adjacent O and Mg ions in the {0 0 1}MgO substrate and the snapshot of the side view of the Mg/(1 0 0)MgO interface at the equilibrium state in the simulation. The bond length between Mg
2+ ion on the {1 0 0}MgO surface and Mg atom in the melt was 2.92 Å, 0.8 Å longer than that between O
2- ion and Mg atom in the melt (
Figure 26d), and the surface of {1 0 0} MgO was atomically rough
[55]. Consequently, the ability of (1 0 0) MgO to template ordering of the atoms in the melt was strongly reduced, i.e., a decreased prenucleation
[55].
3.4. Y Segregation at Mg/MgO{1 1 1} Interface
Yttrium (Y) is one of the rare earth elements which enables high performance of some advanced Mg- alloys, such as the WE series alloys. Y present in Mg alloy melts has been readily found to segregate at the Mg/MgO interface.
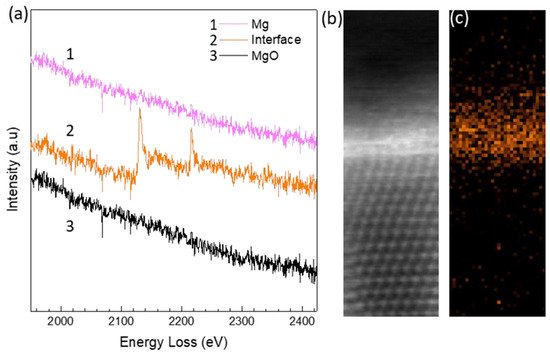
Figure 27 shows the experimental evidence of Y segregation in Mg-0.5Y melt at the interface between {1 1 1} faceted MgO and Mg, where the peaks of yttrium L edge losses clearly appear in the STEM/EELS spectrum in
Figure 26a (curve 2 in orange), acquired from the local area at Mg/MgO interface. The local STEM HAADF image (
Figure 27b) from [0 1 1]MgO direction and corresponding EELS elemental map of yttrium (
Figure 27c) verify the Y segregation at the interface
[40].
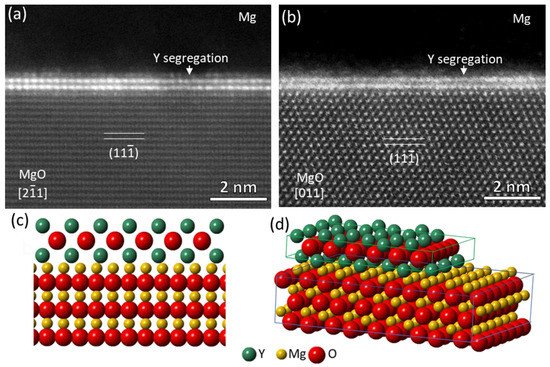
High resolution STEM HAADF images in
Figure 28a,b show the Mg/{1 1 1}MgO interface observed in [2
1¯ 1]
MgO and [0 1 1]
MgO directions, respectively. There are two interfacial atomic layers in which the atomic columns exhibit a higher brightness than (Mg, O) columns of MgO (O columns are invisible) in the HAADF images, verifying the presence of Y atoms in the two layers. Extensive STEM/EELS revealed that O atoms were also involved in the segregation region and an O layer was located between the two Y-containing layers
[40][56]. In terms of both the structure and chemistry, it was found that the 3 segregation layers, i.e., two Y layers and one O layer in between, resembled the three {1 0 0} layers of an fcc Y
2O
3 unit cell, although the measured spacing 2.73 Å between the two Y layers was slightly larger than 2.632 Å
[57], the d-spacing of {2 0 0}
Y2O3 planes indicating that interfacial segregation of Y atoms from alloy melt led to the formation of Y
2O
3 2DC.
Figure 28c,d illustrate schematically the atomic configuration of the segregated Y atoms viewed from [2
1¯1]
MgO direction and 3D construction of the Y
2O
3 2-dimensional compound (2DC) at the interface.
With the formation of Y
2O
3 2DC at the Mg/(1 1 1) MgO interface, Mg nucleates on the Y
2O
3 2DC, instead of on the (1 1 1)MgO surface. The lattice misfit at the interface is, therefore, calculated as 1.71%, much smaller than the initial value of 7.9% between Mg and MgO, according to the OR5 below
[40]:

The much-reduced lattice misfit between Y
2O
3 2DC and Mg indicates an increased nucleation potency for MgO substrate with the Y segregation. In addition, the heat of mixing between Y and Mg was reported as ~6 kJ/mol
[58], suggesting a strong affinity between Y and Mg atoms. A promotion of prenucleation is, therefore, expected in the melt close to the Mg melt/Y
2O
3-2DC interface due to the potential chemical reaction between Mg and Y atoms, subsequently promoting nucleation potency.
3.5. Y Segregation at Mg/MgO{1 0 0} Interface
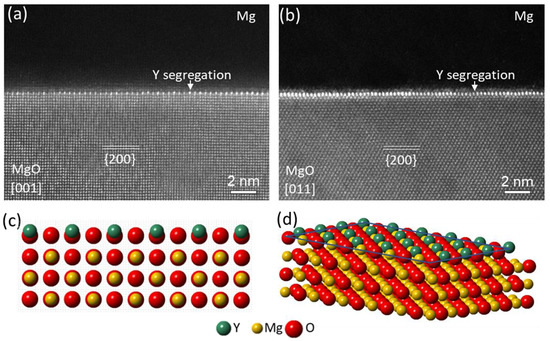
Y segregation is also observed on the surface of {1 0 0} surface of cubic MgO particles in Mg-0.5Y melt. However, the behaviour of Y segregation on the {1 0 0} MgO surface is considerably different from that on the {1 1 1} MgO surface
[40]. From [0 0 1]
MgO and [0 1 1]
MgO directions, respectively, the STEM HAADF images in
Figure 29 show that the atomic columns in an atomic monolayer at the Mg/(1 0 0)MgO interface have a high bright contrast, indicating that Y atoms are in the atomic layer. When viewed in [0 0 1]
MgO, Y-containing atomic columns are seen in every other (Mg, O) column of the top (1 0 0)MgO plane, resulting in the periodic brightness pattern, i.e., the brighter column appearing on every other column when viewed from [0 0 1]MgO direction, as shown in
Figure 29a. The brightness pattern of the monolayer disappears when viewed from the [0 1 1]MgO direction, as shown in
Figure 29b. This indicates that Y atoms are present only in the Mg columns of the top (1 0 0)MgO layer.
It was also noted that the Y-containing atomic columns of the monolayer were elongated vertically when viewed from both [0 0 1]MgO and [0 1 1]MgO directions, with the protrusion being experimentally measured as 0.62 Å
[40]. Further analysis showed that this was because only part of the Mg atoms in the columns of the top (1 0 0) MgO layer were substituted by Y atoms, with the Y atoms being protruded relative to the remaining Mg alloys in the column
[40].
Figure 29c,d are schematics, showing the atomic configuration of the segregated Y atoms viewed from the [0 0 1] MgO direction and 3D construction of the monolayer on the (1 0 0) surface of MgO.
The Y-containing atomic monolayer on the {1 0 0} facets of the cubic MgO was coherent with the top {1 0 0}Mg plane, and, therefore, the lattice misfit between the newly formed monolayer and Mg remained the same as before. However, an atomic roughness was introduced to the monolayer due to the vertical protrusion by 0.62 Å of the Y atoms, which reduced the nucleation potency of the {1 0 0} cubic MgO and, thus, impeded prenucleation
[9][55].
3.6. Segregation of Ca and Sn at Mg/MgO Interface
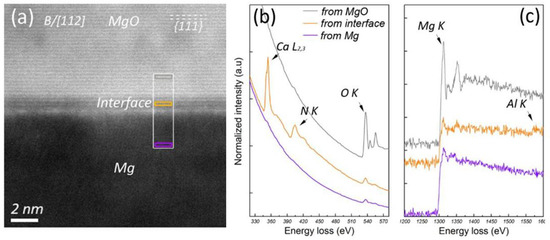
As one of the essential alloying elements in advanced high-performance Mg alloys, Ca is found to segregate readily at the Mg/MgO interface of native MgO particles.
Figure 30 shows the evidence of Ca segregation, where a layer about 1 nm thick is seen at the Mg/(1 1 1)MgO interface, appearing in a relatively lower contrast compared with MgO in the HAADF image in
Figure 30a. STEM/EELS acquired from different positions across the interface in
Figure 30b,c indicate that the chemistry of the segregation layer differs from that of MgO or Mg matrix. Ca segregation at the Mg/MgO interface is associated with N which comes from the protection atmosphere during casting process. Detailed analyses showed
[50][56] that the Ca segregation layer at Mg/MgO particles had a crystal structure resembling that of the bulk MgO crystal, with Ca and N atoms selectively substituting some of the Mg and O atoms on the MgO surface, respectively. The co-segregation of Ca and N results in a surface roughness and in-plane disordering, which, in turn, makes the pre-nucleation difficult, reducing nucleation potency of the MgO modified by the co-segregation of Ca and N.
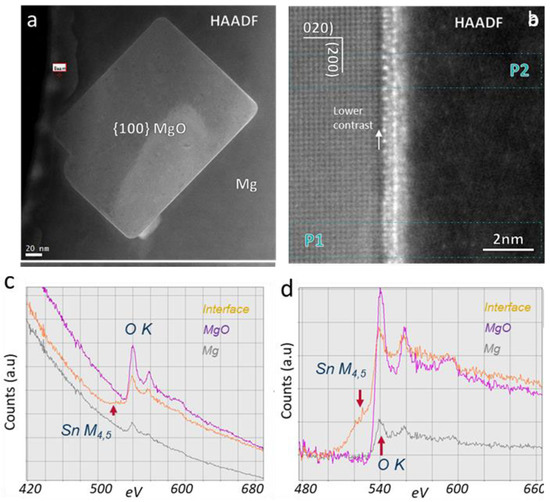
Figure 31 gives evidence of Sn segregation at the Mg/(1 0 0)MgO interface. The HAADF images in
Figure 31a,b show that there is a layer with a brighter contrast at the interface, apparently indicating an enrichment in Sn at the interface. The EELS in
Figure 31c,d confirms the Sn segregation. It is shown that the segregated Sn atoms selectively substitute some of the Mg atoms in MgO without changing the lattice structure
[56]. Detailed chemical and structural revealed that, with Sn segregation at the Mg/MgO interface, a roughness on the atomic scale was introduced and, thus, the ability for Mg to pre-nucleate on the MgO particles decreased
[56].
4. Segregation at Al/γ-Al2O3 Interface
4.1. Nature of γ-Al2O3
Liquid Al oxidizes readily at the surface when it is exposed to an atmosphere containing oxygen and/or water moisture, producing two major types of alumina, γ-Al
2O
3 and α-Al
2O
3, with different crystal structures. The alumina is subjected to transformation from γ-Al
2O
3 to α-Al
2O
3 with increasing time and temperature. The formation of α-Al
2O
3 was reported to occur at temperatures higher than 850 °C in Al-alloy melts
[59]. Over the temperature range involved for cast processing of Al-alloys, typically lower than 750~800 °C, the native alumina formed in the melts are γ-Al
2O
3 [48][60][61][62][63]. However, Mg addition to Al alloys results in change of the oxide from Al
2O
3 to MgAl
2O
4 spinel or MgO, depending on Mg concentration
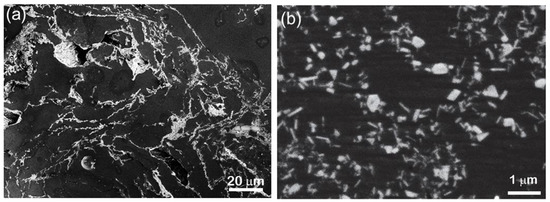
[48][60][63]. The alumina in commercially pure Al (CP-Al) at 750 °C are usually in the form of films (
Figure 32a) containing enormous individual γ-Al
2O
3 particles (
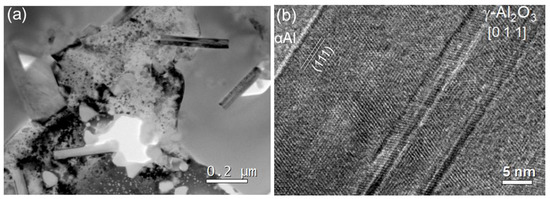
Figure 32b). Typically, γ-Al
2O
3 particles in CP-Al melt display platelet-like morphology, about 50 nm thick and 200–300 nm long on average (
Figure 33a). {1 1 1} crystal planes are the terminating surfaces of the faceted alumina platelets, and twins along the {1 1 1} planes are also frequently observed inside them (
Figure 33b). For convenience, γ-Al
2O
3 with a {1 1 1} faceted morphology is denoted as γ-Al
2O
3{1 1 1}.
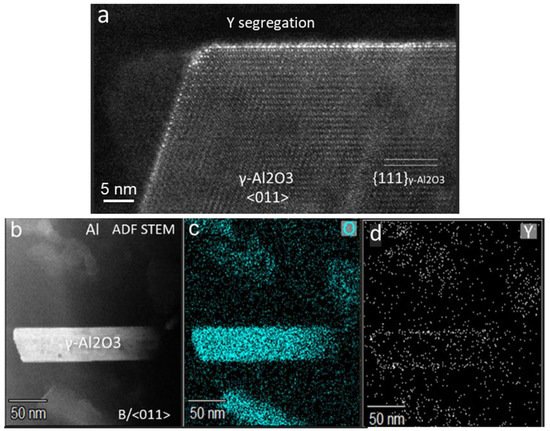
4.2. Y Segregation at Al/γ-Al2O3 Interface
Al2O3 particles were collected from Al-0.075Y alloy melt and segregation of Y at the interface between Al and {1 1 1} terminating surface of γ-Al2O3 was investigated. The experimental results revealed the evidence of Y segregation at the Al/γ-Al2O3 interface, which was consistently observed by high resolution STEM-HAADF/ADF images, STEM/EDS mapping and STEM/EELS analysis, etc. Figure 34a is a Z-contrast STEM-HAADF image of Al/γ-Al2O3 interface, where a monolayer with a brighter contrast than the γ-Al2O3 is observed. The yttrium atom was much heavier than Al (ZY = 39 vs. ZAl = 13), so the brighter contrast in the HAADF image suggests Y enrichment in the monolayer at the interface. The arrangement of Y-rich atomic columns in the monolayer was identical to the high-density Al columns in the γ-Al2O3 crystal, having an interatomic spacing of ½ < 011 > γ-Al2O3. The Y segregation layer was found to cover the whole Al/γ-Al2O3 interface, confirmed by the STEM/EDS mapping in Figure 34b–d.
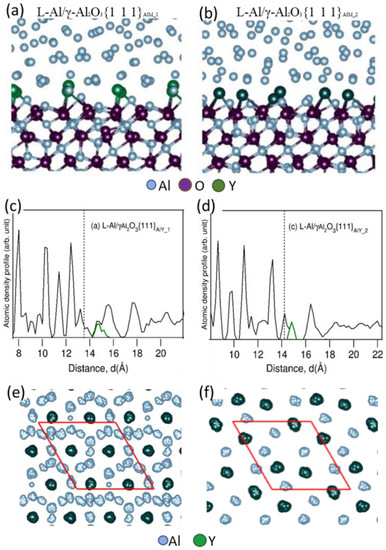
Ab initio molecular dynamics (AIMD) simulation was performed to clarify the above experimental evidence of Y interfacial segregation and to reveal the effect of segregation on the atomic ordering of liquid atoms close to the L-Al/γ-Al2O3{1 1 1} interfaces. As shown in Figure 35a,b, Y atoms (large dark green spheres) in Al melt tend to segregate at the L-Al/γ-Al2O3{1 1 1} interface, due to their lower electronegativity values than Al and higher stability of yttria than that of alumina. Both structurally and chemically, Y segregation results in the formation of approximately Al2Y two-dimensional compound (2DC) and the reconstruction of the metal layers adjacent to the surface of the γ-Al2O3{1 1 1} substrate, in agreement with the HR-STEM results. It was also seen from the atomic density profiles in Figure 35c,d that the segregated Y atoms protruded into the alloy melt with respect to the Al atoms, and this splitting of the terminating layer would introduce an atomic roughness to the {1 1 1} surface of the γ-Al2O3. As a consequence, the potency of the γ-Al2O3 substrate for nucleation of Al was weakened. Figure 35e,f show the top view of the in-plane atomic arrangement of the Y segregation layer at the Al/γ-Al2O3 interface, showing the atomic arrangement of the Al2Y 2DC.
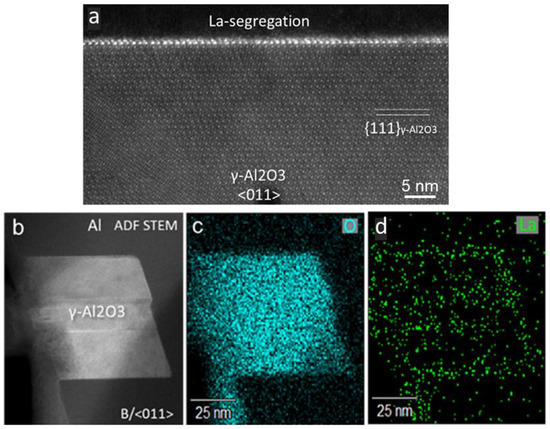
4.3. La Segregation at Al/γ-Al2O3 Interface
La segregation was readily observed at Al/γ-Al
2O
3 interfaces during the examination of multiple numbers of γ-Al
2O
3 particles in Al-0.075La and Al-0.75La alloys
[62].
Figure 36 shows a STEM-HAADF/ADF image and STEM/EDS maps covering a γ-Al
2O
3 particle from Al-0.75La alloy melt, where a brighter monolayer at the interface is clearly visible, with the brighter atomic columns in the monolayer arranged in an interatomic spacing of ½ < 0 1 1 >
γ-Al2O3. The existence of La in the bright atomic columns of the monolayer was further confirmed by the EDS map of La in
Figure 36d, where La segregation was seen to continuously cover the Al/γ-Al
2O
3 interface.
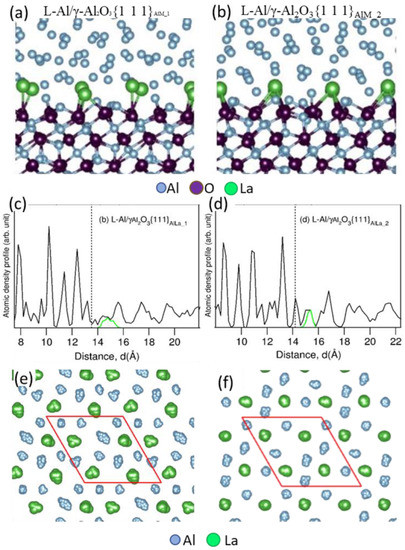
AIMD simulation of the L-Al/γ-Al
2O
3 interface where La segregated showed similar results to that of the interface with Y segregation
[62]. As shown in
Figure 37, La atoms (light-green spheres) were found to segregate at the interface, with the structure and chemistry of the La-containing layer being similar to Al
2La 2DC. In addition, the La atoms with a much larger atomic radius than Al atoms were seen to protrude into the alloy melt, as shown in
Figure 37a,b. The protrusion of La atoms is clearly seen in the atomic density profiles in
Figure 37c,d.
Figure 37e,f show the top view of the in-plane atomic arrangement of the La segregation layer at the Al/γ-Al
2O
3 interface, indicating the formation of Al
2Y 2DC. Due to the protrusion of La atoms in the Al
2La 2DC layer at the interface, the γ-Al
2O
3 surface was atomically rough. The simulation revealed that, due to the atomic roughness of the Al
2O
3 surface, the prenucleation at the L-Al/γ-Al
2O
3{1 1 1} interface was weakened to a similar level by the interfacial segregation of Y and La atoms.
 +1 credit