 +1 credit
| Version | Summary | Created by | Modification | Content Size | Created at | Operation |
|---|---|---|---|---|---|---|
| 1 | Swee-Suak Ko | + 3349 word(s) | 3349 | 2020-11-03 09:24:29 | | | |
| 2 | Rita Xu | -520 word(s) | 2829 | 2020-11-11 06:54:31 | | |
Video Upload Options
Vanilla orchid is a shade-loving plant that is very sensitive to high radiation. We found that blue light treatment can induce photoacclimation and enhances vanilla orchid acquired photoprotection. Blue light induces chloroplast avoidance, increases antioxidant enzyme activities, and enhances photosynthesis rate when vanilla orchid is exposed to high light stress. This study found that acclimating vanilla orchid with blue light before transplantation to the field might eliminate photoinhibition and enhance vanilla growth and production.
1. Introduction
Vanilla orchids makeup about 110 species in the orchid family (Orchidaceae) and boast the family’s only edible fruit. Vanilla orchids are distributed between 27 °N and 27 °S on all continents [1]. Vanilla planifolia, the most popular cultivated species of vanilla, known as “Bourbon” or “Mexican” vanilla, is native to the tropical forests of Central America and Mexico and was historically cultivated by the peoples of Mesoamerica. Vanilla pods produce vanillin, which is a fragrant compound with high economic value. Today, market demand for natural vanillin is increasing, and vanilla orchid is cultivated in many tropical and subtropical zones [2]. Vanilla orchid performs crassulacean acid metabolism (CAM) photosynthesis. Photosynthetically active radiation (PAR) is the portion of the light spectrum that can be utilized for photosynthesis. For a CAM plant, PAR intensity during the day affects the rate of mobilization of organic acids from the vacuole (Phase III) [3]. Besides, light intensity during the day also affects CO2 absorption during the night (Phase I), thus affecting the abundance of carbohydrate production through the Calvin cycle. The vanilla orchid is a shade-loving plant that is very sensitive to high radiation. For vanilla orchid production, support trees should have a dense canopy to provide 70% to 80% shade [4]. A high light of 67% relative illumination inhibits vanilla growth, reduces Fv/Fm, and decreases CO2 uptake. It has also been found that vanilla has higher photosynthesis and biomass growth under intermediate levels of radiation of 17% to 31% relative illumination [5].
Plants are known as photoautotrophs because they have the ability to conduct photosynthesis, which synthesizes glucose from carbon dioxide and water using light energy. Photosynthesis is a comprehensive pathway that consists of the light-dependent (photosystem (PS)) and light-independent (Calvin cycle) pathways. Light reactions take place in the chloroplast thylakoid membrane for the splitting of two water molecules into one oxygen molecule and four protons and electrons. Then, the protons and electrons are transferred through the thylakoid membrane to create the energy-carrying molecules adenosine triphosphate (ATP) and nicotinamide adenine dinucleotide phosphate (NADPH). ATP and NADPH are then used by RuBP carboxylase/oxygenase for the Calvin cycle to convert CO2 into carbohydrates [6]. PSII and PSI are located in the thylakoid membranes, and they are very sensitive to high light-induced oxidative stress. If PAR is in excess, the electron transport of PSII is inhibited, and its core protein structure is damaged. Sequentially, PSI can be impaired if the electron transport of PSII is restricted [7]. Excess light causes ROS toxicity and oxidative stress to the thylakoid membrane and other essential components of chloroplasts, finally blocking photosynthesis and causing photo-oxidative damage [8].
To prevent photoinhibition and to acquire acclimation to light-fluctuating environments, plants have developed direct and indirect mechanisms for sensing and reacting to the high light irradiation [9]. Photoprotection mechanisms include regulation of light absorption and dissipation of excess light energy. Plants can change their leaf area and leaf angle, initiate chloroplast avoidance and decrease the size of their light-harvesting complex (LHC) antenna. Blue light photoreceptors, called phototropins (phot1 and phot2), play an essential function in chloroplast movement [10]. A recent study showed that blue light induces chloroplast movement in several monocot C3 plants [11]. In CAM moth orchids, when blue light irradiation is above 25 μmol m−2s−1, chloroplasts start to show avoidance movement and significant chloroplast avoidance has been found in the strong blue light of 100 μmol m−2s−1 [12]. When extra light has been absorbed, the plant will dissipate the excessive light energy through thermal dissipation via nonphotochemical quenching (NPQ) [7][13]. Plants also have other photoprotective modes such as nonphotochemical quenching of fluorescence (qN) and photochemical quenching of fluorescence (qP), which can be early signs of photoinhibition [14]. D1 (PsbA), a photosystem II reaction center protein, is a target of photodamage under excess light. Degradation and turnover rate of the new synthesis of D1 protein affect the photoprotection level [15]. Overexpressing D1 protein in Arabidopsis, tobacco, and rice increased photosynthesis efficiency and significantly enhanced crop yield [16]. Also, overexpressing Rieske Fes protein (PetC), a subunit of the Cytochrome b6f complex, increased D1 protein, and enhanced photosynthesis efficiency of PSI and PSII, consequently improving Arabidopsis growth and seed yield [17]. Moreover, overexpression of the Rieske FeS protein increases C4 photosynthesis in Setaria viridis [18]. Clearly, increasing and manipulating the photosynthesis rate and combining several promising photosynthetic traits might enhance plant growth and crop yield [19][20].
Reactive oxygen species (ROS), such as singlet oxygen and H2O2, are generated as byproducts of photosynthesis and play important roles as signals involved in responses to excess light [9]. Plants turn on ROS scavenging enzymes such as superoxide dismutase (SOD), catalase (CAT), and ascorbate peroxidase (APX) to detoxify ROS molecules [21]. Moreover, they have antioxidative defense mechanisms to operate reduction-oxidation (redox) homeostasis and maintain ROS efficiently [8].
2. Blue Light Induces Chloroplast Movement in Vanilla Orchid
The vanilla orchid is sensitive to high irradiation. It is believed that chloroplast avoidance can reduce photodamage. To understand whether vanilla orchid chloroplast movement is dependent on blue light (BL) or red light, we exposed vanilla orchid leaves (L3) to monochromic LED red light (RL, λmax = 660 nm) and blue light (BL, λmax = 450 nm), respectively, at a light intensity of 50 μmol m−2 s−1 for 5 h. Slit assay results indicated that BL-treated leaves have a light green color, but RL-treated leaves do not (Figure 1a,b). Hence, chloroplast movement is dependent on blue light in vanilla orchid. We compared the chloroplast movement of young (L3) and mature (LM) leaves at various BL intensities. Vanilla orchid leaves were dark-adapted overnight then exposed to BL of 0, 5, 10, 20, 50, and 100 μmol m−2s−1, respectively, for 5 h, and Soil Plant Analysis Development (SPAD) data were recorded every hour. Under continuous dark conditions, the relative SPAD value was stable and close to one (baseline), indicating that chloroplasts did not move. When L3 leaves were irradiated with BL5, the relative SPAD value was greater than one, implying that the orchid had chloroplast accumulation movement (Figure 1c). Under BL10, chloroplasts tended to show avoidance in the first 3 h, then returned to baseline. When irradiated >BL20, chloroplasts started to show avoidance movement, and significant chloroplast avoidance was observed when leaves were exposed to BL100 (Figure 1c). Compared to young leaves, mature leaves (LM) had a narrower range SPAD curve, indicating that mature leaves had less chloroplast movement (Figure 1d). These data indicated that vanilla orchid young leaves are more sensitive to BL irradiation than the mature leaves. Both young and mature leaves of vanilla orchid have chloroplast avoidance movement when exposed to >BL20 irradiation. We collected leaf samples after 4 h exposure to BL5, BL100, and dark control, isolated RNAs, and detected gene expression of phot1 and phot2. qRT-PCR results indicated that young leaves (L3) expressed a similar amount of phot1 and phot2 at BL5, and phot2 was expressed at a higher level than phot1 in the dark and under BL100 (Figure 1e). For mature leaves (LM), dark conditions resulted in the lowest gene expression levels of phot1 and phot2; the second-highest levels were at BL5, whilst the highest gene expression levels of phot1 and phot2 were found in BL100. It was found that phot2 was expressed at higher levels than phot1 in the dark and under BL5 and BL100 in the mature leaves of vanilla orchid (Figure 1f).
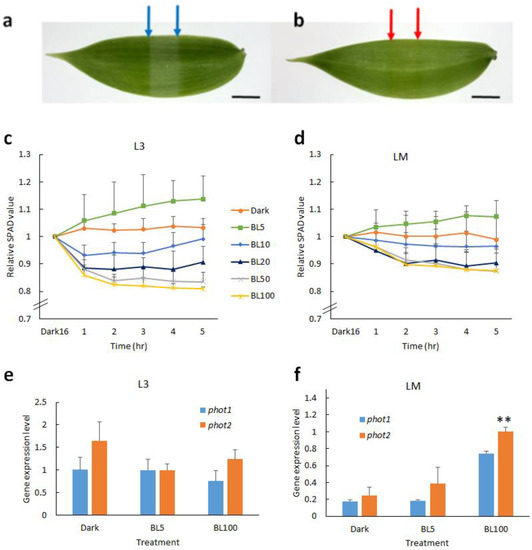
Figure 1. Effect of light on vanilla orchid chloroplast movement and gene expression patterns of phototropins. Slit assay showed that vanilla orchid chloroplast movement is dependent on blue light. Young leaves (L3) were dark-adapted for 4 h and then exposed overnight to monochromic LED blue light at 50 μmol m−2 s−1 (a) and red light at 50 μmol m−2 s−1 (b), respectively. Blue and red arrows indicate the leaf area exposure to blue or red light for slit assay chloroplast movement. Scale bar, 1 cm (a,b). (c) SPAD assay chloroplast movement of young vanilla leaves (L3) in response to various blue light intensities. (d) Chloroplast movement of mature vanilla leaves (LM). Quantitative RT-PCR indicated the gene expression patterns of phot1 and phot2 in the dark and under BL5 and BL100, respectively, in young leaves (L3) (e) and mature leaves (LM) (f). Error bars represent the standard error of the mean (n = 3) (c–f).
3. Effect of Light and Temperature on Chlorophyll Fluorescence of Vanilla Orchid
To understand how light intensity affects vanilla orchid photosynthesis, we measured the Chl F parameters of vanilla orchid leaves exposed to various light intensities at 100, 150, 200, 300, 400, 500, and 1000 μmol m−2 s−1, respectively. Results indicated that high light at 1000 μmol m−2 s−1 significantly reduced the electron transport rate (ETR) (Figure 2a). Nonphotochemical quenching (NPQ) showed no significant difference between various light intensities (Figure 2b). The photochemical quenching of fluorescence (qP) peaked at 100 μmol m−2 s−1, then gradually decreased when light intensities were higher than 150 μmol m−2 s−1 and decreased to near zero at 1000 μmol m−2 s−1 (Figure 2c). We then fixed leaf chamber light intensity at 150 μmol m−2 s−1 and set the temperature to 21, 24, 26, 30, 33, or 36 °C and detected Chl F parameters. Results indicated that 21 °C had the lowest ETR and qP but increased when the temperature increased. Vanilla orchid tended to have the highest ETR and qP at 33 °C, then gradually decreased again when the temperature increased up to 36 °C (Figure 2d,f). Vanilla orchid had the lowest NPQ at 33 °C (Figure 2e). This study showed that suitable light (100 to 150 μmol m−2 s−1) and temperature (33 °C) may enhance vanilla photosynthesis efficiency and growth.
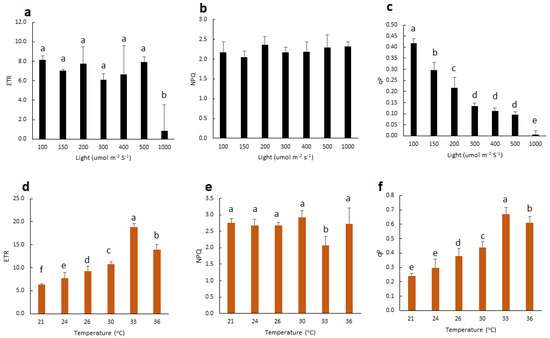
Figure 2. Effect of light intensities and temperatures on the Chl F parameters of ETR, NPQ, and qP. (a–c) Vanilla leaves were exposed to light regimes of 100 to 1000 μmol m−2 s−1. Fluorescence leaf chamber temperature was set at 26 °C. (d–f) Vanilla leaves were exposed to various leaf chamber temperatures, from 21 to 36 °C. Light was irradiated with 150 μmol m−2 s−1. Statistical significance was determined by the ANOVA procedure, followed by Duncan’s multiple range test. The same letter indicates no significant difference between treatments (p < 0.05). Error bars represent the standard error of the mean (n = 3).
4. BL-Acclimation Enhances Vanilla Chlorophyll Fluorescence Capacity
The reduction of photoinhibition of moth orchid induced by blue light acclimation was recently reported [22]. Similar to moth orchid, vanilla orchid is a shade-loving CAM plant that is sensitive to high light. We hypothesized that BL-acclimation might enhance the photoprotection of vanilla orchid. To determine the suitable BL treatment duration for inducing photoacclimation, we treated vanilla orchid with 100 µmole m−2 s−1 blue light (λmax = 450 nm) for 0, 4, 8, or 12 days. To investigate the effect of light intensity on the Chl F capacity of vanilla orchid, we set the fluorescence leaf chamber with light intensities of 150, 500, and 1000 μmol m−2 s−1, respectively, and detected the Chl F parameters. Analysis of variance (ANOVA) statistical analysis indicated that all the Chl F parameters had a significant difference between the various BL-acclimation time courses. It is found that light intensities were significantly different for ETR, NPQ, qP, and qN parameters. There was also a significant difference in BLday × light interaction for the parameters of ETR and qP (Table 1). For the control without BL-acclimation, orchids at the normal light intensity of 150 μmol m−2 s−1 had higher ETR and qP values but a lower amount of NPQ and qN than leaves exposed to high light of 1000 μmol m−2 s−1. When vanilla orchid was BL-acclimated for 4 days and irradiated with 150 μmol m−2 s−1, vanilla leaves had significantly higher ETR and qP than the control without BL-acclimation, but, with this time course, ETR and qP were still low when exposed to 1000 μmol m−2 s−1 (Table 1), implying that BL-treatment for four days does not provide complete acclimation in vanilla orchid. Surprisingly, after BL treatment for 8 days or 12 days, vanilla leaves tended to increase Chl F capacity even when exposed to high light of 1000 μmol m−2 s−1 (Table 1). Clearly, vanilla orchid acquired photoacclimation due to prolonged BL treatment. These data also indicated that the high intensity of 1000 μmol m−2 s−1 had lower Chl F parameters than the low light intensity of 150 μmol m−2 s−1. Moreover, extended BL-acclimation for 8 or 12 days enhanced Chl F capacity under high irradiation (Table 1).
Table 1. Effect of various blue light (BL)-acclimation time courses on Chl F parameters of vanilla orchid.
|
BL day |
Light |
Fv/Fm |
|
ETR |
|
NPQ |
|
qP |
|
qN |
|
|
|
0 day |
150 |
0.74 |
a |
9.50 |
a |
2.05 |
b |
0.32 |
a |
0.81 |
b |
|
|
500 |
0.75 |
a |
7.08 |
ab |
2.59 |
ab |
0.08 |
b |
0.85 |
ab |
||
|
1000 |
0.74 |
a |
5.35 |
b |
2.82 |
a |
0.03 |
b |
0.88 |
a |
||
|
4 day |
150 |
0.74 |
a |
15.75 |
a |
2.50 |
a |
0.60 |
a |
0.86 |
b |
|
|
500 |
0.73 |
a |
16.97 |
a |
3.06 |
a |
0.22 |
b |
0.90 |
a |
||
|
1000 |
0.72 |
a |
7.82 |
b |
3.03 |
a |
0.06 |
c |
0.90 |
a |
||
|
8 day |
150 |
0.70 |
a |
19.62 |
a |
2.13 |
b |
0.65 |
a |
0.81 |
b |
|
|
500 |
0.70 |
a |
16.63 |
a |
3.11 |
a |
0.24 |
b |
0.90 |
a |
||
|
1000 |
0.72 |
a |
16.25 |
a |
3.36 |
a |
0.13 |
c |
0.91 |
a |
||
|
12 day |
150 |
0.71 |
a |
17.02 |
a |
2.53 |
b |
0.64 |
a |
0.85 |
b |
|
|
500 |
0.71 |
a |
16.08 |
a |
3.14 |
ab |
0.23 |
b |
0.90 |
a |
||
|
1000 |
0.68 |
a |
10.32 |
b |
3.30 |
a |
0.08 |
c |
0.92 |
a |
||
|
|
|
df |
|
|
|
|
|
|
|
|
|
|
|
BLday |
3 |
** |
*** |
* |
*** |
*** |
||||||
|
Light |
2 |
n.s. |
*** |
*** |
*** |
*** |
||||||
|
BLday × Light |
6 |
n.s. |
|
* |
|
n.s. |
|
*** |
|
n.s. |
|
|
Statistical significance was determined by the analysis of variance (ANOVA) procedure, followed by Duncan’s multiple range test. Means in the row followed by the same letter indicates no significant difference between treatments (p < 0.05). Each treatment has three replicates. * p < 0.05, ** p < 0.01, *** p < 0.001; n.s., no significant difference at p < 0.05.
5. BL-Acclimation Induces Chloroplast Avoidance and Enhances Growth
We performed BL-acclimation of vanilla orchid at 100 μmol m−2 s−1 for 12 days, and some mild photobleaching symptoms were observed in the young leaves, including L3 (Figure 3a, right panel). SPAD data indicated that BL-acclimated vanilla orchid apparently reduced chlorophyll content (Figure 3d) and caused chloroplast avoidance to the side of the cell (Figure 3c). For the control without BL-acclimation, chloroplasts were distributed randomly in the mesophyll cells (Figure 3b). qRT-PCR data indicated that BL-acclimation significantly upregulated transcripts of blue-light photoreceptors, phot1 and phot2 (Figure 3e). Results of Chl F indicated that BL-acclimation significantly decreased ETR and slightly increased NPQ but with no statistically significant difference at the 5% level (Figure 3f).
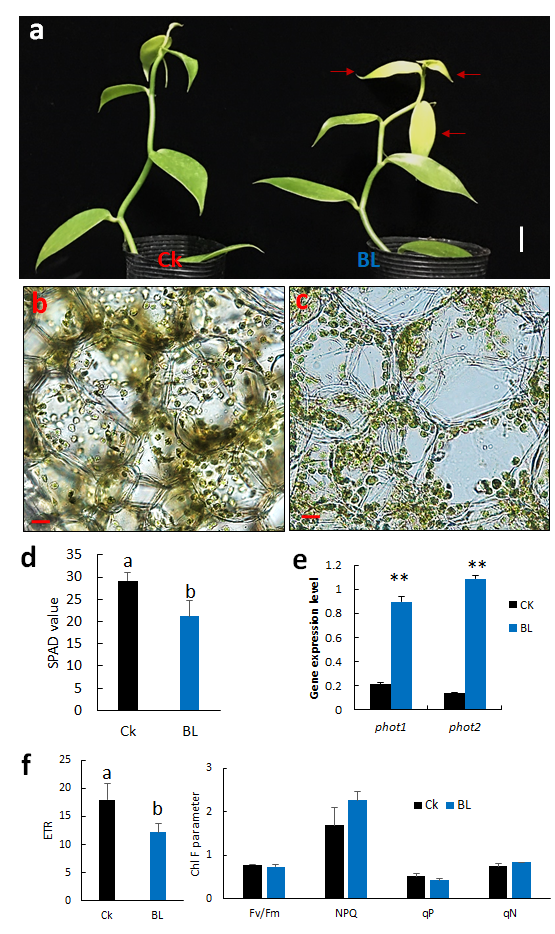
Figure 3. Effect of BL-acclimation on vanilla orchid growth, chloroplast movement, gene expression, and Chl F capacity. (a) BL-acclimation for 12 days (BL) affected vanilla orchid growth. Ck, vanilla grown in a greenhouse without BL pretreatment. BL100 treatment for 12 days showed some signs of photobleaching (right panel). Red arrows indicate the L3 has a photoinhibition phenotype. Bars, 2 cm. Cross-section of the third newly established leaf (L3) showed that chloroplasts were distributed randomly in Ck (b), but chloroplasts moved to the anticlinal (side) walls after BL-acclimation (c). Bars, 20 µm (b,c). (d) BL-acclimation reduced SPAD reading due to chloroplast avoidance. (e) BL-acclimation upregulated the gene expression levels of blue-light photoreceptors, phot1 and phot2. (f) BL-acclimation altered Chl F capacity. ETR, electron transport rate; Fv/Fm, nonphotochemical quenching (NPQ); qP, photochemical quenching of fluorescence; qN, nonphotochemical quenching of fluorescence. Different letters indicate significant differences among treatments at p < 0.05, according to Duncan’s multiple range test (DMRT). Bar, SD of three biological replicates.
6. BL-Acclimation Increases Antioxidant Capacity and Sugar Content
L3 leaf samples of vanilla orchid, with or without BL-acclimation for 12 days, were collected, and then the gene expression pattern, antioxidant enzyme activities, and sugar content were determined. BL-acclimation upregulated SOD and catalase transcript levels (Figure 4a). However, BL-acclimation reduced SOD activity (Figure 4b) but significantly increased catalase activity (Figure 4c). Glucose content was not much changed in L3 after BL-acclimation (Figure 4d), but it contained higher sucrose than the control without BL-acclimation (Figure 4e).
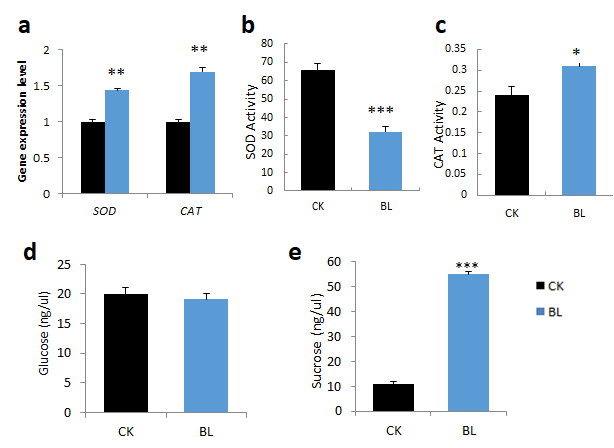
Figure 4. BL-acclimation altered antioxidant transcript expression levels, antioxidant enzyme activities, and sugar content of vanilla orchid. BL-acclimation altered gene expression patterns of SOD and catalase (a), SOD enzyme activity (b), catalase enzyme activity (c), glucose content (d), and sucrose content (e). Significant differences in comparison with the control without BL-acclimation (BL) are indicated with an asterisk. Statistical significance was determined by a one-way analysis of variance (ANOVA), followed by Dunnett’s test. * p < 0.05, ** p < 0.01, *** p < 0.001. Error bars represent the standard error of the mean (n = 3).
7. BL-Acclimation Increases Chl F Capacity and Enhances Growth
Vanilla orchids, with or without BL-acclimation, were exposed to moderately high irradiation (ML500) and high irradiation (HL1000), respectively. After high irradiation for two weeks, vanilla orchid with BL-acclimation had better growth and biomass (Figure 5a,b) and higher chlorophyll content than the control without BL-acclimation (Figure 5c). Therefore, BL-acclimation enhanced vanilla orchid’s acquired photoprotection under high light stress conditions.
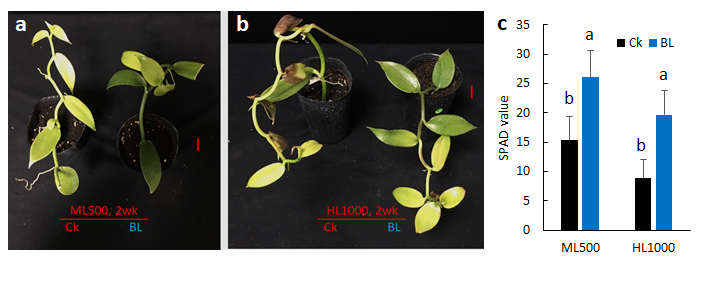
Figure 5. Blue-light acclimation enhanced vanilla orchid growth after exposure to high irradiation. (a) Vanilla exposed to moderately high irradiation of 500 μmol m−2 s−1 (ML500). (b) Vanilla exposed to high irradiation of 1000 μmol m−2 s−1 (HL1000). BL, plant after BL-acclimation (BL-Ac) for 12 days. Red scale bars, 2 cm (a,b). Growth chamber temperature was at a constant 26 °C, 12 h photoperiod. (c) SPAD reading of vanilla orchid L3 after exposure to high irradiations of ML and HL for two weeks. Different letters indicate significant differences among treatments at p < 0.05, according to Duncan’s multiple range test (DMRT).
References
- Fouche, J.G.; Jouve, L. Vanilla planifolia: History, botany and culture in Reunion island. Agronomie 1999, 19, 689–703, doi:10.1051/agro:19990804.
- Bory, S.; Grisoni, M.; Duval, M.-F.; Besse, P. Biodiversity and preservation of vanilla: Present state of knowledge. Resour. Crop Evol. 2007, 55, 551–571, doi:10.1007/s10722-007-9260-3.
- Barrow, S.R.; Cockburn, W. Effects of light quantity and quality on the decarboxylation of malic Acid in crassulacean Acid metabolism photosynthesis. Plant Physiol. 1982, 69, 568–571, doi:10.1104/pp.69.3.568.
- Havkin-Frenkel, D.; Belanger, F.C. Handbook of Vanilla Science and Technology, 2nd ed.; Wiley-Blackwell: Chichester, UK,
- Díez, M.C.; Moreno, F.; Gantiva, E. Effects of light intensity on the morphology and CAM photosynthesis of Vanilla planifolia Andrews. Fac. Nac. Agron. 2017, 70, 8023–8033, doi:10.15446/rfna.v70n1.61736.
- Johnson, M.P. Photosynthesis. Essays Biochem. 2016, 60, 255–273, doi:10.1042/EBC20160016.
- Scheller, H.V.; Haldrup, A. Photoinhibition of photosystem I. Planta 2005, 221, 5–8, doi:10.1007/s00425-005-1507-7.
- Bhattacharjee, S. ROS and Regulation of Photosynthesis. In Reactive Oxygen Species in Plant Biology; Springer India: New Delhi, India, 2019; pp. 107–125, doi:10.1007/978-81-322-3941-3_5.
- Li, Z.; Wakao, S.; Fischer, B.B.; Niyogi, K.K. Sensing and responding to excess light. Rev. Plant Biol. 2009, 60, 239–260, doi:10.1146/annurev.arplant.58.032806.103844.
- Kong, S.G.; Wada, M. Molecular basis of chloroplast photorelocation movement. Plant Res. 2016, 129, 159–166, doi:10.1007/s10265-016-0788-1.
- Krzeszowiec, W.; Novokreshchenova, M.; Gabryś, H. Chloroplasts in C3 grasses move in response to blue-light. Plant Cell Rep. 2020, doi:10.1007/s00299-020-02567-3.
- Lin, Y.J.; Chen, Y.C.; Tseng, K.C.; Chang, W.C.; Ko, S.S. Phototropins mediate chloroplast movement in Phalaenopsis aphrodite (moth orchid). Plant Cell Physiol. 2019, 60, 2243–2254, doi:10.1093/pcp/pcz116.
- Murchie, E.H.; Niyogi, K.K. Manipulation of photoprotection to improve plant photosynthesis. Plant Physiol. 2011, 155, 86–92, doi:10.1104/pp.110.168831.
- Ruban, A.V. Nonphotochemical Chlorophyll Fluorescence Quenching: Mechanism and Effectiveness in Protecting Plants from Photodamage. Plant Physiol. 2016, 170, 1903–1916, doi:10.1104/pp.15.01935.
- Li, L.; Aro, E.M.; Millar, A.H. Mechanisms of Photodamage and Protein Turnover in Photoinhibition. Trends Plant Sci. 2018, 23, 667–676, doi:10.1016/j.tplants.2018.05.004.
- Chen, J.H.; Chen, S.T.; He, N.Y.; Wang, Q.L.; Zhao, Y.; Gao, W.; Guo, F.Q. Nuclear-encoded synthesis of the D1 subunit of photosystem II increases photosynthetic efficiency and crop yield. Plants 2020, doi:10.1038/s41477-020-0629-z.
- Simkin, A.J.; McAusland, L.; Lawson, T.; Raines, C.A. Overexpression of the RieskeFeS Protein Increases Electron Transport Rates and Biomass Yield. Plant Physiol. 2017, 175, 134–145, doi:10.1104/pp.17.00622.
- Ermakova, M.; Lopez-Calcagno, P.E.; Raines, C.A.; Furbank, R.T.; von Caemmerer, S. Overexpression of the Rieske FeS protein of the Cytochrome b 6 f complex increases C4 photosynthesis in Setaria viridis. Biol. 2019, 2, 314, doi:10.1038/s42003-019-0561-9.
- Simkin, A.J.; López-Calcagno, P.E.; Raines, C.A. Feeding the world: Improving photosynthetic efficiency for sustainable crop production. Exp. Bot. 2019, 70, 1119–1140, doi:10.1093/jxb/ery445.
- Simkin, A.J. Genetic Engineering for Global Food Security: Photosynthesis and Biofortification. Plants 2019, 8, 586, doi:10.3390/plants8120586.
- Gupta, S.; Dong, Y.; Dijkwel, P.P.; Mueller-Roeber, B.; Gechev, T.S. Genome-Wide Analysis of ROS Antioxidant Genes in Resurrection Species Suggest an Involvement of Distinct ROS Detoxification Systems during Desiccation. J. Mol. Sci. 2019, 20, 3101, doi:10.3390/ijms20123101.


