Submitted Successfully!
To reward your contribution, here is a gift for you: A free trial for our video production service.
Thank you for your contribution! You can also upload a video entry or images related to this topic.
Version Summary Created by Modification Content Size Created at Operation
1 -- 3139 2022-10-17 18:06:03 |
2 format correct + 9 word(s) 3148 2022-10-18 07:19:27 | |
3 format correct Meta information modification 3148 2022-10-18 07:21:42 | |
4 layout Meta information modification 3148 2022-10-18 07:22:39 |

Video Upload Options

Do you have a full video?

Confirm

Are you sure to Delete?
Cite
If you have any further questions, please contact Encyclopedia Editorial Office.
Hérault, L.;  Poplineau, M.;  Remy, E.;  Duprez, E. Single Cell Transcriptomics to Understand Hematopoietic Stem Cells. Encyclopedia. Available online: https://encyclopedia.pub/entry/29721 (accessed on 18 September 2024).
Hérault L,  Poplineau M,  Remy E,  Duprez E. Single Cell Transcriptomics to Understand Hematopoietic Stem Cells. Encyclopedia. Available at: https://encyclopedia.pub/entry/29721. Accessed September 18, 2024.
Hérault, Léonard, Mathilde Poplineau, Elisabeth Remy, Estelle Duprez. "Single Cell Transcriptomics to Understand Hematopoietic Stem Cells" Encyclopedia, https://encyclopedia.pub/entry/29721 (accessed September 18, 2024).
Hérault, L.,  Poplineau, M.,  Remy, E., & Duprez, E. (2022, October 17). Single Cell Transcriptomics to Understand Hematopoietic Stem Cells. In Encyclopedia. https://encyclopedia.pub/entry/29721
Hérault, Léonard, et al. "Single Cell Transcriptomics to Understand Hematopoietic Stem Cells." Encyclopedia. Web. 17 October, 2022.
Single Cell Transcriptomics to Understand Hematopoietic Stem Cells
Edit

Aging leads to a decline in the functions of the hematopoietic and immune system, which in the elderly results in an increased risk of infection, poor vaccination efficacy, anemia and blood cancers. It is now well established that age-related dysfunction of the entire hematopoietic system originates from hematopoietic stem cells (HSCs), which lose their fitness over time. Single-cell transcriptomic technologies enable the uncovering and characterization of cellular heterogeneity and pave the way for studies aiming at understanding the origin and consequences of it. The hematopoietic system is in essence a very well adapted model system to benefit from this technological advance because it is characterized by different cellular states. Each cellular state, and its interconnection, may be defined by a specific location in the global transcriptional landscape sustained by a complex regulatory network. This transcriptomic signature is not fixed and evolved over time to give rise to less efficient hematopoietic stem cells (HSC), leading to a well-documented hematopoietic aging. 

single cell transcriptomic HSC Aging

1. Understanding Hematopoietic Stem Cell Heterogeneity to Grasp Aged  Hematopoietic Stem Cell  Deregulations

The very large number of scRNA-seq studies carried out over the last ten years has greatly increased people's knowledge of different biological processes, particularly in the context of hematopoiesis. The interest of laboratories working on  hematopoietic stem cells (HSCs) for scRNA-seq approaches is explained by the need to understand, at the molecular level, the heterogeneity of HSCs and its impact on their progeny. It is now admitted that each individual HSC, although sharing the same cell surface marker combination, differs in terms of functional outputs and molecular signatures [1][2]. The numerous recent scRNA-seq studies, which have been enriched with the increase in the number of cells sequenced, have challenged the traditional, hierarchical view of hematopoiesis and have led to the reconsideration of blood cell relationships and the routes by which lineage differentiation occurs [3]. It became evident that hematopoiesis is a continuous differentiation model with a lack of clear delineation between the different subtypes of murine HSCs [4][5] and with the identification of an early lineage priming in subsets of HSCs [6][7]. The continuum of differentiation in the HSC population has also been demonstrated in humans, where the transcriptomes of the HSC and MPP (CD34+ cells) compartment were found to be very similar, suggesting a cloud of HSCs differentiating directly into unipotent progenitors [8][9]. This model has been related to Waddington’s landscapes of cell differentiation in which the differentiation of a cell is represented by a bead going down a hill into diverging valleys, each of which ultimately leads to a different cell type [10][11].
The value of using scRNA-seq to identify and characterize rare populations has been demonstrated in studies seeking to understand the cellular and mechanistic evolution of HSC during aging. The transcriptomic analyses at the single cell level have particularly been useful to clarify the origin of the myeloid bias found in aged HSCs. Although a first study demonstrated a cell autonomous impaired lymphoid differentiation potential of aged MPP4 pinpointing the cellular compartment responsible for lymphoid cell loss with aging [12], most of the following studies suggested a gain in myeloid differentiation potential of aged HSCs. This gain was mainly due to an expansion of identified platelet-primed or megakaryocyte-primed HSCs [6][13]. In line with the increase in myeloid potential observed in old HSCs, several studies demonstrated an expansion with age of HSCs primed to respond to an inflammatory stimulus. Three studies highlighted a clear subpopulation of HSCs primed for interferon stimulus that were prepared to strongly respond to future stress or injuries that are expanded with aging [6][14][15]. In addition, a new group of MPPs has been described [16], which ultimately resembles from a transcriptomic point of view the group of interferon-primed progenitors described in [6][15]. This specific age-related amplification of LTHSCs with mis-regulated interferon signaling is consistent with the concept of inflammaging [17]. Another interesting HSC group, amplified during aging, is the cluster of LTHSCs presenting a TGF signature [6] that may correspond to accumulation of HSC subtypes with differential responses to the TGF that was previously identified [18].
The accumulation of non-functional HSCs during aging has also been extensively studied and is thought to be related to the history of HSC cycling activity and an imbalance between self-renewal and the initiation of HSC differentiation [19]. Concerning the regulation of the balance between population maintenance and differentiation, a study based on scRNA-seq suggested an increase in self-renewal, which would be linked to a shortening of the G1 phase of the cell cycle [20]. However, another study showed that the accumulation of non-functional aged HSCs, seemed to originate rather from a blockage of the differentiation of quiescent-aged HSCs biased towards the myeloid lineage [6]. The latter study also showed an increase in the TGF signature in these cells, suggesting a role for TGF signaling in the accumulation of aged HSCs. In parallel, another study explained the accumulation of the aged HSC population by the activation of the JAK-STAT pathway and p53 [21]. Interestingly, these two studies agreed on the markers of this aged HSC population that shared the same key genes (Hes1KLF factors, JunBNr4a1Cdkn1a). EGR1 was found to be upregulated in aged human hematopoietic stem cells, independent of cell cycle phase progression, but was associated with loss of CDK6 and CCND2 during S phase, which would disrupt HSC cell cycle [22]. These studies converge to show an accumulation of cells with several quiescent markers, such as Nr4a1, Junb, and Cdkn1a, which are compatible with observations on the quiescent state of HSCs [23][24]. They are also consistent with the distinction between quiescent and active HSCs and with the role of retinoic acid signaling in maintaining the hypoxic dormant state [25][26]. In addition, a study that implies an important role for Cdc42 activity/polarity in HSCs for driving the symmetric/asymmetric mode of division revealed that the frequency of polar HSCs decreases upon aging, which results in more symmetric divisions with daughter stem cells, with impaired potential [27].
It is important to note that all of the studies discussed above only partially overlap, with some features of aging not replicated across studies. One source of discrepancy may lie in how and when they handle cell cycle bias in their analysis. Indeed, the cell cycle induces variations in the whole transcriptome, confounding signals of interest, such as cell differentiation [28]. Thus, young and aged HSC/MPP heterogeneity in term of priming for specific lineage seems to be better resolved with a regression of cell-cycle effect before dimension reduction [6] than without [14][20]. The partial overlap between studies could also very well be a consequence of heterogeneous aging capture, consistent with the theory of clonal hematopoiesis, which shows that competitive clones emerge and amplify at the expense of others during an individual’s lifetime [29]. One way forward would be the construction of a large single-cell atlas collecting hundreds or even millions of thousands or even millions of cells to provide an in-depth phenotypic description of biological tissues across a wide range of pathological conditions, similar to the human cell atlas [30] or the tumor infiltrating lymphocytes atlas using samples from hundreds of donors [31].

2. Coupling the Transcriptome to the Cell Fate

An important issue is to capture the temporal dynamics of the cell population by evaluating the future state of an individual cell. One strategy is to use RNA velocity analysis, which is based on calculating the time derivative of the gene expression state by distinguishing newly transcribed (spliced) mRNAs from mature (unspliced) mRNAs by the presence of introns. The combination of velocities between genes is then extrapolated to estimate the future state of each cell in transcriptome space [32][33]. Although promising, this bioinformatics approach seems poorly suited to the study of hematopoietic cells in which changes in mRNA processing and stability may be key factors in HSC activation [34]. This is observed experimentally by a boost in RNA transcription that induces unexpected and probably erroneous projections of future cell states due to biased velocity estimates [35].
To address the challenge of correctly inferring the cell differentiation trajectory, the best strategy seems to combine scRNA-seq with other single-cell omics technologies and/or lineage tracing approaches [36].
Lineage tracing methods have proven effective in understanding the heterogeneity of the initial HSC population, as well as the clonal relationships between individual HSCs and their progeny [36]. These methods are based on a library of DNA barcodes expressed within a transgene that are stably integrated into the genomes of the HSCs under study. The offspring after multiple divisions of a particular HSC, thus, inherits its own barcode, allowing the assessment of transcriptional changes and functional potential of each cell in the same experiment. In this way, it is possible to trace the progeny of a HSC in an inferred pseudo differentiation trajectory and present an unbiased view of differentiation. Altogether, lineage tracing studies interestingly showed that rather few mature cells had integrated barcodes at the HSC level (apart from the megakaryocytic lineage), suggesting that MPPs rather than HSCs were the main contributors to undisturbed hematopoiesis (reviewed in [37]). When coupled with scRNA-seq, they appeared to be the right way to follow the fate of a given HSC in relation to its transcriptomic signature and have deepened researchers' understanding of HSC differentiation potential. They confirmed the early priming of HSCs to different lineages under physiological conditions [7][38]. They additionally showed, using computational methods of dynamic inference that fate choice occurs earlier than detected by the algorithms and that cells progress smoothly in the differentiation with precise and consistent dynamics [38]. These results were later strengthened by the addition of CRISPR-seq to lineage tracing and scRNA-seq, which clarified that the HSC subpopulation with high self-renewal potential contributed very little to hematopoiesis [39]. Single-cell epigenomic approaches could also be useful in determining the fate of an HSC. This hypothesis is supported by a HSC lineage tracing study, combined with extensive transcriptomic and epigenomic analyses, which demonstrated that epigenetic features, in contrast to the transcriptome, are consistently correlated with the cell fate [40]. Altogether, these approaches reveal the limits of using scRNA-seq alone to distinguish functionally heterogeneous HSC states and emphasized that transcriptionally similar cells can have cell-autonomous bias toward different fate choices [37].

3. Network-Based Dynamic Modeling: A Successful Approach to Decipher Hematopoiesis

As discussed above, the HSC fate is driven by complex interaction networks involving signaling, transcriptional and also epigenetic regulations. To decipher such large and complex biological networks and to cope with and take advantage of multiple layers of information, explanatory and predictive mathematical models are beneficial.
Because of the ease of collecting blood or bone marrow samples, which facilitated data generation, the hematopoietic system was early on the subject of mathematical modeling studies [41]. Initially, studies at the level of the production of the different blood cell populations and their interactions were modeled using differential equations [42][43][44]. However, this mathematical formalism requires precise parameters, such as reaction constants or other initial conditions that are important because the behavior of the system can be very sensitive to them, but their knowledge is often limited or incomplete.
Qualitative approaches are more suitable to model gene regulatory networks and decipher their biological complexity [45]. More economical in parameters, they gain in flexibility by allowing the variables to represent different biological realities (activation of a gene or phosphorylation of a protein for example). Logical models are therefore much more abstract and qualitative representations of biological systems than models based on systems of differential equations [46]. They have demonstrated their effectiveness in a variety of biological systems [47], such as the regulation of the cellular response to DNA damage [48] or the combinatorial effect of mutations in tumorigenesis [49]. The emergence of next generation sequencing and the amount of data generated have facilitated the study of molecular regulatory networks helping the construction of numerous logical models, among others related to hematopoiesis. These models have been useful in understanding regulatory events in hematopoiesis, such as those focused on T cell differentiation [50][51] and their activation [52], which have contributed to the understanding of cancer resistance to immunotherapies [53].
Logical models have been particularly helpful to describe the dynamical behavior and differentiation of the progenitor and stem cell compartment. A logical model of differentiation starting from the CMP toward erythrocytic, megakaryocytic, granulocytic and monocytic lineages recapitulated the differentiation hierarchy characterized by the presence of an initial branching between granulocyte-monocyte progenitor (GMP) and megakaryocytes-erythrocyte progenitor (MEP) [54]. Further upstream in hematopoiesis, a logical model of HSPC regulation was established, presenting a stability in the dynamics that reflects the heterogeneity of the hematopoietic stem and progenitor cell (HSPC) population at different stages of activation, observed in single cell expression data [55]. The analysis of the model showed that some transient external activations allow the modelled system to escape from this stability zone and reach a differentiated state (for example, the activation of GATA1 allowed system to reach an erythroid state). Another model described a differentiation pathway starting from MPP states and reaching two stable states, corresponding to lymphoid and myeloid progenitors [56]. Interestingly, stimulations of the model with cytokines suggested a possible reprogramming of pre-B cells into macrophages by transient activation of CEBPA [56]. These studies demonstrated that in addition to providing a global mechanistic vision of the observed phenomena (progenitor differentiation), the construction and analysis of logic models also allow the prediction of new local regulations and additional mechanisms.
Logical modeling has also been very useful to understand the effect of extrinsic signals on HSC behavior. This can involve modeling the interaction between two types of cells. For example, a logical model of the dialogue between HSCs and mesenchymal stromal cells (MSCs) revealed attractors representing states of the system where HSC and MSC are attached and detached, respectively. The model highlighted the role of aberrant NF-kB expression in the creation of a tumor microenvironment [57]. Another recent model of a molecular regulatory network governing HSC quiescence and activation has been elaborated [58]. In the model, synchronous simulations provided stable LTHSC, STHSC, and proliferating HSC states, depending on a combination of niche signals that promoted quiescence or cell cycle activation. This model uncovered a novel regulatory mechanism of p53 in homeostasis, involving ROS- and RAS-activated TF regulators [58]. Such qualitative analysis of the dynamics opens up interesting avenues for studying age-related extrinsic deregulations of HSCs and the key players that control the resulting changes.

4. Single Cell Data and Boolean Networks Inference to Understand  Hematopoietic Stem Cell Aging

One of the current challenges is to adapt mathematical methods to single cell data in order to integrate as much information as possible extracted from the data into the Boolean model. This relies on inference methods, which have a two-fold purpose: the construction of the influence graph and the characterization of the Boolean parameters (Figure 1). This involves reverse engineering approaches.
Figure 1. Boolean Network inference. Workflow of Boolean network inference from scRNA-seq data. (a) scRNA-seq data can be used to infer transcriptional interactions between TFs and complement influence graph constructed from prior knowledge of the searched BN. (b) The pseudo trajectories issued from the scRNA-seq data, can be discretized and translated in discrete observations of the searched BN. (c) Given these inputs, constraint programming can be used to infer the logical rules of the BN.

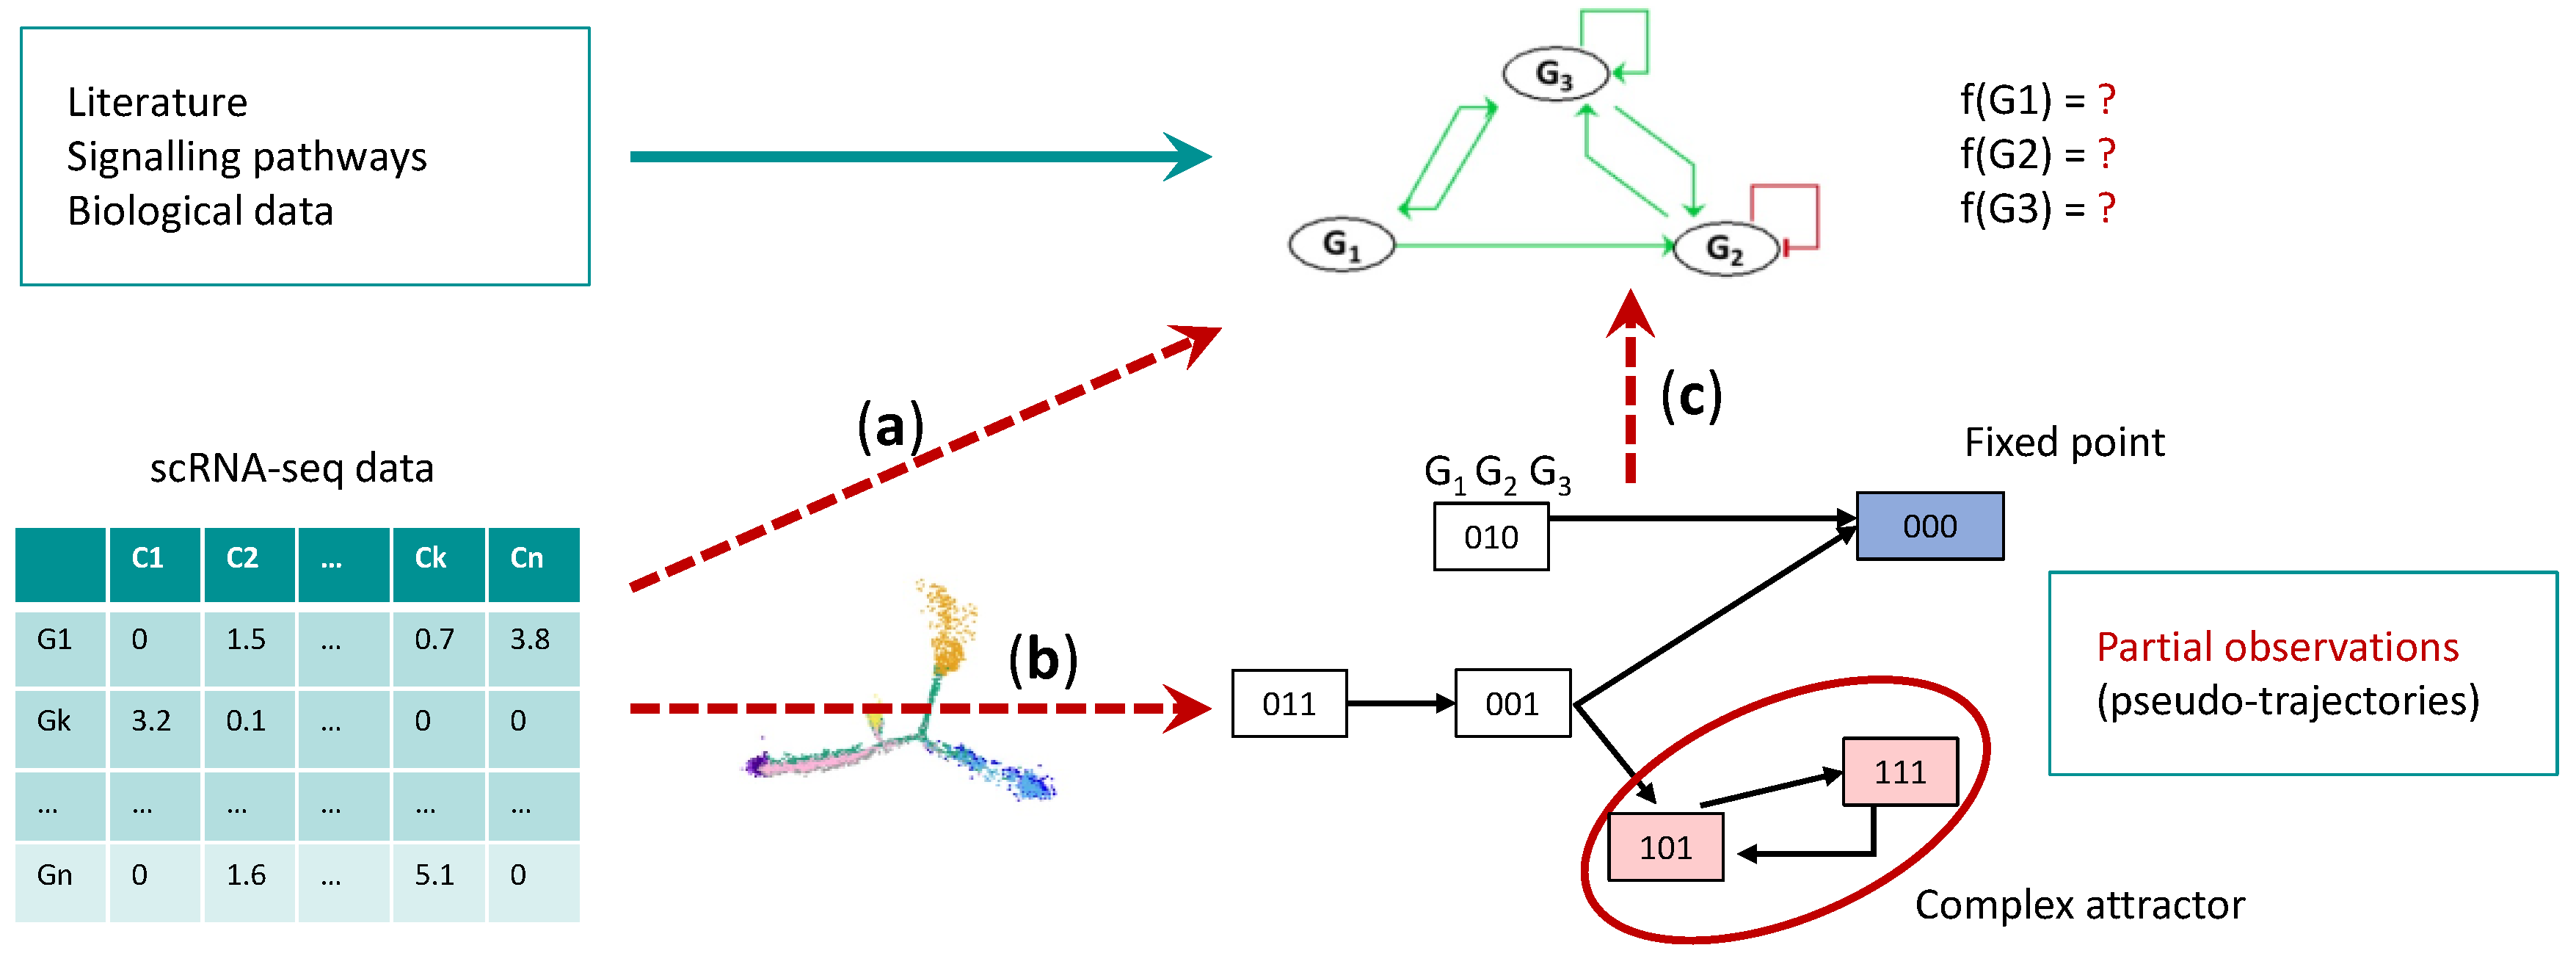
4.1. Gene Regulatory Network Inference

The issue of inferring the molecular interaction network underlying the biological process has been addressed in the past from bulk expression data [59]. Nowadays, the amount of information provided by single-cell data has greatly improved the quality of inferring interactions between biological components of these networks, most notably for regulations between TFs and their target genes based on expression dependencies observed in the data. Numerous mathematical methods have been proposed for this purpose [60] and evaluated [61], relying on regression approaches [62][63], expression correlations [64] and information theory [65][66]. These approaches can be used to infer TF influence graph from single cell data and complement prior knowledge of gene regulatory network of the modelled biological system (Figure 1a). Inference of influence graphs from scRNA-seq data is clearly improved by adding additional levels of information, such as epigenetics and genomics. Epigenetic data from ChIP-seq experiments of TFs and histone marks, as well as ATAC-seq, have identified regulatory regions with DNA binding motifs for hundreds of TFs. These motifs were used to identify sets of genes coregulated by the same TF [67]. This strategy has been developed by an application, SCENIC, which searches for motif enrichments in the regulatory regions of a TF’s target genes by regression trees [68]. The combination of chromatin landscape, transcriptome, and other omics analyses at the single-cell level promises new developments in methods for inferring contextualized and accurate influence graphs of transcriptional interactions [60]. For example, scATAC-seq data have been used to link DNA regulatory elements to their potential target genes to reconstruct TF networks [69].

4.2. Boolean Network Inference

Mathematical models present the specificity of integrating the dynamics with the influence networks, thus enabling a better understanding of how the network of regulations gives rise to the global observed behavior. Model inference, therefore, requires the determination of the dynamical parameters, consistent with the influence graph. In the case of Boolean networks (BNs), this consists in inferring, for each node of the influence graph, a logical rule describing the changes of its state according to the state of its regulators. The trajectories of the global system will be defined from this set of logical rules. The pseudo-trajectories constructed from the scRNA-seq data can be interpreted as observations of some trajectories generated by a BN (Figure 1b). The challenge is then to find the logical rules from these “partial dynamics” that are sets of transitions between states observed in the data (Figure 1c). Several methods have been proposed to address this inference problem thanks to constraint programming, model checking and the introduction of novel semantics [70][71][72][73]. In practice, BN inference from scRNA-seq data have been successfully implemented to define a BN of embryonic hematopoietic development in humans [70], as well as a BN of HSC differentiation into MPP and MEP configurations [73].
Incorporation of new information from scRNA-seq into BN inference has necessitated, and thus enabled, the emergence of new analysis methods that are proving interesting and effective in capturing physiological changes, such as aging. Hence, Boolean models of aging have started to emerge. Schwab et al. [74] proposed an original analysis of single cell data exploiting population heterogeneity to sample time series data, from which sets of Boolean models were inferred. Then, by studying some topological properties, their analysis captured the dynamical heterogeneity, occurring with HSCs aging. Hérault et al. [75] presented an original inference methodology to construct a Boolean model allowing a better understanding of the mechanisms and factors controlling the effects of aging on HSCs. They developed an inference strategy that consists in a specific combination of different methods ranging from transcriptional regulation analysis for influence graph inference to constraint programming [71] and model checking techniques for logical rule inference. They succeeded in obtaining a Boolean model which agrees with most prior experimental observations of HSC biology. They provided expected and new predictions that could explain the myeloid bias in aged HSC differentiation, including the overactivation of Egr1 and Junb or/and the loss of Cebpa activation by Gata2 [75].

References

  1. Haas, S.; Trumpp, A.; Milsom, M.D. Causes and Consequences of Hematopoietic Stem Cell Heterogeneity. Cell Stem Cell 2018, 22, 627–638.
  2. Zhang, Y.; Gao, S.; Xia, J.; Liu, F. Hematopoietic Hierarchy—An Updated Roadmap. Trends Cell Biol. 2018, 28, 976–986.
  3. Laurenti, E.; Gottgens, B. From haematopoietic stem cells to complex differentiation landscapes. Nature 2018, 553, 418–426.
  4. Nestorowa, S.; Hamey, F.K.; Pijuan Sala, B.; Diamanti, E.; Shepherd, M.; Laurenti, E.; Wilson, N.K.; Kent, D.G.; Gottgens, B. A single-cell resolution map of mouse hematopoietic stem and progenitor cell differentiation. Blood 2016, 128, e20–e31.
  5. Herman, J.S.; Sagar; Grun, D. FateID infers cell fate bias in multipotent progenitors from single-cell RNA-seq data. Nat. Methods 2018, 15, 379–386.
  6. Herault, L.; Poplineau, M.; Mazuel, A.; Platet, N.; Remy, E.; Duprez, E. Single-cell RNA-seq reveals a concomitant delay in differentiation and cell cycle of aged hematopoietic stem cells. BMC Biol. 2021, 19, 19.
  7. Rodriguez-Fraticelli, A.E.; Wolock, S.L.; Weinreb, C.S.; Panero, R.; Patel, S.H.; Jankovic, M.; Sun, J.; Calogero, R.A.; Klein, A.M.; Camargo, F.D. Clonal analysis of lineage fate in native haematopoiesis. Nature 2018, 553, 212–216.
  8. Notta, F.; Zandi, S.; Takayama, N.; Dobson, S.; Gan, O.I.; Wilson, G.; Kaufmann, K.B.; McLeod, J.; Laurenti, E.; Dunant, C.F.; et al. Distinct routes of lineage development reshape the human blood hierarchy across ontogeny. Science 2016, 351, aab2116.
  9. Velten, L.; Haas, S.F.; Raffel, S.; Blaszkiewicz, S.; Islam, S.; Hennig, B.P.; Hirche, C.; Lutz, C.; Buss, E.C.; Nowak, D.; et al. Human haematopoietic stem cell lineage commitment is a continuous process. Nat. Cell Biol. 2017, 19, 271–281.
  10. Waddington, C.H.; Kacser, H. The Strategy of the Genes: A Discussion of Some Aspects of Theoretical Biology; Allen & Unwin: Crows Nest, Australia, 1957; pp. 42–46.
  11. Buenrostro, J.D.; Corces, M.R.; Lareau, C.A.; Wu, B.; Schep, A.N.; Aryee, M.J.; Majeti, R.; Chang, H.Y.; Greenleaf, W.J. Integrated Single-Cell Analysis Maps the Continuous Regulatory Landscape of Human Hematopoietic Differentiation. Cell 2018, 173, 1535–1548.e16.
  12. Young, K.; Borikar, S.; Bell, R.; Kuffler, L.; Philip, V.; Trowbridge, J.J. Progressive alterations in multipotent hematopoietic progenitors underlie lymphoid cell loss in aging. J. Exp. Med. 2016, 213, 2259–2267.
  13. Grover, A.; Sanjuan-Pla, A.; Thongjuea, S.; Carrelha, J.; Giustacchini, A.; Gambardella, A.; Macaulay, I.; Mancini, E.; Luis, T.C.; Mead, A.; et al. Single-cell RNA sequencing reveals molecular and functional platelet bias of aged haematopoietic stem cells. Nat. Commun. 2016, 7, 11075.
  14. Mann, M.; Mehta, A.; de Boer, C.G.; Kowalczyk, M.S.; Lee, K.; Haldeman, P.; Rogel, N.; Knecht, A.R.; Farouq, D.; Regev, A.; et al. Heterogeneous Responses of Hematopoietic Stem Cells to Inflammatory Stimuli Are Altered with Age. Cell Rep. 2018, 25, 2992–3005.e5.
  15. Fast, E.M.; Sporrij, A.; Manning, M.; Rocha, E.L.; Yang, S.; Zhou, Y.; Guo, J.; Baryawno, N.; Barkas, N.; Scadden, D.; et al. External signals regulate continuous transcriptional states in hematopoietic stem cells. eLife 2021, 10, e66512.
  16. Sommerkamp, P.; Romero-Mulero, M.C.; Narr, A.; Ladel, L.; Hustin, L.; Schonberger, K.; Renders, S.; Altamura, S.; Zeisberger, P.; Jacklein, K.; et al. Mouse multipotent progenitor 5 cells are located at the interphase between hematopoietic stem and progenitor cells. Blood 2021, 137, 3218–3224.
  17. Xia, S.; Zhang, X.; Zheng, S.; Khanabdali, R.; Kalionis, B.; Wu, J.; Wan, W.; Tai, X. An Update on Inflamm-Aging: Mechanisms, Prevention, and Treatment. J. Immunol. Res. 2016, 2016, 8426874.
  18. Challen, G.A.; Boles, N.C.; Chambers, S.M.; Goodell, M.A. Distinct hematopoietic stem cell subtypes are differentially regulated by TGF-beta1. Cell Stem Cell 2010, 6, 265–278.
  19. Qiu, J.; Papatsenko, D.; Niu, X.; Schaniel, C.; Moore, K. Divisional history and hematopoietic stem cell function during homeostasis. Stem Cell Rep. 2014, 2, 473–490.
  20. Kowalczyk, M.S.; Tirosh, I.; Heckl, D.; Rao, T.N.; Dixit, A.; Haas, B.J.; Schneider, R.K.; Wagers, A.J.; Ebert, B.L.; Regev, A. Single-cell RNA-seq reveals changes in cell cycle and differentiation programs upon aging of hematopoietic stem cells. Genome Res. 2015, 25, 1860–1872.
  21. Kirschner, K.; Chandra, T.; Kiselev, V.; Flores-Santa Cruz, D.; Macaulay, I.C.; Park, H.J.; Li, J.; Kent, D.G.; Kumar, R.; Pask, D.C.; et al. Proliferation Drives Aging-Related Functional Decline in a Subpopulation of the Hematopoietic Stem Cell Compartment. Cell Rep. 2017, 19, 1503–1511.
  22. Desterke, C.; Bennaceur-Griscelli, A.; Turhan, A.G. EGR1 dysregulation defines an inflammatory and leukemic program in cell trajectory of human-aged hematopoietic stem cells (HSC). Stem Cell Res. Ther. 2021, 12, 419.
  23. Passegue, E.; Wagner, E.F.; Weissman, I.L. JunB deficiency leads to a myeloproliferative disorder arising from hematopoietic stem cells. Cell 2004, 119, 431–443.
  24. Santaguida, M.; Schepers, K.; King, B.; Sabnis, A.J.; Forsberg, E.C.; Attema, J.L.; Braun, B.S.; Passegue, E. JunB protects against myeloid malignancies by limiting hematopoietic stem cell proliferation and differentiation without affecting self-renewal. Cancer Cell 2009, 15, 341–352.
  25. Cabezas-Wallscheid, N.; Buettner, F.; Sommerkamp, P.; Klimmeck, D.; Ladel, L.; Thalheimer, F.B.; Pastor-Flores, D.; Roma, L.P.; Renders, S.; Zeisberger, P.; et al. Vitamin A-Retinoic Acid Signaling Regulates Hematopoietic Stem Cell Dormancy. Cell 2017, 169, 807–823.e19.
  26. Lauridsen, F.K.B.; Jensen, T.L.; Rapin, N.; Aslan, D.; Wilhelmson, A.S.; Pundhir, S.; Rehn, M.; Paul, F.; Giladi, A.; Hasemann, M.S.; et al. Differences in Cell Cycle Status Underlie Transcriptional Heterogeneity in the HSC Compartment. Cell Rep. 2018, 24, 766–780.
  27. Florian, M.C.; Klose, M.; Sacma, M.; Jablanovic, J.; Knudson, L.; Nattamai, K.J.; Marka, G.; Vollmer, A.; Soller, K.; Sakk, V.; et al. Aging alters the epigenetic asymmetry of HSC division. PLoS Biol. 2018, 16, e2003389.
  28. Buettner, F.; Natarajan, K.N.; Casale, F.P.; Proserpio, V.; Scialdone, A.; Theis, F.J.; Teichmann, S.A.; Marioni, J.C.; Stegle, O. Computational analysis of cell-to-cell heterogeneity in single-cell RNA-sequencing data reveals hidden subpopulations of cells. Nat. Biotechnol. 2015, 33, 155–160.
  29. Jaiswal, S.; Ebert, B.L. Clonal hematopoiesis in human aging and disease. Science 2019, 366, eaan4673.
  30. Regev, A.; Teichmann, S.A.; Lander, E.S.; Amit, I.; Benoist, C.; Birney, E.; Bodenmiller, B.; Campbell, P.; Carninci, P.; Clatworthy, M.; et al. The Human Cell Atlas. eLife 2017, 6, e27041.
  31. Zheng, L.; Qin, S.; Si, W.; Wang, A.; Xing, B.; Gao, R.; Ren, X.; Wang, L.; Wu, X.; Zhang, J.; et al. Pan-cancer single-cell landscape of tumor-infiltrating T cells. Science 2021, 374, abe6474.
  32. La Manno, G.; Soldatov, R.; Zeisel, A.; Braun, E.; Hochgerner, H.; Petukhov, V.; Lidschreiber, K.; Kastriti, M.E.; Lonnerberg, P.; Furlan, A.; et al. RNA velocity of single cells. Nature 2018, 560, 494–498.
  33. Bergen, V.; Lange, M.; Peidli, S.; Wolf, F.A.; Theis, F.J. Generalizing RNA velocity to transient cell states through dynamical modeling. Nat. Biotechnol. 2020, 38, 1408–1414.
  34. Bowman, T.V.; McCooey, A.J.; Merchant, A.A.; Ramos, C.A.; Fonseca, P.; Poindexter, A.; Bradfute, S.B.; Oliveira, D.M.; Green, R.; Zheng, Y.; et al. Differential mRNA processing in hematopoietic stem cells. Stem Cells 2006, 24, 662–670.
  35. Bergen, V.; Soldatov, R.A.; Kharchenko, P.V.; Theis, F.J. RNA velocity-current challenges and future perspectives. Mol. Syst. Biol. 2021, 17, e10282.
  36. Tak, T.; Eisele, A.S.; Perie, L. In Vivo Tracking of Hematopoietic Stem and Progenitor Cell Ontogeny by Cellular Barcoding. Methods Mol. Biol. 2021, 2308, 281–300.
  37. Rodriguez-Fraticelli, A.E.; Camargo, F. Systems analysis of hematopoiesis using single-cell lineage tracing. Curr. Opin. Hematol. 2021, 28, 18–27.
  38. Weinreb, C.; Rodriguez-Fraticelli, A.; Camargo, F.D.; Klein, A.M. Lineage tracing on transcriptional landscapes links state to fate during differentiation. Science 2020, 367, eaaw3381.
  39. Rodriguez-Fraticelli, A.E.; Weinreb, C.; Wang, S.W.; Migueles, R.P.; Jankovic, M.; Usart, M.; Klein, A.M.; Lowell, S.; Camargo, F.D. Single-cell lineage tracing unveils a role for TCF15 in haematopoiesis. Nature 2020, 583, 585–589.
  40. Yu, V.W.C.; Yusuf, R.Z.; Oki, T.; Wu, J.; Saez, B.; Wang, X.; Cook, C.; Baryawno, N.; Ziller, M.J.; Lee, E.; et al. Epigenetic Memory Underlies Cell-Autonomous Heterogeneous Behavior of Hematopoietic Stem Cells. Cell 2016, 167, 1310–1322.e17.
  41. Whichard, Z.L.; Sarkar, C.A.; Kimmel, M.; Corey, S.J. Hematopoiesis and its disorders: A systems biology approach. Blood 2010, 115, 2339–2347.
  42. Wichmann, H.E.; Loeffler, M.; Schmitz, S. A concept of hemopoietic regulation and its biomathematical realization. Blood Cells 1988, 14, 411–429.
  43. Mackey, M.C. Mathematical Models of Hematopoietic Cell Replication and Control; Prentice-Hall, Inc.: Hoboken, NJ, USA, 1997.
  44. Manesso, E.; Teles, J.; Bryder, D.; Peterson, C. Dynamical modelling of haematopoiesis: An integrated view over the system in homeostasis and under perturbation. J. R. Soc. Interface 2013, 10, 20120817.
  45. Le Novere, N. Quantitative and logic modelling of molecular and gene networks. Nat. Rev. Genet. 2015, 16, 146–158.
  46. Calzone, L.; Barillot, E.; Zinovyev, A. Logical versus kinetic modeling of biological networks: Applications in cancer research. Curr. Opin. Chem. Eng. 2018, 21, 22–31.
  47. Albert, R.; Thakar, J. Boolean modeling: A logic-based dynamic approach for understanding signaling and regulatory networks and for making useful predictions. Wiley Interdiscip. Rev. Syst. Biol. Med. 2014, 6, 353–369.
  48. Choi, M.; Shi, J.; Jung, S.H.; Chen, X.; Cho, K.H. Attractor landscape analysis reveals feedback loops in the p53 network that control the cellular response to DNA damage. Sci. Signal. 2012, 5, ra83.
  49. Remy, E.; Rebouissou, S.; Chaouiya, C.; Zinovyev, A.; Radvanyi, F.; Calzone, L. A Modeling Approach to Explain Mutually Exclusive and Co-Occurring Genetic Alterations in Bladder Tumorigenesis. Cancer Res. 2015, 75, 4042–4052.
  50. Naldi, A.; Carneiro, J.; Chaouiya, C.; Thieffry, D. Diversity and plasticity of Th cell types predicted from regulatory network modelling. PLoS Comput. Biol. 2010, 6, e1000912.
  51. Cacace, E.; Collombet, S.; Thieffry, D. Logical modeling of cell fate specification-Application to T cell commitment. Curr. Top. Dev. Biol. 2020, 139, 205–238.
  52. Rodriguez-Jorge, O.; Kempis-Calanis, L.A.; Abou-Jaoude, W.; Gutierrez-Reyna, D.Y.; Hernandez, C.; Ramirez-Pliego, O.; Thomas-Chollier, M.; Spicuglia, S.; Santana, M.A.; Thieffry, D. Cooperation between T cell receptor and Toll-like receptor 5 signaling for CD4(+) T cell activation. Sci. Signal. 2019, 12, eaar3641.
  53. Kondratova, M.; Barillot, E.; Zinovyev, A.; Calzone, L. Modelling of Immune Checkpoint Network Explains Synergistic Effects of Combined Immune Checkpoint Inhibitor Therapy and the Impact of Cytokines in Patient Response. Cancers 2020, 12, 3600.
  54. Krumsiek, J.; Marr, C.; Schroeder, T.; Theis, F.J. Hierarchical differentiation of myeloid progenitors is encoded in the transcription factor network. PLoS ONE 2011, 6, e22649.
  55. Bonzanni, N.; Garg, A.; Feenstra, K.A.; Schutte, J.; Kinston, S.; Miranda-Saavedra, D.; Heringa, J.; Xenarios, I.; Gottgens, B. Hard-wired heterogeneity in blood stem cells revealed using a dynamic regulatory network model. Bioinformatics 2013, 29, i80–i88.
  56. Collombet, S.; van Oevelen, C.; Ortega, J.L.S.; Abou-Jaoude, W.; Di Stefano, B.; Thomas-Chollier, M.; Graf, T.; Thieffry, D. Logical modeling of lymphoid and myeloid cell specification and transdifferentiation. Proc. Natl. Acad. Sci. USA 2017, 114, 5792–5799.
  57. Enciso, J.; Mayani, H.; Mendoza, L.; Pelayo, R. Modeling the Pro-inflammatory Tumor Microenvironment in Acute Lymphoblastic Leukemia Predicts a Breakdown of Hematopoietic-Mesenchymal Communication Networks. Front. Physiol. 2016, 7, 349.
  58. Ikonomi, N.; Kuhlwein, S.D.; Schwab, J.D.; Kestler, H.A. Awakening the HSC: Dynamic Modeling of HSC Maintenance Unravels Regulation of the TP53 Pathway and Quiescence. Front. Physiol. 2020, 11, 848.
  59. Marbach, D.; Roy, S.; Ay, F.; Meyer, P.E.; Candeias, R.; Kahveci, T.; Bristow, C.A.; Kellis, M. Predictive regulatory models in Drosophila melanogaster by integrative inference of transcriptional networks. Genome Res. 2012, 22, 1334–1349.
  60. Hu, X.; Hu, Y.; Wu, F.; Leung, R.W.T.; Qin, J. Integration of single-cell multi-omics for gene regulatory network inference. Comput. Struct. Biotechnol. J. 2020, 18, 1925–1938.
  61. Pratapa, A.; Jalihal, A.P.; Law, J.N.; Bharadwaj, A.; Murali, T.M. Benchmarking algorithms for gene regulatory network inference from single-cell transcriptomic data. Nat. Methods 2020, 17, 147–154.
  62. Huynh-Thu, V.A.; Irrthum, A.; Wehenkel, L.; Geurts, P. Inferring regulatory networks from expression data using tree-based methods. PLoS ONE 2010, 5, e12776.
  63. Gao, N.P.; Ud-Dean, S.M.M.; Gandrillon, O.; Gunawan, R. SINCERITIES: Inferring gene regulatory networks from time-stamped single cell transcriptional expression profiles. Bioinformatics 2018, 34, 258–266.
  64. Specht, A.T.; Li, J. LEAP: Constructing gene co-expression networks for single-cell RNA-sequencing data using pseudotime ordering. Bioinformatics 2017, 33, 764–766.
  65. Chan, T.E.; Stumpf, M.P.H.; Babtie, A.C. Gene Regulatory Network Inference from Single-Cell Data Using Multivariate Information Measures. Cell Syst. 2017, 5, 251–267.e3.
  66. Verny, L.; Sella, N.; Affeldt, S.; Singh, P.P.; Isambert, H. Learning causal networks with latent variables from multivariate information in genomic data. PLoS Comput. Biol. 2017, 13, e1005662.
  67. Herrmann, F.; Gross, A.; Zhou, D.; Kestler, H.A.; Kuhl, M. A boolean model of the cardiac gene regulatory network determining first and second heart field identity. PLoS ONE 2012, 7, e46798.
  68. Aibar, S.; Gonzalez-Blas, C.B.; Moerman, T.; Huynh-Thu, V.A.; Imrichova, H.; Hulselmans, G.; Rambow, F.; Marine, J.C.; Geurts, P.; Aerts, J.; et al. SCENIC: Single-cell regulatory network inference and clustering. Nat. Methods 2017, 14, 1083–1086.
  69. Arguelaguet, R.; Lohoff, T.; Li, J.G.; Nakhuda, A.; Krueger, F.; Velten, L.; Clarck, S.J.; Reik, W. Decoding gene regulation in the mouse embryo using single-cell multi-omics. bioRxiv 2022.
  70. Moignard, V.; Woodhouse, S.; Haghverdi, L.; Lilly, A.J.; Tanaka, Y.; Wilkinson, A.C.; Buettner, F.; Macaulay, I.C.; Jawaid, W.; Diamanti, E.; et al. Decoding the regulatory network of early blood development from single-cell gene expression measurements. Nat. Biotechnol. 2015, 33, 269–276.
  71. Chevalier, S.; Froidevaux, C.; Paulevé, L.; Zinovyev, A. Synthesis of Boolean networks from biological dynamical constraints using answer-set programming. In Proceedings of the IEEE 31st Internationnal Conference on Tools with Artificial Intelligence, Portland, OR, USA, 4–6 November 2019; pp. 34–41.
  72. Ostrowski, M.; Pauleve, L.; Schaub, T.; Siegel, A.; Guziolowski, C. Boolean network identification from perturbation time series data combining dynamics abstraction and logic programming. Biosystems 2016, 149, 139–153.
  73. Hamey, F.K.; Nestorowa, S.; Kinston, S.J.; Kent, D.G.; Wilson, N.K.; Gottgens, B. Reconstructing blood stem cell regulatory network models from single-cell molecular profiles. Proc. Natl. Acad. Sci. USA 2017, 114, 5822–5829.
  74. Schwab, J.D.; Ikonomi, N.; Werle, S.D.; Weidner, F.M.; Geiger, H.; Kestler, H.A. Reconstructing Boolean network ensembles from single-cell data for unraveling dynamics in the aging of human hematopoietic stem cells. Comput. Struct. Biotechnol. J. 2021, 19, 5321–5332.
  75. Herault, L.; Poplineau, M.; Duprez, E.; Remy, E. A novel Boolean network inference strategy to model early hematopoiesis aging. bioRxiv 2022.
More
Information
Subjects: Physiology
Contributors MDPI registered users' name will be linked to their SciProfiles pages. To register with us, please refer to https://encyclopedia.pub/register : , , ,
View Times: 399
Revisions: 4 times (View History)
Update Date: 18 Oct 2022
1000/1000
ScholarVision Creations