 +1 credit
| Version | Summary | Created by | Modification | Content Size | Created at | Operation |
|---|---|---|---|---|---|---|
| 1 | Dean Liu | -- | 2361 | 2022-10-09 01:40:10 |
Video Upload Options
Microwave sounding unit temperature measurements have been obtained from the troposphere since 1979, when they were included within NOAA weather satellites. By comparison, the usable balloon (radiosonde) record begins in 1958 but has less geographic coverage and is less uniform. Satellites do not measure temperature. They measure radiances in various wavelength bands, which must then be mathematically inverted to obtain indirect inferences of temperature. The resulting temperature profiles depend on details of the methods that are used to obtain temperatures from radiances. As a result, different groups that have analyzed the satellite data have obtained different temperature trends. Among these groups are Remote Sensing Systems (RSS) and the University of Alabama in Huntsville (UAH). The satellite series is not fully homogeneous - the record is constructed from a series of satellites with similar but not identical instrumentation. The sensors deteriorate over time, and corrections are necessary for satellite drift in orbit. Particularly large differences between reconstructed temperature series occur at the few times when there is little temporal overlap between successive satellites, making intercalibration difficult. To compare to the trend from the surface temperature record (approximately +0.07 °C/decade over the past century and +0.15-0.16 °C/decade since 1979) it is most appropriate to derive trends for the part of the atmosphere nearest the surface, i.e., the lower troposphere. Doing this, through January 2012: An alternative adjustment introduced by Fu et al. (2004) finds trends (1979–2011) of +0.14 °C/decade when applied to the RSS data set and +0.11 °C/decade when applied to the UAH data set . Using the T2 channel (which include significant contributions from the stratosphere, which has cooled), Mears et al. of Remote Sensing Systems (RSS) find (through January 2012) a trend of +0.082 °C/decade. Spencer and Christy of the University of Alabama in Huntsville (UAH), find a smaller trend of +0.046 °C/decade. A no longer updated analysis of Vinnikov and Grody found +0.20 °C/decade (1978–2005). Another satellite temperature analysis is provided by NOAA/NESDIS STAR Center for Satellite Application and Research and use simultaneous nadir overpasses (SNO) to remove satellite intercalibration biases yielding more accurate temperature trends. The SNO analysis finds a 1979-2011 trend of +0.128 °C/decade for T2 channel. The satellite records have the advantage of greater spatial coverage, whereas the radiosonde record is longer. There have been complaints of data problems with both records, and difficulty reconciling climate model predictions with the observed data.
1. Creation of the Satellite Temperature Record
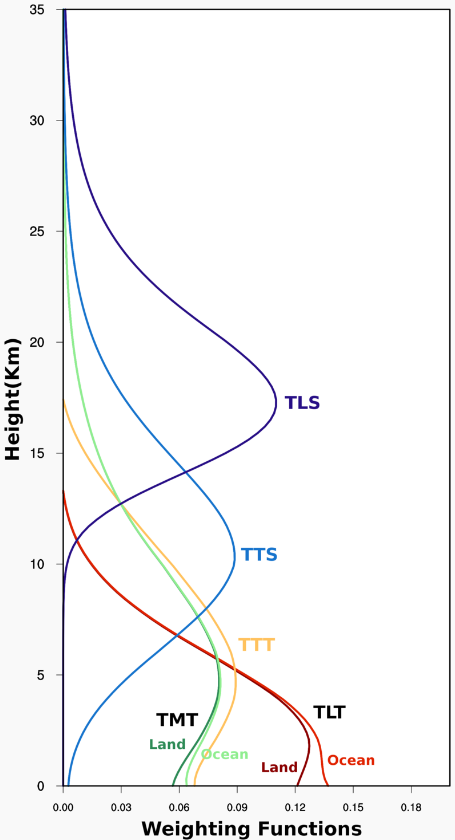
Since 1979, microwave sounding units (MSUs) on NOAA polar orbiting satellites have measured the intensity of upwelling microwave radiation from atmospheric oxygen. The intensity is proportional to the temperature of broad vertical layers of the atmosphere, as demonstrated by theory and direct comparisons with atmospheric temperatures from radiosonde (balloon) profiles. Upwelling radiance is measured at different frequencies; these different frequency bands sample a different weighted range of the atmosphere.[1] Channel 2 is broadly representative of the troposphere, albeit with a significant overlap with the lower stratosphere (the weighting function has its maximum at 350 hPa and half-power at about 40 and 800 hPa). In an attempt to remove the stratospheric influence, Spencer and Christy developed the synthetic "2LT" product by subtracting signals at different view angles; this has a maximum at about 650 hPa. However this amplifies noise,[2] increases inter-satellite calibration biases and enhances surface contamination.[3] The 2LT product has gone through numerous versions as various corrections have been applied.
Records have been created by merging data from nine different MSUs and AMSU data, each with peculiarities that must be calculated and removed because they can have substantial impacts on the resulting trend.[4] The process of constructing a temperature record from a radiance record is difficult and some of the required corrections are as large as the trend itself:[5]
- Diurnal sampling
All the MSU instruments and to a lesser extent AMSU drift slowly from the sun-synchronous equatorial crossing time changing the local time observed by the instrument, therefore the natural diurnal cycle may be aliased into the long term trend. The diurnal sampling correction is in the order of a few hundredths °C/decade for TLT and TMT.
- Orbit decay
All Polar orbiting satellite lose height after launch, the orbital decay is stronger during period of elevated solar activity when the enhanced ultraviolet radiation warm the upper atmosphere and increase the frictional drag over the spacecraft.
The orbital decay change the instrument view angle relative to the surface and thus the observed microwave emissivity, furthermore the long term time-series is constructed by sequential merging of the inter-calibrated satellite data so that the error is summed up over time, the required correction is in the order of 0.1 °C/decade for TLT.
- Calibration changes
Once every earth scan MSU instrument use the deep space (2.7K) and on-board warm targets to make calibration measures, however as the spacecraft drifts through the diurnal cycle the calibration target temperature may change due to varying solar shadowing effect, the correction is in the order of 0.1 °C/decade for TLT and TMT.
One widely reported satellite temperature record, developed by Roy Spencer and John Christy at the University of Alabama in Huntsville (UAH), is current version corrects previous errors in their analysis for orbital drift and other factors. The record comes from a succession of different satellites and problems with inter-calibration between the satellites are important, especially NOAA-9, which accounts for most of the difference between the RSS and UAH analyses.[6] NOAA-11 played a significant role in a 2005 study by Mears et al. identifying an error in the diurnal correction that leads to the 40% jump in Spencer and Christy's trend from version 5.1 to 5.2.[7]
2. Trends from the Record
| Channel | Start | End Date | RSS Trend (K/decade)[8] |
UAH Trend (K/decade)[9][10][11] |
STAR Trend (K/decade)[12] |
UW-RSS Trend (K/decade)[13] |
UW-UAH Trend (K/decade)[13] |
|---|---|---|---|---|---|---|---|
| Global | |||||||
| TLT | 1979 | 2012-01 | 0.137 | 0.136 | |||
| UW-MT | 1979 | 2012-01 | 0.14 | 0.11 | |||
| TMT | 1979 | 2012-01 | 0.082 | 0.046 | 0.128 | ||
| TTS | 1987 | 2012-01 | -0.008 | ||||
| TUT | 1981 | 2012-01 | 0.039 | ||||
| TLS | 1979 | 2012-01 | -0.303 | -0.382 | -0.326 | ||
| Northern Hemisphere | |||||||
| TLT | 1979 | 2012-01 | 0.195 | ||||
| TMT | 1979 | 2012-01 | 0.082 | ||||
| TLS | 1979 | 2012-01 | -0.371 | ||||
| Southern Hemisphere | |||||||
| TLT | 1979 | 2012-01 | 0.077 | ||||
| TMT | 1979 | 2012-01 | 0.011 | ||||
| TLS | 1979 | 2012-01 | -0.393 | ||||
| Tropics | |||||||
| TLT | 1979 | 2012-01 | 0.072 | ||||
| TMT | 1979 | 2012-01 | 0.039 | ||||
| TLS | 1979 | 2012-01 | -0.321 | ||||
3. History of Satellite Temperature Data Interpretation
In the late 1990s the disagreement between the surface temperature record and the satellite records was a subject of research and debate. The lack of warming then seen in the records was noted.[14] A report by the National Research Council that reviewed upper air temperature trends stated:
- "Data collected by satellites and balloon-borne instruments since 1979 indicate little if any warming of the low- to mid-troposphere—the atmospheric layer extending up to about 5 miles from the Earth's surface. Climate models generally predict that temperatures should increase in the upper air as well as at the surface if increased concentrations of greenhouse gases are causing the warming."[15]
The same panel then concluded that
- "the warming trend in global-mean surface temperature observations during the past 20 years is undoubtedly real and is substantially greater than the average rate of warming during the twentieth century. The disparity between surface and upper air trends in no way invalidates the conclusion that surface temperature has been rising."[16][17]
In 1998 the UAH data showed a cooling of 0.05K per decade (at 3.5 km - mid to low troposphere). Wentz & Schabel at RSS in their 1998 paper showed this (along with other discrepancies) was due to the orbital decay of the NOAA satellites.[18] Once the orbital changes had been allowed for the data showed a 0.07K per decade increase in temperature at this level of the atmosphere.
In April 2002, for example, an analysis of the satellite temperature data showed warming of only 0.04 °C per decade, compared with surface measurements showing 0.17 ± 0.06 °C per decade.
Doubts had been raised as early as 2000 about the UAH analysis by the work of Prabhakara et al.,[19] which minimised errors due to satellite drift. They found a trend of 0.13 °C/decade, in reasonable agreement with surface trends.
Christy et al. (2007) find that the tropical temperature trends from radiosondes matches closest with his v5.2 UAH dataset.[20] Furthermore, they assert there is a growing discrepancy between RSS and sonde trends beginning in 1992, when the NOAA-12 satellite was launched.[21] This research found that the tropics were warming, from the balloon data, +0.09 (corrected to UAH) or +0.12 (corrected to RSS) or 0.05 K (from UAH MSU; ±0.07 K room for error) a decade.
The table below summarize the adjustments that have been applied to the UAH TLT dataset.[5] [22]
| UAH version | Main adjustment | Trend correction | Year |
|---|---|---|---|
| A | Simple bias correction | 1992 | |
| B | Linear diurnal drift correction | -0.03 | 1994 |
| C | Removal of residual annual cycle related to hot target variation |
0.03 | 1997 |
| D | Orbital decay | 0.10 | 1998 |
| D | Removal of dependence of time variations of hot target temperature |
-0.07 | 1998 |
| 5.0 | Non-linear diurnal correction | 0.008 | 2003 |
| 5.1 | Tightened criteria for data acceptance | -0.004 | 2004 |
| 5.2 | Correction of diurnal drift adjustment | 0.035 | 2005 |
| 5.3 | Annual cycle correction | 0 | 2009 |
| 5.4 | New annual cycle | 0 | 2010 |
Another important critique of the satellite record is its shortness—adding a few years on to the record or picking a particular time frame can change the trends considerably.
Likewise, even though they began with the same data, each of the major research groups has interpreted it with different results. Most notably, Mears et al. at RSS find 0.193 °C/decade for lower troposphere up to July 2005, compared to +0.123 °C/decade found by UAH for the same period.
There are ongoing efforts to resolve these differences. Some believe that much of the disparity may have been resolved by the three papers in Science, 11 August 2005, which pointed out errors in the UAH 5.1 record and the radiosonde record in the tropics.
4. Stratospheric Temperature Trends
The satellites also measure the lower stratospheric temperature and show a decline in stratospheric temperatures, interspersed by warmings related to volcanic eruptions. Global Warming theory suggests that the stratosphere should cool while the troposphere warms [23] However, the lower stratospheric cooling is mainly caused by the effects of ozone depletion with a possible contribution from increased stratospheric water vapor and greenhouse gases increase.[24][25] The long term cooling in the lower stratosphere occurred in two downward steps in temperature both after the transient warming related to explosive volcanic eruptions of El Chichón and Mount Pinatubo, this behavior of the global stratospheric temperature has been attributed to global ozone concentration variation in the two years following volcanic eruptions.[26] Since 1996 the trend is slightly positive[27] due to ozone recover juxtaposed to a cooling trend of 0.1K/decade that is consistent with the predicted impact of increased greenhouse gases.[26]
5. Reconciliation of Data with Climate Models
Climate models predict that as the surface warms, so should the global troposphere. Globally, the troposphere should warm about 1.2 times more than the surface; in the tropics, the troposphere should warm about 1.5 times more than the surface. For some time the only available satellite record was the UAH version, which (with early versions of the processing algorithm) showed a global cooling trend for its first decade. Since then, a longer record and a number of corrections to the processing have revised this picture: the UAH dataset has shown an overall warming trend since 1998, though less than the RSS version. In 2001, an extensive comparison and discussion of trends from different data sources and periods was given in the Third Assessment Report of the Intergovernmental Panel on Climate Change (IPCC) (section 2.2.4).[28]
A detailed analysis produced by dozens of scientists as part of the US Climate Change Science Program (CCSP) identified and corrected errors in a variety of temperature observations, including the satellite data.
The CCSP SAP 1.1 Executive Summary states:
- "Previously reported discrepancies between the amount of warming near the surface and higher in the atmosphere have been used to challenge the reliability of climate models and the reality of human induced global warming. Specifically, surface data showed substantial global-average warming, while early versions of satellite and radiosonde data showed little or no warming above the surface. This significant discrepancy no longer exists because errors in the satellite and radiosonde data have been identified and corrected. New data sets have also been developed that do not show such discrepancies."
The IPCC Fourth Assessment Report Summary for Policymakers states:
- "New analyses of balloon-borne and satellite measurements of lower- and mid-tropospheric temperature show warming rates that are similar to those of the surface temperature record and are consistent within their respective uncertainties, largely reconciling a discrepancy noted in the TAR."
However, as detailed in CCSP SAP 5.1 Understanding and Reconciling Differences, neither Regression models or other related techniques were reconcilable with observed data. The use of fingerprinting techniques on data yielded that "Volcanic and human-caused fingerprints were not consistently identifiable in observed patterns of lapse rate change." As such, issues with reconciling data and models remain.
A potentially serious inconsistency has been identified in the tropics, the area in which tropospheric amplification should be seen. Section 1.1 of the CCSP report says:
- "In the tropics, the agreement between models and observations depends on the time scale considered. For month-to-month and year-to-year variations, models and observations both show amplification (i.e., the month-to-month and year-to-year variations are larger aloft than at the surface). This is a consequence of relatively simple physics, the effects of the release of latent heat as air rises and condenses in clouds. The magnitude of this amplification is very similar in models and observations. On decadal and longer time scales, however, while almost all model simulations show greater warming aloft (reflecting the same physical processes that operate on the monthly and annual time scales), most observations show greater warming at the surface.
- "These results could arise either because “real world” amplification effects on short and long time scales are controlled by different physical mechanisms, and models fail to capture such behavior; or because non-climatic influences remaining in some or all of the observed tropospheric data sets lead to biased long-term trends; or a combination of these factors. The new evidence in this Report favors the second explanation."
The lower troposphere trend derived from UAH satellites (+0.128 °C/decade) is currently lower than both the GISS and Hadley Centre surface station network trends (+0.161 and +0.160 °C/decade respectively), while the RSS trend (+0.158 °C/decade) is similar. However, the expected trend in the lower troposphere, given the surface data, would be around 0.194 °C/decade, making the UAH and RSS trends 66% and 81% of the expected value respectively.
References
- Remote Sensing Systems http://www.ssmi.com/msu/img/msu_weighting_functions.png
- 2.0.CO;2. Bibcode: 1998JCli...11.2016.. https://dx.doi.org/10.1175%2F1520-0442%281998%29011%3C2016%3AAOTMPF%3E2.0.CO%3B2" id="ref_2">Christy, John R.; Spencer, Roy W.; Lobl, Elena S. (1998). "Analysis of the Merging Procedure for the MSU Daily Temperature Time Series". Journal of Climate 11 (8): 2016–2041. doi:10.1175/1520-0442(1998)011<2016:AOTMPF>2.0.CO;2. Bibcode: 1998JCli...11.2016.. https://dx.doi.org/10.1175%2F1520-0442%281998%29011%3C2016%3AAOTMPF%3E2.0.CO%3B2
- Fu, Qiang; Johanson, Celeste M. (2005). "Satellite-Derived Vertical Dependence Of Tropical Tropospheric Temperature Trends". Geophysical Research Letters 32 (10): L10703. doi:10.1029/2004GL022266. Bibcode: 2005GeoRL..3210703F. https://dx.doi.org/10.1029%2F2004GL022266
- The Satellite Temperature Records: Parts 1 and 2 May 1996 http://www.usgcrp.gov/usgcrp/seminars/960521SM.html
- "CCSP sap 1.1". Archived from the original on 2010-12-24. https://web.archive.org/web/20101224094945/http://climatescience.gov/Library/sap/sap1-1/finalreport/sap1-1-final-chap2.pdf. Retrieved 2011-01-15.
- Remote Sensing Systems http://www.ssmi.com/msu/msu_data_description.html
- Mears, Carl A.; Wentz, Frank J. (2005). "The Effect of Diurnal Correction on Satellite-Derived Lower Tropospheric Temperature". Science 309 (5740): 1548–1551. doi:10.1126/science.1114772. PMID 16141071. Bibcode: 2005Sci...309.1548M. https://dx.doi.org/10.1126%2Fscience.1114772
- "RSS". "RSS / MSU and AMSU Data / Description". Archived from the original on 23 November 2012. https://web.archive.org/web/20121123040542/http://www.ssmi.com/msu/msu_data_description.html. Retrieved 13 February 2012.
- "UAHTLT". "MONTHLY MEANS OF LOWER TROPOSPHERE LT5.4". UAH. Archived from the original on 17 July 2012. https://web.archive.org/web/20120717025455/http://vortex.nsstc.uah.edu/data/msu/t2lt/tltglhmam_5.4. Retrieved 13 February 2012.
- "MONTHLY MEANS OF MID-TROPOSPHERE MT5.4". UAH. Archived from the original on 17 July 2012. https://web.archive.org/web/20120717025502/http://vortex.nsstc.uah.edu/data/msu/t2/tmtglhmam_5.4. Retrieved 13 February 2012.
- "MONTHLY MEANS OF LOWER STRATOSPHERE LS5.4". UAH. Archived from the original on 17 July 2012. https://web.archive.org/web/20120717025534/http://vortex.nsstc.uah.edu/data/msu/t4/tlsglhmam_5.4. Retrieved 13 February 2012.
- National Environmental Satellite, Data, and Information Service (December 2010). "Microwave Sounding Calibration and Trend". National Oceanic and Atmospheric Administration. http://www.star.nesdis.noaa.gov/smcd/emb/mscat/mscatmain.htm. Retrieved 2012-02-13.
- "State of the Climate Upper Air Annual 2011". National Oceanic and Atmospheric Administration. http://www.ncdc.noaa.gov/sotc/upper-air/2011/13. Retrieved 2012-02-21.
- "Christy and Spencer Respond to Critics; Water Vapor Still Not Resolved". Cooler Heads Coalition. October 1998. Archived from the original on 2007-09-11. https://web.archive.org/web/20070911190509/http://www.globalwarming.org/article.php?uid=167.
- The National Academies, "Reconciling Observations of Global Temperature Change", 2000 http://books.nap.edu/catalog/9755/reconciling-observations-of-global-temperature-change?onpi_newsdoc011200=
- Board on Atmospheric Sciences and Climate (2000). "Executive Summary". Reconciling Observations of Global Temperature Change. Washington, D.C.: National Academy Press. pp. 1–4. ISBN 0-309-06891-6. http://books.nap.edu/books/0309068916/html/2.html#pagetop.
- Llanos, Miguel (2000-01-13). "Panel weighs in on global warming: Earth’s surface is warmer, they say, even if upper air isn’t". MSNBC. Archived from the original on 2006-04-27. https://web.archive.org/web/20060427072934/http://www.msnbc.com/news/356875.asp?cp1=1.
- http://www.remss.com/papers/MSU_Nature_Article.pdf
- http://www.agu.org/journals/ABS/2000/2000GL011719.shtml
- Christy, J. R.; Norris, W. B.; Spencer, R. W.; Hnilo, J. J. (2007). "Tropospheric temperature change since 1979 from tropical radiosonde and satellite measurements". Journal of Geophysical Research 112: D06102. doi:10.1029/2005JD006881. Bibcode: 2007JGRD..11206102C. https://dx.doi.org/10.1029%2F2005JD006881
- Climate Science: Roger Pielke Sr. Research Group Weblog http://climatesci.colorado.edu/2007/04/13/new-paper-on-the-assessment-of-tropospheric-temperature-trends-by-the-university-of-alabama-research-group/
- "UAH adjustment". http://vortex.nsstc.uah.edu/public/msu/t2lt/readme.13Sep2010. Retrieved 2011-01-15.
- Clough, S.A.; M. J. Iacono (1995). "Line-by-line calculation of atmospheric fluxes and cooling rates 2. Application to carbon dioxide, ozone, methane, nitrous oxide and the halocarbons". Journal of Geophysical Research 100: 16519–16535. doi:10.1029/95JD01386. Bibcode: 1995JGR...10016519C. http://www.agu.org/pubs/crossref/1995/95JD01386.shtml.
- Shine, Keith; M.S. Bourqui; P.M.D. Forster; S.H.E. Hare; U. Langematz; P. Braesicke; V. Grewe; M. Ponater et al. (2003). "A comparison of model-simulated trends in stratospheric temperatures". Q. J. Royal Meteorol. Soc 129: 1565–1588. doi:10.1256/qj.02.186. Bibcode: 2003QJRMS.129.1565S. Archived from the original on 2011-10-20. https://web.archive.org/web/20111020164838/http://pubs.giss.nasa.gov/docs/2003/2003_Shine_etal.pdf. Retrieved 2010-02-15.
- United Nations Environment Programme http://www.grida.no/climate/ipcc_tar/wg1/fig8-20.htm
- Thompson, David W. J.; Susan Solomon (2009). "Understanding Recent Stratospheric Climate Change". Journal of Climate 22 (8): 1934–1943. doi:10.1175/2008JCLI2482.1. Bibcode: 2009JCli...22.1934T. http://ams.allenpress.com/perlserv/?request=get-abstract&doi=10.1175%2F2008JCLI2482.1&ct=1. Retrieved 2010-02-15.
- Liu, Quanhua; Fuzhong Weng (2009). "Recent Stratospheric Temperature Observed from Satellite Measurements". SOLA 5: 53–56. doi:10.2151/sola.2009-014. Bibcode: 2009SOLA....5...53L. http://www.jstage.jst.go.jp/article/sola/5/0/53/_pdf. Retrieved 2010-02-15.
- United Nations Environment Programme http://www.grida.no/climate/ipcc_tar/wg1/060.htm

