Your browser does not fully support modern features. Please upgrade for a smoother experience.
Submitted Successfully!
 +1 credit
Thank you for your contribution! You can also upload a video entry or images related to this topic.
For video creation, please contact our Academic Video Service.
| Version | Summary | Created by | Modification | Content Size | Created at | Operation |
|---|---|---|---|---|---|---|
| 1 | Sara Vázquez-Calvo | -- | 2398 | 2022-09-12 09:04:47 | | | |
| 2 | Dean Liu | -33 word(s) | 2365 | 2022-09-15 03:44:31 | | |
Video Upload Options
We provide professional Academic Video Service to translate complex research into visually appealing presentations. Would you like to try it?
Cite
If you have any further questions, please contact Encyclopedia Editorial Office.
Vázquez-Calvo, S.; Roca-Luque, I.; Porta-Sánchez, A. Techniques for Ventricular Tachycardia Functional Substrate Mapping. Encyclopedia. Available online: https://encyclopedia.pub/entry/27178 (accessed on 23 July 2026).
Vázquez-Calvo S, Roca-Luque I, Porta-Sánchez A. Techniques for Ventricular Tachycardia Functional Substrate Mapping. Encyclopedia. Available at: https://encyclopedia.pub/entry/27178. Accessed July 23, 2026.
Vázquez-Calvo, Sara, Ivo Roca-Luque, Andreu Porta-Sánchez. "Techniques for Ventricular Tachycardia Functional Substrate Mapping" Encyclopedia, https://encyclopedia.pub/entry/27178 (accessed July 23, 2026).
Vázquez-Calvo, S., Roca-Luque, I., & Porta-Sánchez, A. (2022, September 14). Techniques for Ventricular Tachycardia Functional Substrate Mapping. In Encyclopedia. https://encyclopedia.pub/entry/27178
Vázquez-Calvo, Sara, et al. "Techniques for Ventricular Tachycardia Functional Substrate Mapping." Encyclopedia. Web. 14 September, 2022.
Copy Citation
Conventional mapping techniques used to define the critical isthmus, such as activation mapping and entrainment, are limited by the non-inducibility of the clinical tachycardia or its poor hemodynamic tolerance. To overcome these limitations, a voltage mapping strategy based on bipolar electrograms peak to peak analysis was developed, but a low specificity (30%) for VT isthmus has been described with this approach. Functional mapping strategy relies on the analysis of the characteristics of the electrograms but also their propagation patterns and their response to extra-stimulus or alternative pacing wavefronts to define the targets for ablation.
ventricular tachycardia ablation
functional mapping
hidden substrate
1. Decrement Evoked Potential (DEEP) Mapping
Voltage channels can be easily identified in patients with VT through voltage maps; adjusting the thresholds but a low specificity (30%) for VT isthmus has been described with this approach. The presence of LPs inside the CCs increases the specificity for identifying critical VT termination sites (85%) [1]. Despite strategies focusing on complete LP abolition, inducibility at the end of the procedure continues to be high (40%) and the VT recurrence still remains around 30% after one-year follow up [2][3].
Looking in depth into the mechanism of re-entry, which is the main mechanism of VT in patients with heart disease, conduction delay preceding unidirectional block has been demonstrated as essential for its initiation and maintenance [4][5] (Figure 1).
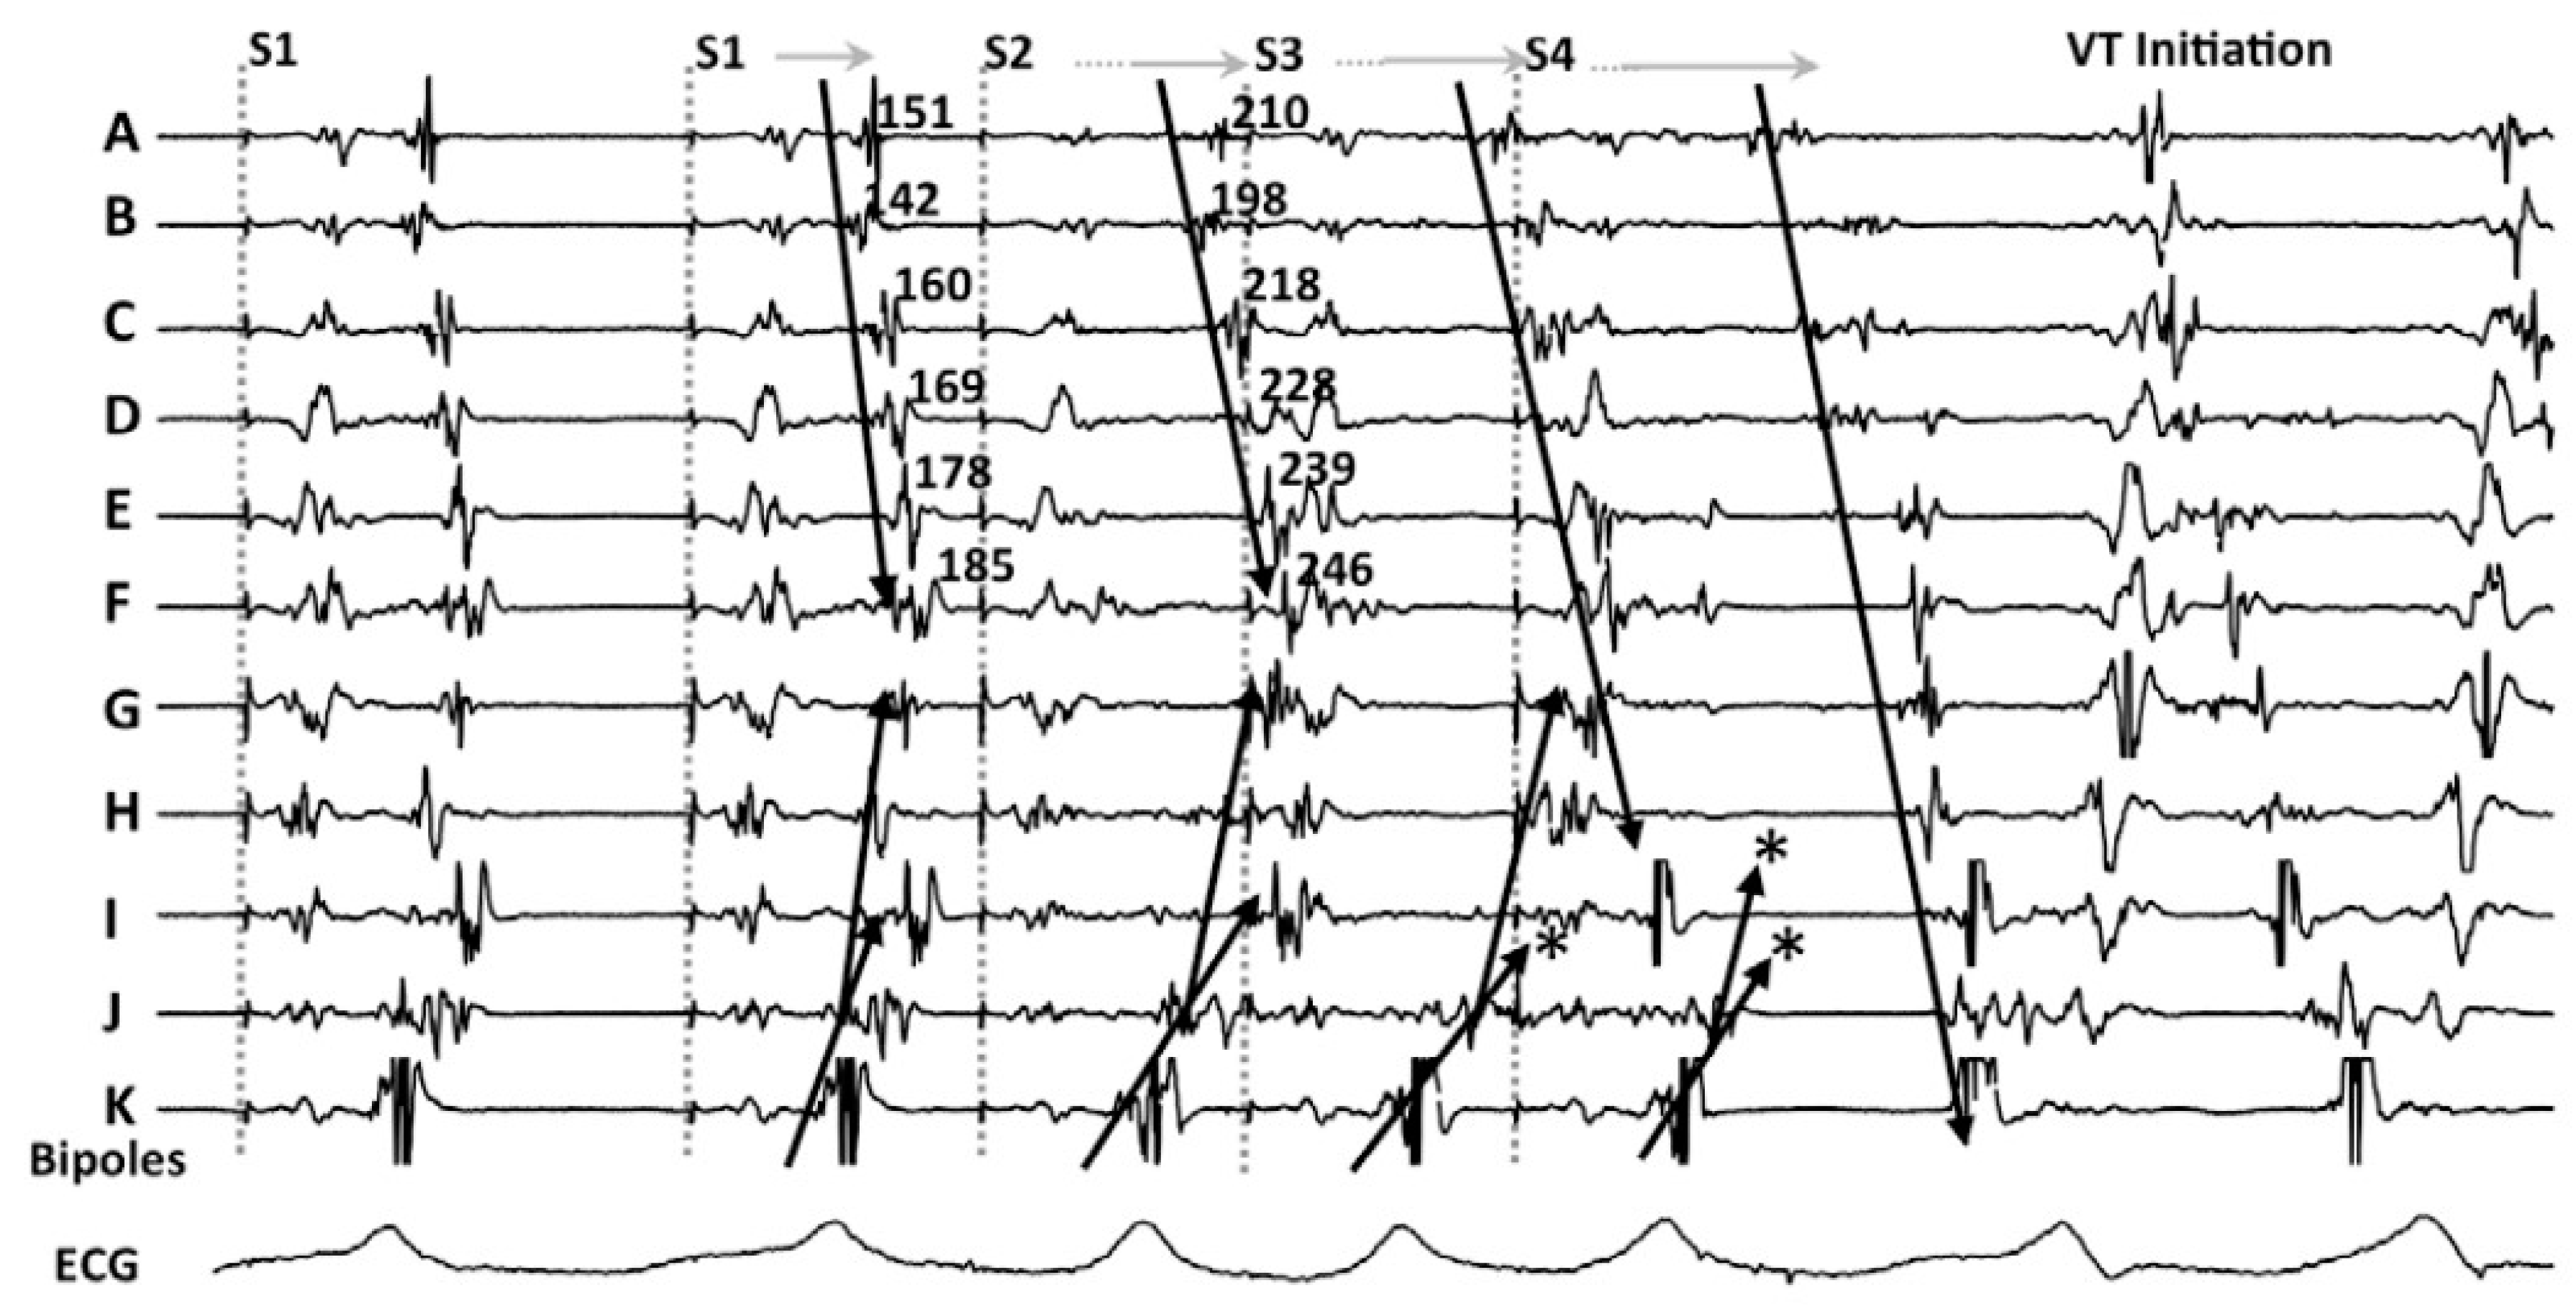
Figure 1. An example of decremental conduction, unidirectional block, and induction of ventricular tachycardia (VT) from Jackson et al. [6]. During right ventricular pacing, local abnormal potentials can be seen on bipoles A to K. With the introduction of the first extrastimulus (S2), an important delay in bipoles A to J is observed. With S3, there is a block (*) of the local potential on bipole I and subsequently with S4 there is block (*) at the VT exit site (bipole J). Block at the VT exit site and conduction delay through the entrance of the channel set the basis for re-entrance. The mechanistic study by Jackson et al. showed that those late potentials that had decremental properties were more frequently co-localized with the VT isthmus.
In their seminal paper, Jackson et al. [6] hypothesized that ventricular EGMs which showed decremental conduction (called decrement evoked potentials or DEEPs) could be more likely to colocalize with critical VT circuits than LPs without decremental conduction. They retrospectively analyzed the results of intraoperative mapping from six ischemic patients, and after that, used a human ventricular myocardium ionic model [7] to mathematically correlate DEEPs with the diastolic isthmus of VT. The mapping protocol consisted in performing a RV pacing train at 600 ms with a single extra-stimulus delivered at the ventricular effective refractory period (VERP)+20 ms whenever an LP or fractionated potential was identified. If the local potential delayed >10 ms, this would be annotated as a DEEP. In this setting, the use of DEEP mapping identified the diastolic pathway with greater specificity than LP mapping with similar sensitivity. Of note, only areas showing LP during baseline conditions were analyzed for the presence of DEEPs.
These results were confirmed in the clinical setting by Porta-Sanchez et al. [8] with 20 consecutive patients with ischemic cardiomyopathy in a multicentric study. They identified DEEPs as those LPs with decremental activity (>10 ms delay after pacing protocol). The mean area with LPS was 16.8% of the myocardium mapped vs. 4.8% with DEEP (p < 0.001), but areas with DEEPs performed better than LPs at colocalizing within VT isthmus (ROC area under the curve of 0.86 vs. 0.79 with LPs). The ablation strategy consisted in ablation only of the DEEP regions and only expanded the ablation if the patient was still inducible (20%). Recurrence rates after DEEP-guided ablation were similar to what has been described in the literature (75% VT freedom at 6 months).
2. Hidden Slow Conduction (HSC) Mapping
Acosta et al. [9] described a new method to unmask EGMs showing hidden slow conduction (HSC-EGM) using a double ventricular extra-stimulus in 37 consecutive patients (with ischemic and non-ischemic myocardiopathy). They distinguished four different EGMs: normal (less than three sharp deflections with amplitude >3 mV and duration <70 ms; fractionated (multiple deflections, amplitude <0.5 mV and duration >133 ms; late (any EGM lasting beyond the QRS); and potential HSC-EGM (>3 deflections but <133 ms). Whenever a potential HSC-EGM was identified, a double extra-stimulus from the RV apex was delivered at VERP+60 ms and VERP+40 to 20 ms, respectively. When the EGM split and delayed from the far-field signal, it was annotated as HSC-EGM (Figure 2). These EGMs were found in 56.7% of patients. Ablation was delivered at conducting channels (scar dechannelling technique) and HSC-EGMs. Interestingly, patients showing HSC-EGM were more frequently ischemic with smaller and more heterogeneous scar areas and had less VT inducibility after ablation compared with an historic cohort.
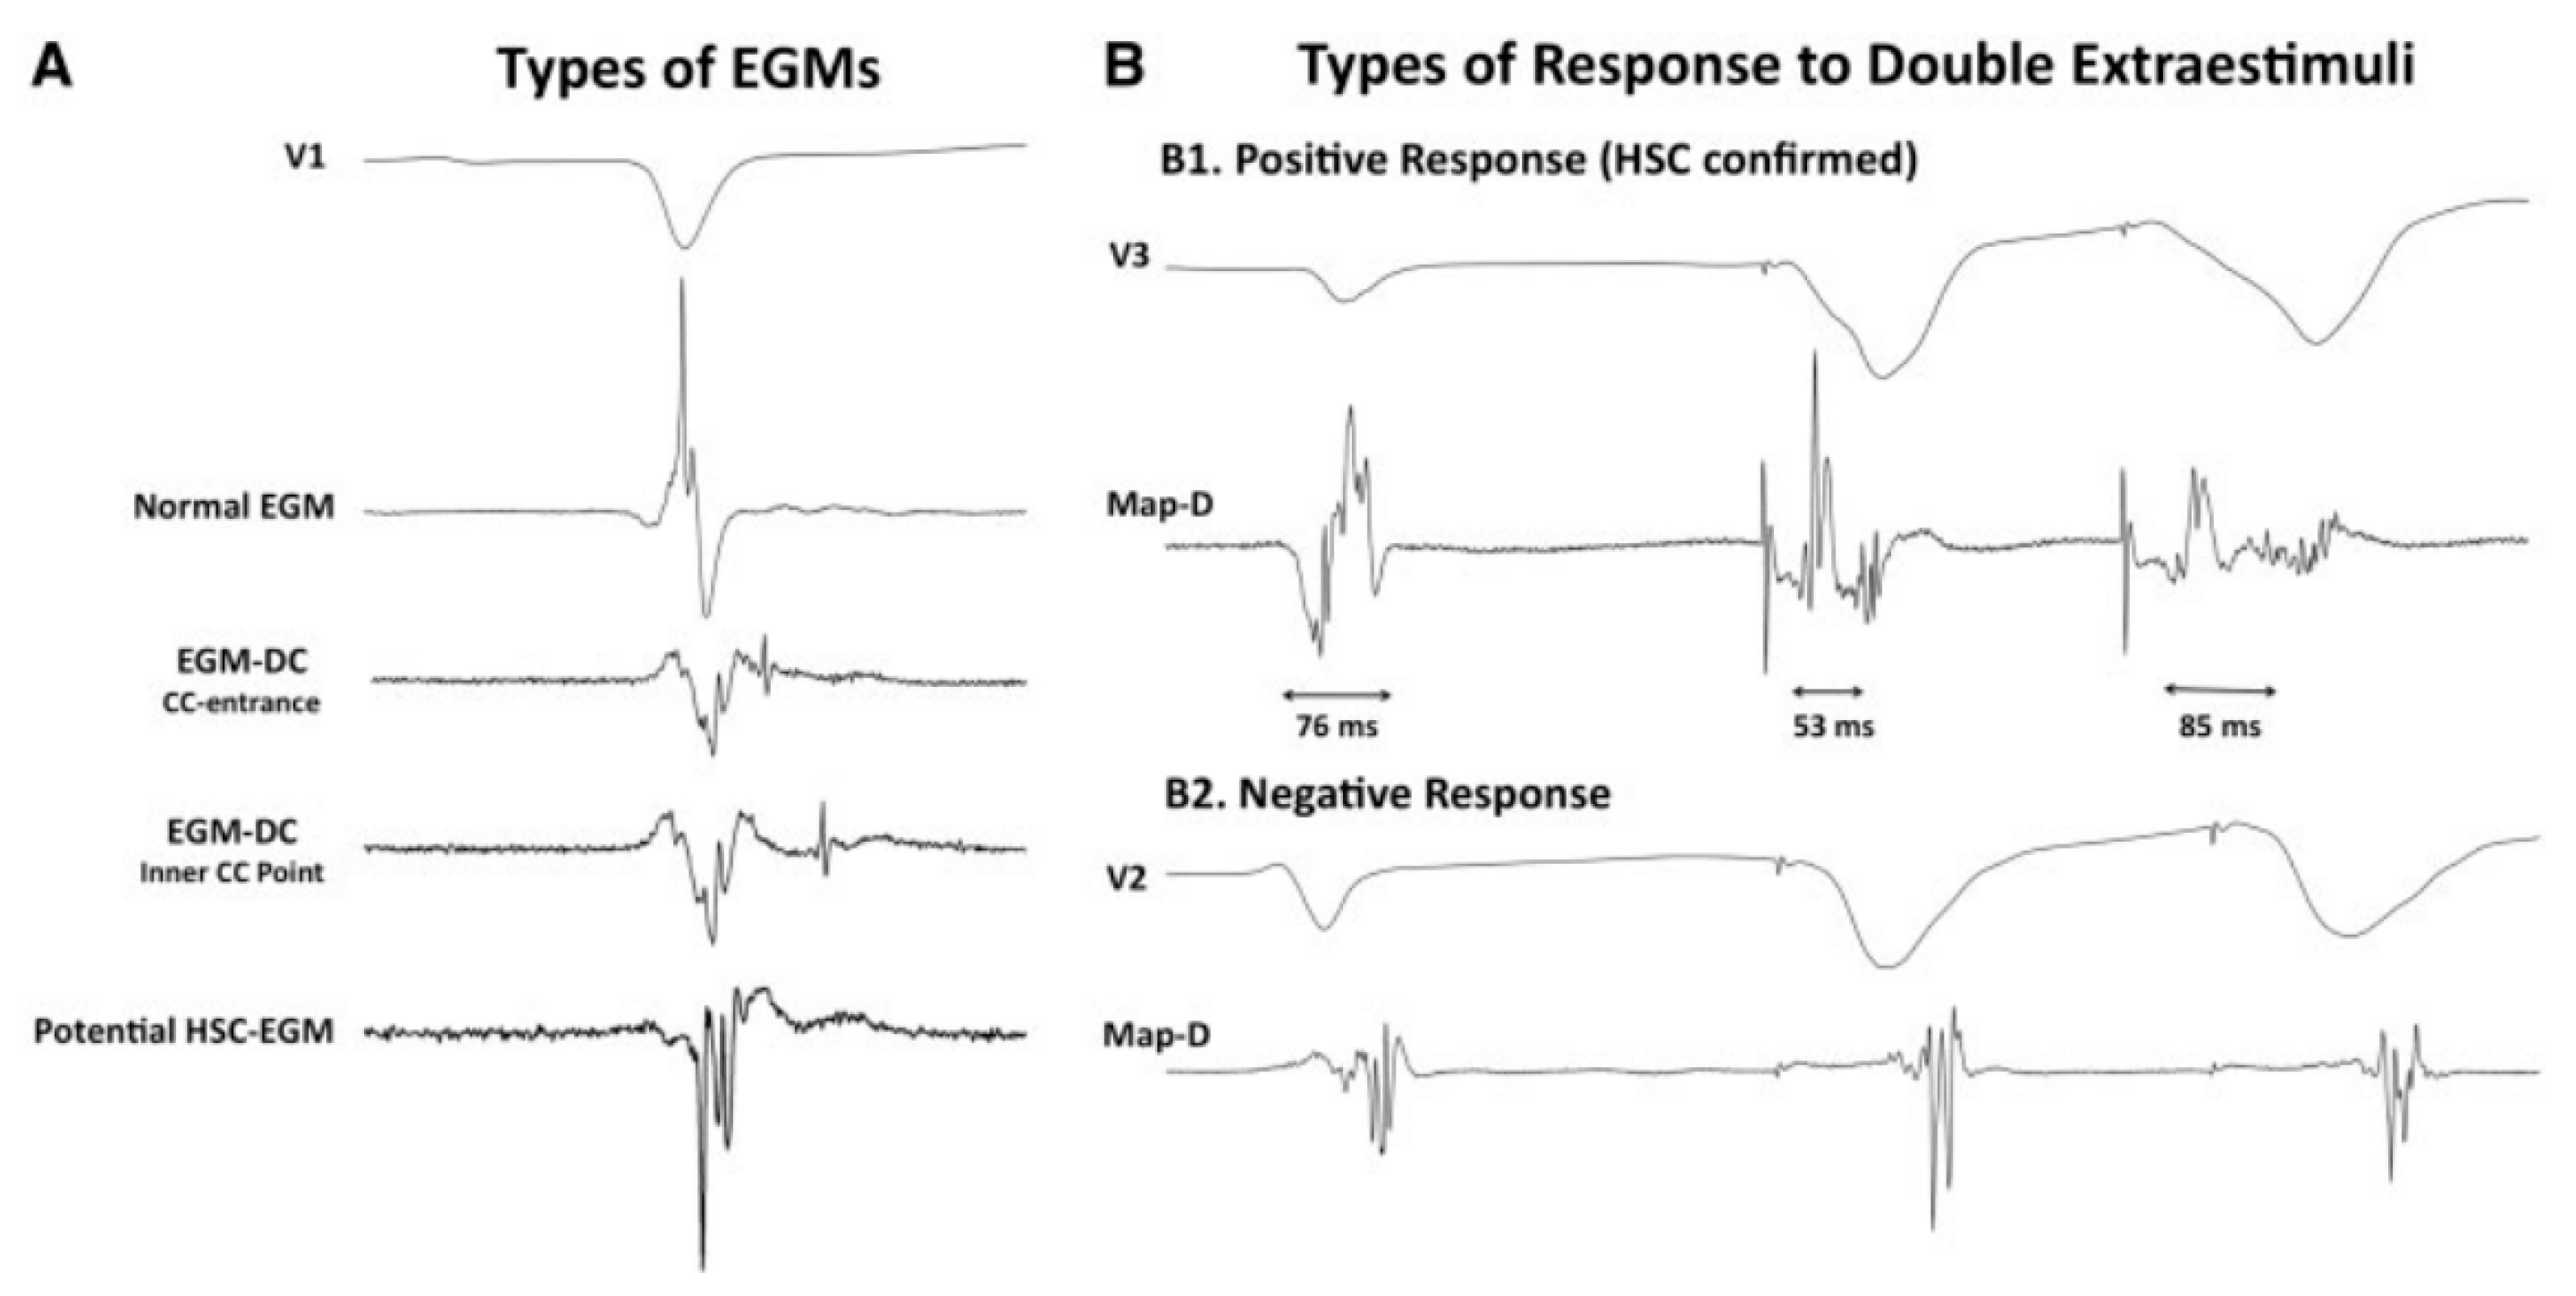
Figure 2. Electrogram classification and response to a double extraestimulus from Acosta et al. [9]. (A) different types of EGMs are shown: from normal through CC-EGMs to potential HSC. (B) the response of the potential HSC-EGM after a double extraestimulus is represented, considering a positive response if the local potential is delayed. Ablation was undertaken in those regions feeding the preserved voltage channels with the “scar dechanneling” technique.
3. Evoked Delayed Potential (EDP) Mapping
De Riva et al. [11] performed a similar study to Acosta’s and Porta-Sánchez’s including 60 consecutive ischemic patients and found that 62% of patients had hidden slow conduction (unmasked by pacing RV 500 ms + a single extra-stimulus VERP+50 ms and defined as conduction delay > 10 ms or block). These patients had better left ventricular function and smaller scar areas on the electroanatomical mapping system. The authors hypothesized that an ablation strategy based on the exclusive elimination of the EDPs can lead to a lower incidence of VT recurrence in the follow up (compared with an LVEF-matched historical cohort from their own institution).
In both Acosta’s and De Riva’s studies, the distribution of hidden substrate was analyzed and, when possible, compared not only with voltage maps but also cardiac magnetic resonance (CMR). Nearly 20–35% of these EGMs were located in healthy tissue (>1.5 mV bipolar peak to peak) as measured by mapping. This number clearly decreased when the analysis was made by CMR (8–9%), which emphasizes the possibility of a better definition of the VT substrate by CMR and functional substrate mapping as compared to the conventional voltage map. This is consistent with the study by Oduneye [12], in which a real-time CMR-guided electrophysiology system was used observing that abnormal EGMs were seen more often in BZ defined by CMR. One possible explanation for this inaccuracy of the voltage map is that far-field healthy-tissue signals can obscure the near field signals underestimating the scar and hiding the abnormal EGMs from conducting channels, especially in patients with small areas of scar. In those patients, trying to unmask the hidden substrate could be especially relevant but needs to be performed in a systematic way throughout the entire substrate.
4. Paced Electrogram Feature Analysis (PEFA)
A better characterization of the EGM response after a close-coupled extra-stimuli was studied by Redfearn et al. [13] both in ischemic and control subjects, defining four different types of response (type 0: no change in the characteristics of the EGM; type I: increased in duration and latency; type II: increase in duration; and type III: increase in latency) and correlated them with the VT isthmus. Programmed stimulation was performed using a RV stimulation 600 ms followed by an extra-stimulus applied every 7th beat: VERP+150 ms, VERP+100 ms, VERP+50 ms. So, three different maps were generated. They observed that the mean duration of the EGMs increased in all patients (significantly more in heart disease patients), but the latency behaved differently: it decreased with the first extra-stimuli (VERP+150 ms) and then (with VERP+100 and VERP+50 ms) increased in healthy patients, but continuously increased in all ischemic population. They also identified that latency (type III) was a common response in both LAVA and non-LAVA areas, type I and II responses found most frequently at VT termination sites.
The PEFA strategy was tested with 10 ischemic patients, targeting type I and II EGMs for radiofrequency, obtaining longer procedures but a lower VT inducibility rate at the end of the procedure in the interventional group as compared to the derivation cohort.
5. The Barts Sense Protocol
In an elegant study, focusing on a mechanistic and physiopathologically sound hypothesis, Srinivasan et al. designed an innovative strategy. It is based on the findings by Roelke et al. [14] that found that the VT was most often preceded by late-coupled premature depolarizations. Some years after that, Saeed confirmed these results showing that 66% of VTs were initiated after a single extrasystolic beat [15].
With the idea of closely reproducing this mechanism, the Barts Sense Protocol was designed [16]. A cohort of 30 ischemic patients were prospectively included for VT ablation in two UK centres. Two substrate maps were obtained, one during sinus rhythm and another after pacing the RV every fifth beat to simulate an extra-stimulus close to VERP. There were no significant differences in the scar area when comparing the intrinsic sinus rhythm map vs. the sensed extrasystole maps, but larger areas of late activation were identified after the extrasystole (Figure 3). In 21 patients, 75 VTs were analyzed with high-density activation mapping. This allowed to illustrate that, in 80% of cases, these abnormal EGMs were situated within 10 mm of the critical VT isthmus. Those stable and mappable VTs are not always the most common presentation of VTs in such advanced substrates, but it allowed to highlight that the main advantage of that strategy compared with DEEP mapping and hidden substrate mapping is that is could be slightly more automated, with less manual reannotation of EGMs with a reasonable balance of mean RF time (approximately 30 min).
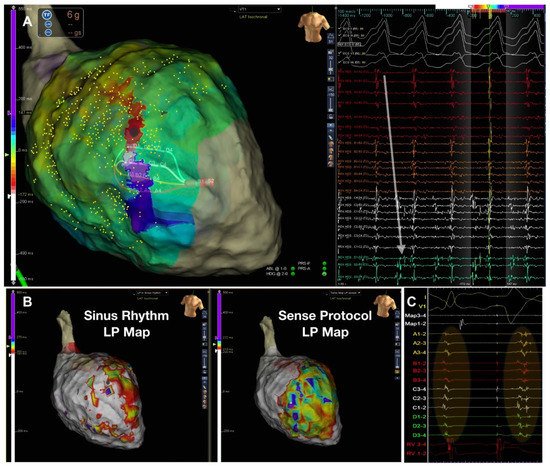
Figure 3. Figure adapted from Srinivasan et al. [16] illustrating the Barts’ sensed protocol. (A) shows a high-density VT activation map. (B) illustrates the 2 activation maps during sinus rhythm (left) with a late potential (LP) color timing map and the activation time during the sensed RV pacing beat ((B) right) showing a greater region of LPs during Bart-sense-protocol colocalizing to a greater extent with the mapped isthmus of the induced VT (A). (C) shows delay and splitting of LPs during sense protocol (second beat) is observed within the region of the diastolic pathway of VT.
6. PHYSIO-VT
Conducting channels responsible for VT circuits are based mainly on anatomical features consisting of replacement of cardiomyocytes with fibrosis and persistence of viable cells inside the scar capable of slow conduction. However, the sole presence of scar is insufficient to produce the electroanatomical setting for re-entry. Several other factors, such as cellular coupling, gap junction distribution and function and fiber disarray, can lead to a nonuniform anisotropic conduction [17][18]; whether this is manifested and present independently of the rhythm that the patient presents was the main question for the PHYSIO-VT study. The study, led by Anter E et al., focused on analyzing the location of deceleration zones as assessed by the varying possible wavefronts and whether they identified overlapping areas to target with RF [19]. It was a multicenter study with 85 ischemic patients who underwent VT ablation. Ultra-high density left ventricular mapping was performed during activation from 3 different wavefronts: SR, RV and LV pacing at 600 ms. Activation mapping during SR was performed in 90.5% patients, during RV or LV in 95.3% and from all 3 directions in 43.5%. In 43.7% patients with left bundle branch block, LV activation during SR was very similar to activation from RV, so in patient with left bundle branch block, an activation map was performed only from SR and LV. The main result was that activation from RV or LV allowed to unmask additional areas of activation slowing as compared with SR maps (mapping during SR identified only 66.2% of all activation slowing) (Figure 4). The total “accumulative slowing area” detected using the 3 different wavefronts was targeted for ablation and interestingly those patients in whom RV and LV mapping was performed in addition to SR mapping presented less incidence of appropriate ICD therapies in the follow up.
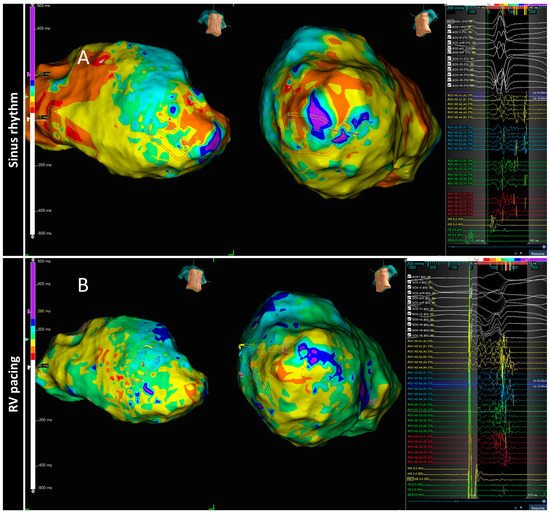
Figure 4. The spatial distribution of activation slowing is influenced by the direction of left ventricular activation. An example of two different maps performed in the same patient during two different ventricular activations: spontaneous sinus rhythm (A) and RV pacing (B). The general zone of activation slowing was similar between maps, similar to the signals shown on the right side of the panels obtained at each HD grid catheter location depicted, consequently, this area should be ablated according to the PHISIO-VT study [19].
7. Isochronal Late Activation Mapping (ILAM)
In 2015, a new substrate-based ablation strategy called ILAM (isochronal late activation mapping) was developed by Irie et al. [20]. These local activation time maps are performed during sinus rhythm (or RV pacing) and based their local activation time annotation on the latest part of the EGM, creating a map with a window starting at the earliest region of activation and ending at the latest site of activation. The overall activation time is divided into eight isochrones represented with 8 different colors, so the thickness of an isochrone is a graphical representation of the conduction velocity (distance/time). In the mechanistic study, Irie et al. [20] found that with that approach, the most likely regions to correlate with the VT isthmus were not the area with the latest activation but slow conduction regions propagating into the latest zone of activation using such an annotation criterion.
Subsequently, in 2019, Aziz et al. [21] presented a study with 120 patients who underwent VT ablation following ILAM approach and identified as relevant the deceleration zones (DZ) that were defined as regions with three different colors in less than 1 cm radius. In most instances (76%), mapping was performed during sinus rhythm and an average of 2 ± 1 DZ were identified. In cases of several DZs, the protocol encouraged to only ablate the primary DZ and check if the patient remained noninducible. DZs demonstrated a high correlation with VT isthmus, colocalized to successful VT termination sites in 95% of cases (Figure 5) and VT freedom at 12 ± 10 months of follow up was 70%, with ischemic patients having better VT-freedom (80%) than non-ischemic patients (63%).
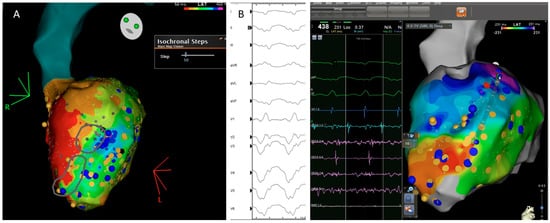
Figure 5. Correlation between the ventricular tachycardia (VT) circuit with critical diastolic pathway (A) and deceleration zone (DZ) location during sinus rhythm as depicted during ILAM mapping (B). Late isochronal activation map is shown in the left side of the panel (8 isochrones). Two deceleration zones are observed (more than 3 isochrones in less than 1 cm radius) in the anterior wall. The termination site of VT (on the right) colocalized to the DZs.
References
- Mountantonakis, S.E.; Park, R.E.; Frankel, D.S.; Hutchinson, M.D.; Dixit, S.; Cooper, J.; Callans, D.; Marchlinski, F.E.; Gerstenfeld, E.P. Relationship Between Voltage Map “Channels” and the Location of Critical Isthmus Sites in Patients with Post-Infarction Cardiomyopathy and Ventricular Tachycardia. J. Am. Coll. Cardiol. 2013, 61, 2088–2095.
- Tung, R.; Vaseghi, M.; Frankel, D.S.; Vergara, P.; Di Biase, L.; Nagashima, K.; Yu, R.; Vangala, S.; Tseng, C.-H.; Choi, E.-K.; et al. Freedom from recurrent ventricular tachycardia after catheter ablation is associated with improved survival in patients with structural heart disease: An International VT Ablation Center Collaborative Group study. Heart Rhythm 2015, 12, 1997–2007.
- Ghanbari, H.; Baser, K.; Yokokawa, M.; Stevenson, W.; Della Bella, P.; Vergara, P.; Deneke, T.; Kuck, K.-H.; Kottkamp, H.; Fei, S.; et al. Noninducibility in Postinfarction Ventricular Tachycardia as an End Point for Ventricular Tachycardia Ablation and Its Effects on Outcomes. Circ. Arrhythmia Electrophysiol. 2014, 7, 677–683.
- Lammers, W.J.; Kirchhof, C.; Bonke, F.I.; Allessie, M.A. Vulnerability of rabbit atrium to reentry by hypoxia. Role of inhomogeneity in conduction and wavelength. Am. J. Physiol. Heart Circ. Physiol. 1992, 262, H47–H55.
- Segal, O.R.; Chow, A.W.C.; Peters, N.S.; Davies, D.W. Mechanisms that initiate ventricular tachycardia in the infarcted human heart. Heart Rhythm 2010, 7, 57–64.
- Jackson, N.; Gizurarson, S.; Viswanathan, K.; King, B.; Massé, S.; Kusha, M.; Porta-Sanchez, A.; Jacob, J.R.; Khan, F.; Das, M.; et al. Decrement Evoked Potential Mapping: Basis of a Mechanistic Strategy for Ventricular Tachycardia Ablation. Circ. Arrhythmia Electrophysiol. 2015, 8, 1433–1442.
- Tusscher, K.H.W.J.T.; Noble, D.; Noble, P.J.; Panfilov, A.V. A model for human ventricular tissue. Am. J. Physiol. Heart Circ. Physiol. 2004, 286, H1573–H1589.
- Porta-Sanchez, A.; Jackson, N.; Lukac, P.; Kristiansen, S.B.; Nielsen, J.M.; Gizurarson, S.; Massé, S.; Labos, C.; Viswanathan, K.; King, B.; et al. Multicenter Study of Ischemic Ventricular Tachycardia Ablation with Decrement-Evoked Potential (DEEP) Mapping with Extra Stimulus. JACC Clin. Electrophysiol. 2018, 4, 307–315.
- Acosta, J.; Andreu, D.; Penela, D.; Cabrera, M.; Carlosena, A.; Korshunov, V.; Vassanelli, F.; Borras, R.; Martínez, M.; Fernández-Armenta, J.; et al. Elucidation of hidden slow conduction by double ventricular extrastimuli: A method for further arrhythmic substrate identification in ventricular tachycardia ablation procedures. Europace 2016, 20, 337–346.
- Acosta, J.; Soto-Iglesias, D.; Jáuregui, B.; Armenta, J.F.; Penela, D.; Frutos-López, M.; Arana-Rueda, E.; Pedrote, A.; Mont, L.; Berruezo, A. Long-term outcomes of ventricular tachycardia substrate ablation incorporating hidden slow conduction analysis. Heart Rhythm 2020, 17, 1696–1703.
- Riva, M.D.; Naruse, Y.; Ebert, M.; Androulakis, A.F.A.; Tao, Q.; Watanabe, M.; Wijnmaalen, A.P.; Venlet, J.; Brouwer, C.; Trines, S.A.; et al. Targeting the Hidden Substrate Unmasked by Right Ventricular Extrastimulation Improves Ventricular Tachycardia Ablation Outcome After Myocardial Infarction. JACC Clin. Electrophysiol. 2018, 4, 316–327.
- Oduneye, S.O.; Pop, M.; Shurrab, M.; Biswas, L.; Ramanan, V.; Barry, J.; Crystal, E.; A Wright, G. Distribution of abnormal potentials in chronic myocardial infarction using a real time magnetic resonance guided electrophysiology system. J. Cardiovasc. Magn. Reson. 2015, 17, 27.
- Shariat, M.H.; Gupta, D.; E Gul, E.; Glover, B.; Hashemi, J.; Abdollah, H.; Baranchuk, A.; Simpson, C.; A Michael, K.; Redfearn, D.P.; et al. Ventricular substrate identification using close-coupled paced electrogram feature analysis. Europace 2018, 21, 492–501.
- Roelke, M.; Garan, H.; McGovern, B.A.; Ruskin, J.N. Analysis of the initiation of spontaneous monomorphic ventricular tachycardia by stored intracardiac electrograms. J. Am. Coll. Cardiol. 1994, 23, 117–122.
- Saeed, M.; Link, M.S.; Mahapatra, S.; Mouded, M.; Tzeng, D.; Jung, V.; Contreras, R.; Swygman, C.; Homoud, M.; Estes, N.; et al. Analysis of intracardiac electrograms showing monomorphic ventricular tachycardia in patients with implantable cardioverter-defibrillators. Am. J. Cardiol. 2000, 85, 580–587.
- Srinivasan, N.T.; Garcia, J.; Schilling, R.J.; Ahsan, S.; Babu, G.G.; Ang, R.; Dhinoja, M.B.; Hunter, R.J.; Lowe, M.; Chow, A.W.; et al. Multicenter Study of Dynamic High-Density Functional Substrate Mapping Improves Identification of Substrate Targets for Ischemic Ventricular Tachycardia Ablation. JACC Clin. Electrophysiol. 2020, 6, 1783–1793.
- Peters, N.S.; Coromilas, J.; Hanna, M.S.; Josephson, M.E.; Costeas, C.; Wit, A.L. Characteristics of the Temporal and Spatial Excitable Gap in Anisotropic Reentrant Circuits Causing Sustained Ventricular Tachycardia. Circ. Res. 1998, 82, 279–293.
- Rohr, S. Myofibroblasts in diseased hearts: New players in cardiac arrhythmias? Heart Rhythm 2009, 6, 848–856.
- Anter, E.; Neuzil, P.; Reddy, V.Y.; Petru, J.; Park, K.M.; Sroubek, J.; Leshem, E.; Zimetbaum, P.J.; Buxton, A.E.; Kleber, A.G.; et al. Ablation of Reentry-Vulnerable Zones Determined by Left Ventricular Activation from Multiple Directions: A Novel Approach for Ventricular Tachycardia Ablation: A Multicenter Study (PHYSIO-VT). Circ. Arrhythmia Electrophysiol. Lippincott Williams Wilkins 2020, 13, 539–550.
- Irie, T.; Yu, R.; Bradfield, J.S.; Vaseghi, M.; Buch, E.F.; Ajijola, O.; Macias, C.; Fujimura, O.; Mandapati, R.; Boyle, N.G.; et al. Relationship Between Sinus Rhythm Late Activation Zones and Critical Sites for Scar-Related Ventricular Tachycardia. Circ. Arrhythmia Electrophysiol. 2015, 8, 390–399.
- Aziz, Z.; Shatz, D.; Raiman, M.; Upadhyay, G.A.; Beaser, A.D.; Besser, S.A.; Shatz, N.A.; Fu, Z.; Jiang, R.; Nishimura, T.; et al. Targeted Ablation of Ventricular Tachycardia Guided by Wavefront Discontinuities during Sinus Rhythm: A New Functional Substrate Mapping Strategy. Circulation 2019, 140, 1383–1397.
More
Information
Subjects:
Cardiac & Cardiovascular Systems
Contributors
MDPI registered users' name will be linked to their SciProfiles pages. To register with us, please refer to https://encyclopedia.pub/register
:
View Times:
1.9K
Revisions:
2 times
(View History)
Update Date:
19 Sep 2022
Table of Contents


Notice
You are not a member of the advisory board for this topic. If you want to update advisory board member profile, please contact office@encyclopedia.pub.
OK
Confirm
Only members of the Encyclopedia advisory board for this topic are allowed to note entries. Would you like to become an advisory board member of the Encyclopedia?
Yes
No
${ textCharacter }/${ maxCharacter }
Submit
Cancel
Back
Comments
${ item }
|
${ item.createdUser.fullName }
${ item.createdAt }
${ item.vote }
${ item.reply }
Delete
${ reply.createdUser.fullName }
${ reply.createdAt }
${ reply.vote }
Delete
There is no reply to this comment~
${ item.replyTextCharacter }/${ item.replyMaxCharacter }
Submit
Cancel
More
No more~
There is no comment~
${ textCharacter }/${ maxCharacter }
Submit
Cancel
${ selectedItem.replyTextCharacter }/${ selectedItem.replyMaxCharacter }
Submit
Cancel
Confirm
Are you sure to Delete?
Yes
No