1. Geographical Distribution of Study Sites
Many studies have been conducted in the last decade to investigate the impacts of urban green infrastructure (UGI) in terms of thermal comfort and energy consumption. A study in Turin, Italy showed that the use of green roofs has the potential to decrease the land surface temperature by 2.7 °C, with an energy saving of approximately 14 GWh/year
[1]. In Toronto, the average reduction in peak temperatures at the pedestrian level ranged between 0.4 °C and 0.7 °C when using green roofs, resulting in an energy saving of 11.53 kWh/year per unit area
[2]. The green roof offers distinct improvements in terms of both thermal comfort and energy consumption; however, the performance differences between two cities can be huge. It is important to investigate the characteristic of a geographic location to identify potential factors that might influence the performance of the UGI.
1.1. Regional Trends
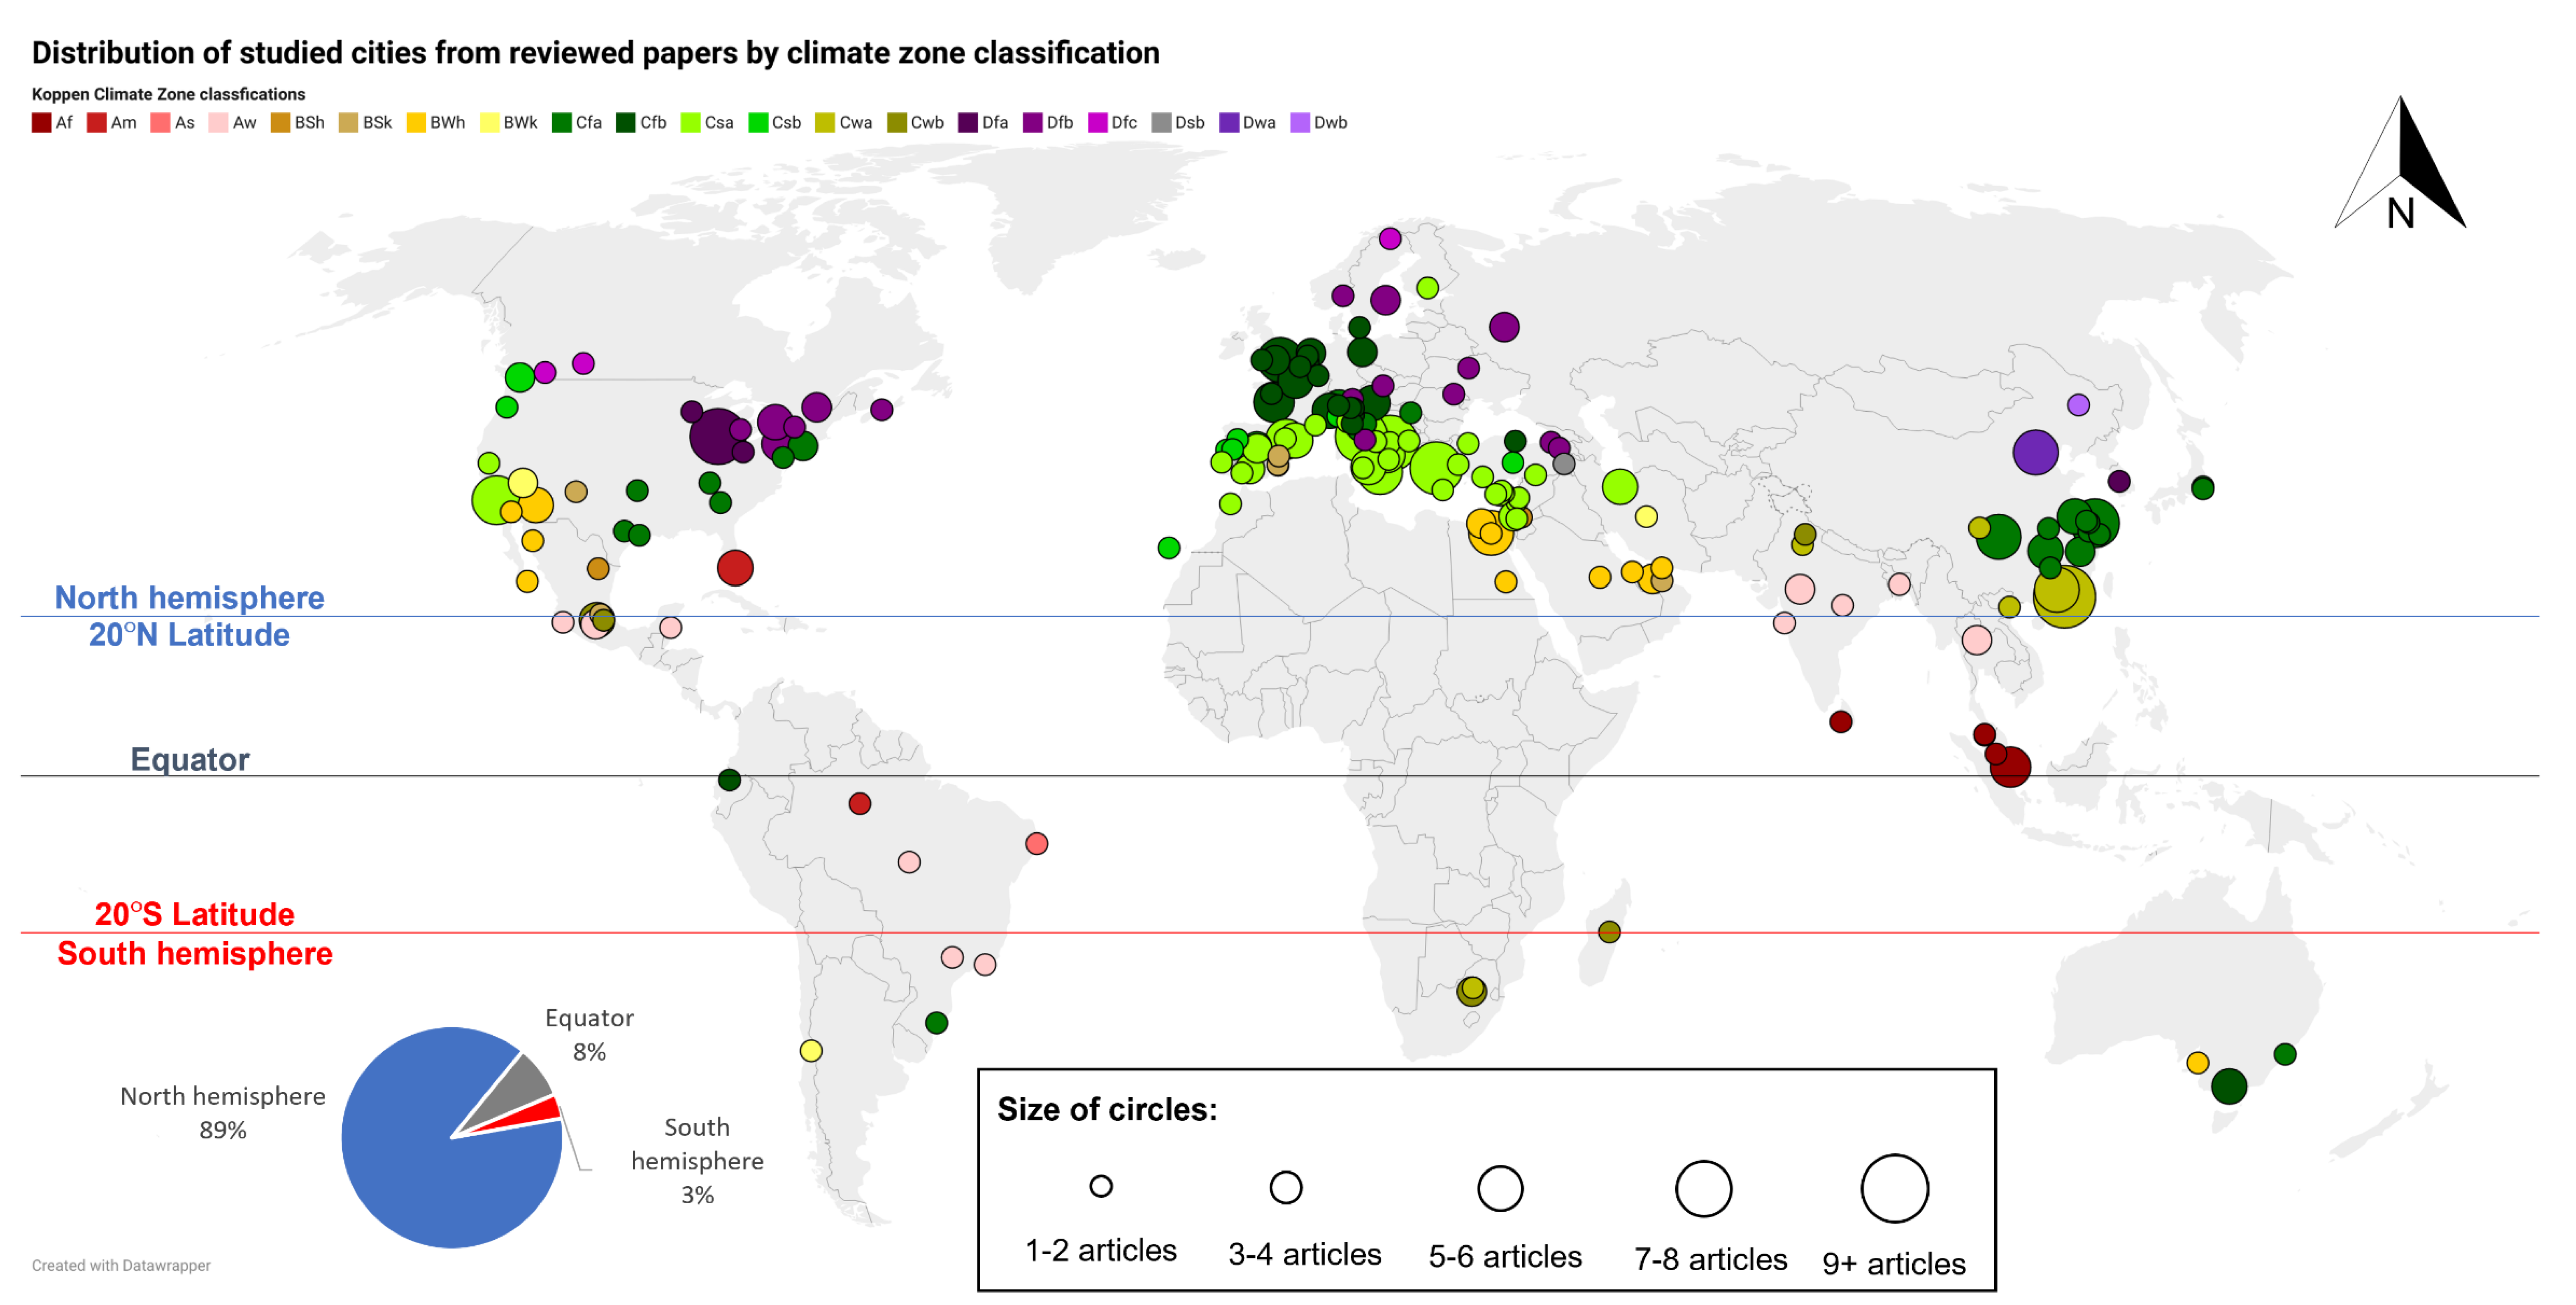
The map in Figure 1 illustrated the locations and the corresponding climate zones of the studied cities. The results show that up to 89% of the studied sites are in the northern hemisphere, with 8% of the studies being located around the equatorial regions; only 3% of studies have been conducted in the southern hemisphere.
Figure 1. The world map illustrating the distribution of the studied cities in the reviewed papers, according to the updated Köppen-Geiger climate classification scheme in 2016
[3]. In this research, the area above the 20° N latitude line is considered to be the northern hemisphere, while the area below the 20° S latitude line is considered to be the southern hemisphere; between the two is considered the equatorial region. Map edited using Datawrapper website. Available online:
https://www.datawrapper.de/ (accessed on 7 May 2022).
Figure 1 also illustrated the distribution according to climate zones, based on the Köppen–Geiger climate classification system
[3]. The majority of the studies were conducted in a temperate climate (Type C), as mentioned in 107 articles, while equatorial (Type E), arid (Type A), and continental (Type D) climates shared a similar number of studies, with 21, 24, and 26 articles, respectively. There is as yet no study conducted for a polar climate, mainly because suitable vegetation will not survive in such conditions. Under each climate type, the subsequent climate zone can be defined by the figures for precipitation and temperature.
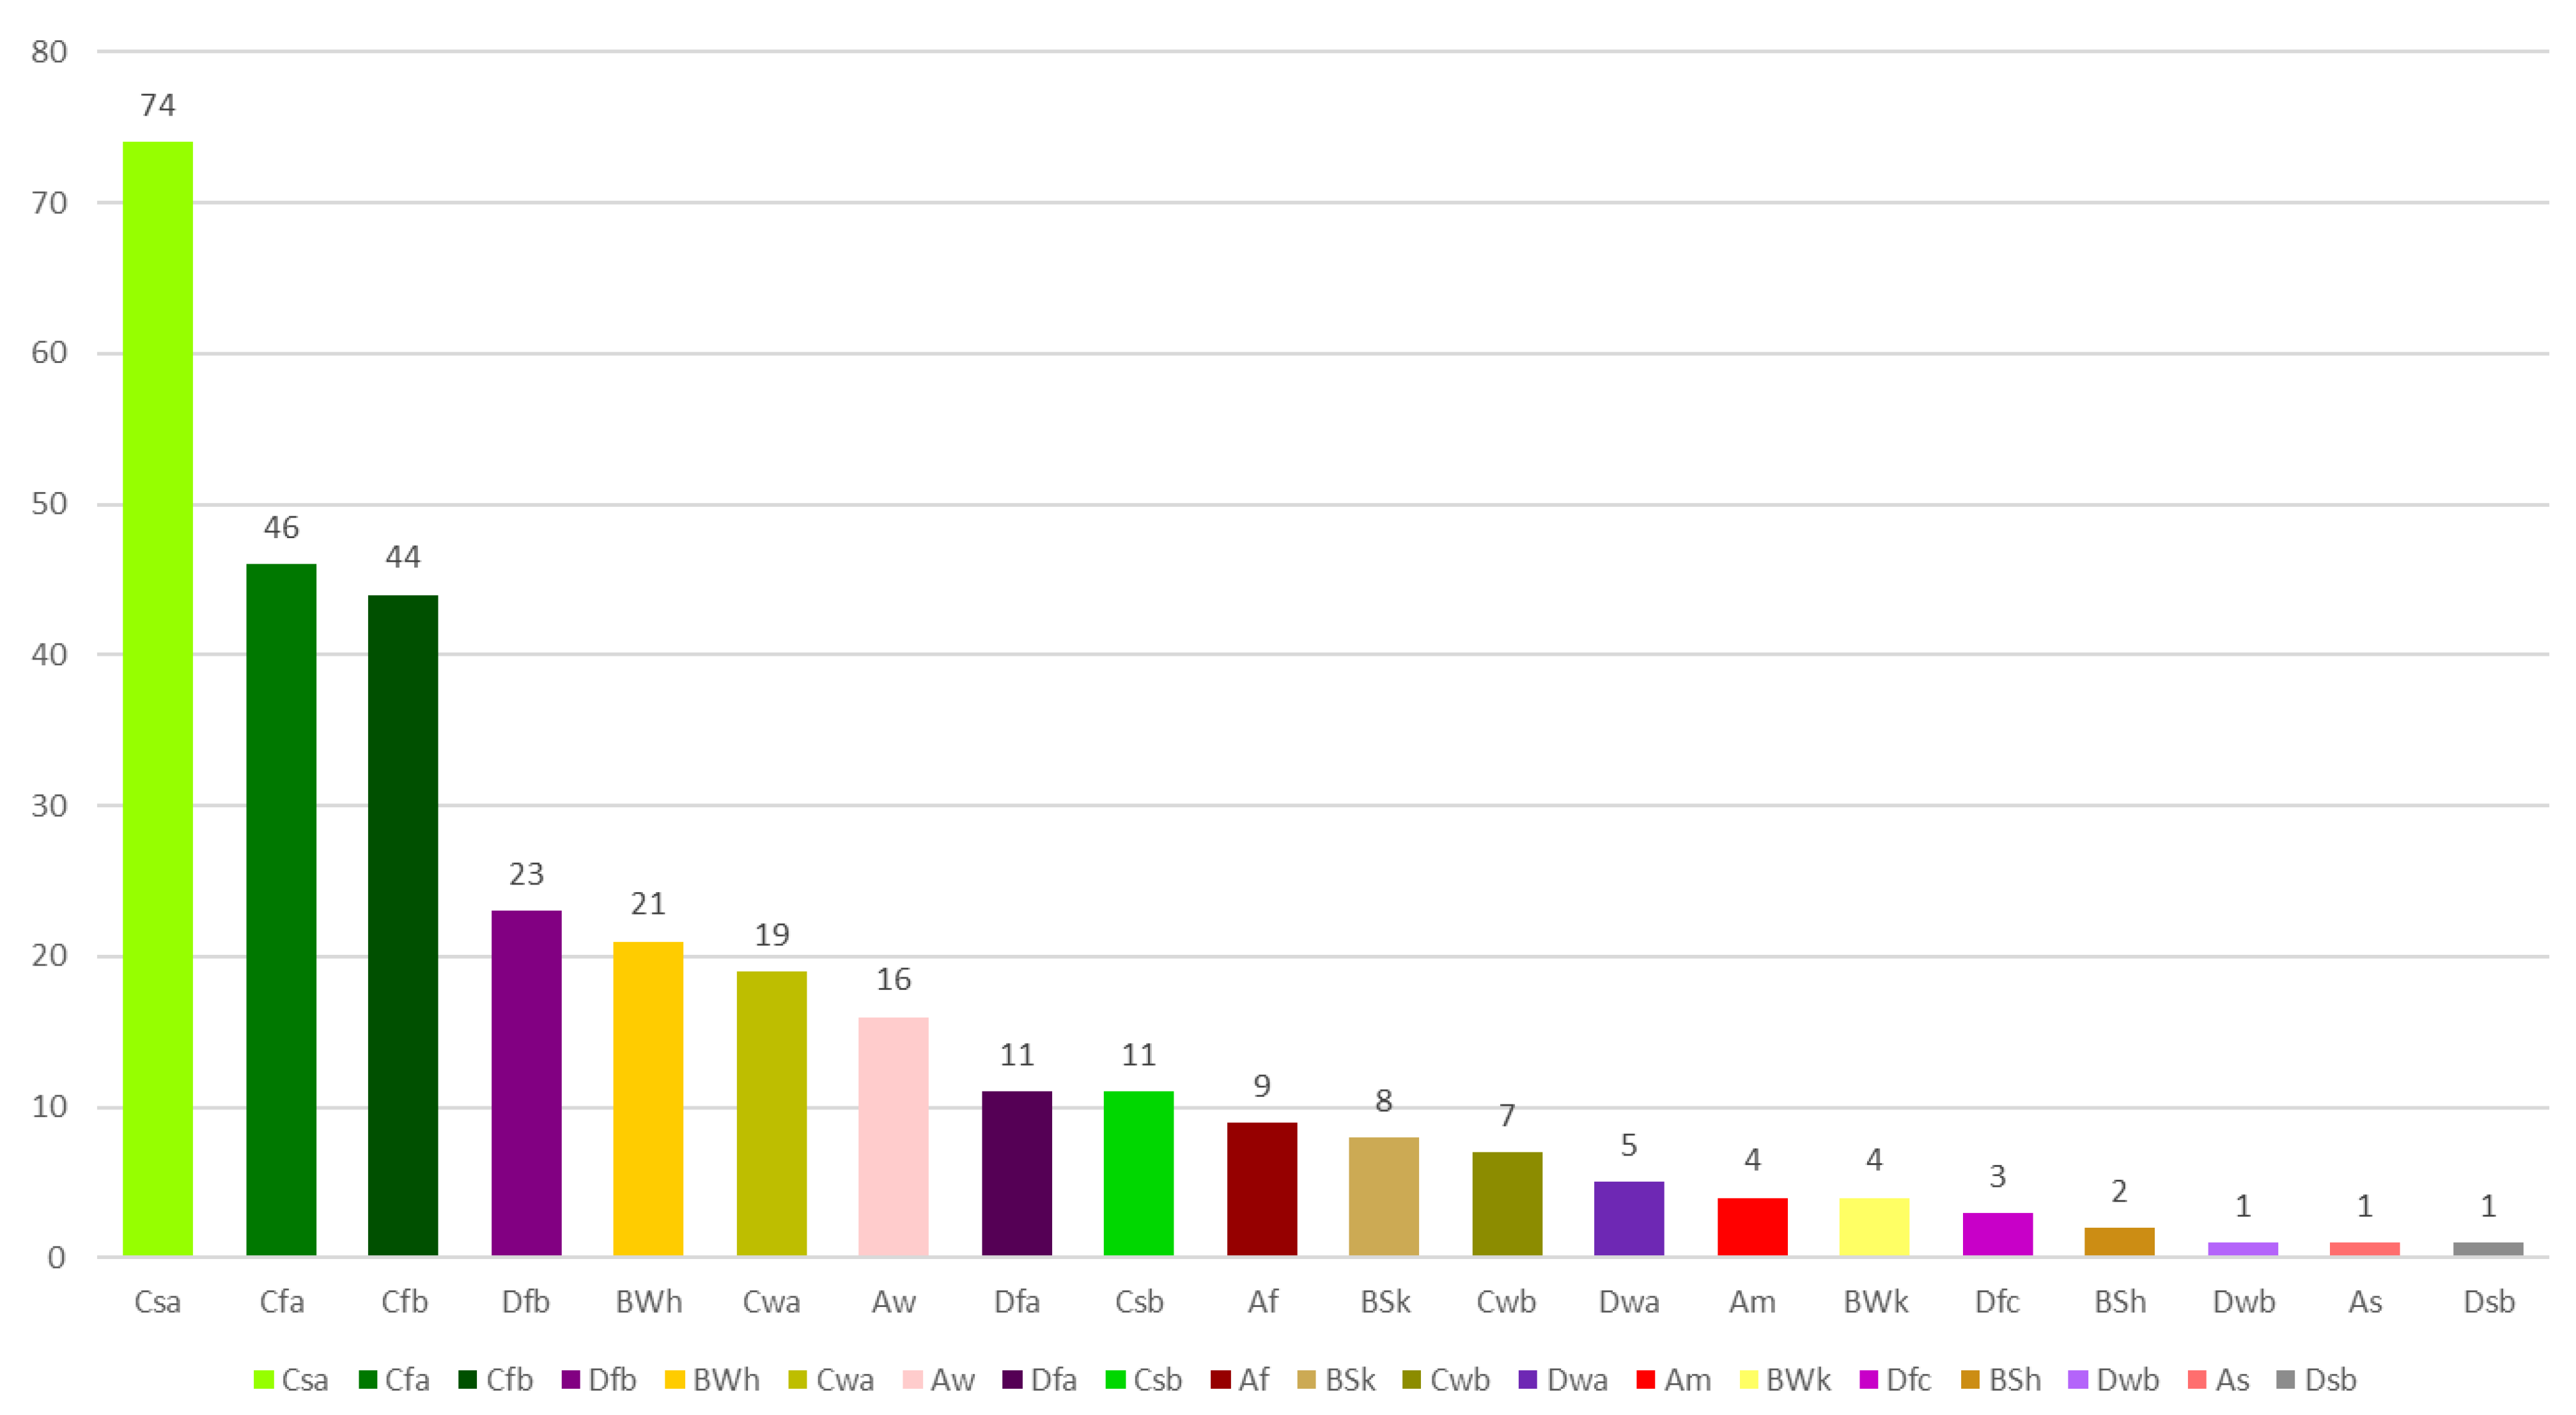
Figure 2 provides the distribution of the studied sites according to the individual climate zone. The most frequently studied climate zone is Csa (a temperate climate with dry and hot summers), with 74 articles; these studies are concentrated around the Mediterranean Sea region, which has dry and hot summers. Both Cfa (a temperate climate with a fully humid and hot summer) and Cfb (a temperate climate with a fully humid and warm summer) have a similar number of studies, at 46 and 44, respectively. The studies on these climate zones are mainly conducted in Europe, the east coast of Asia, and a scattering around North America. In terms of the Type D climate, the climate zone Dfb (a humid continental climate with warm summers) is studied most frequently, with 23 articles scattered around North America and northeast Europe. In terms of the Type A climate, the climate zone BWh (a deserts climate with dry and hot weather all year) is examined in 21 studies that are mainly located in the Middle East and the west coast of North America.
Figure 2. The distribution of Köppen-Geiger climate classification zones according to the studied locations.
Different climate zones require specific considerations that will greatly affect the UGI design parameters. For example, UGI presents a good passive cooling strategy in arid climate areas; however, the design requires more irrigation as the annual rainfall is limited. Cities around the equatorial region have less distinct or even have no seasonal changes compared to other climate zones; instead of having four seasons, the climate is usually divided into wet and dry seasons or the monsoon season. Therefore, extra considerations regarding the loading are required in the GR design, due to the excess rainfall. Unlike a GR, a VGS is more affected by the building’s orientation; the vegetation in a different orientation might grow differently because of changes in the daily solar path. A change in location between the northern and southern hemispheres will have an opposite impact on VGS. Since most of the studied sites were in the northern hemisphere, most of the VGS studies were focused on investigating the south- (32%) and west-facing (24%) facades, only 11% of VGS studies have investigated all four orientations (north, east, south, and west), and only 1 paper simulated eight orientations.
1.2. Top-Performing Countries and Cities
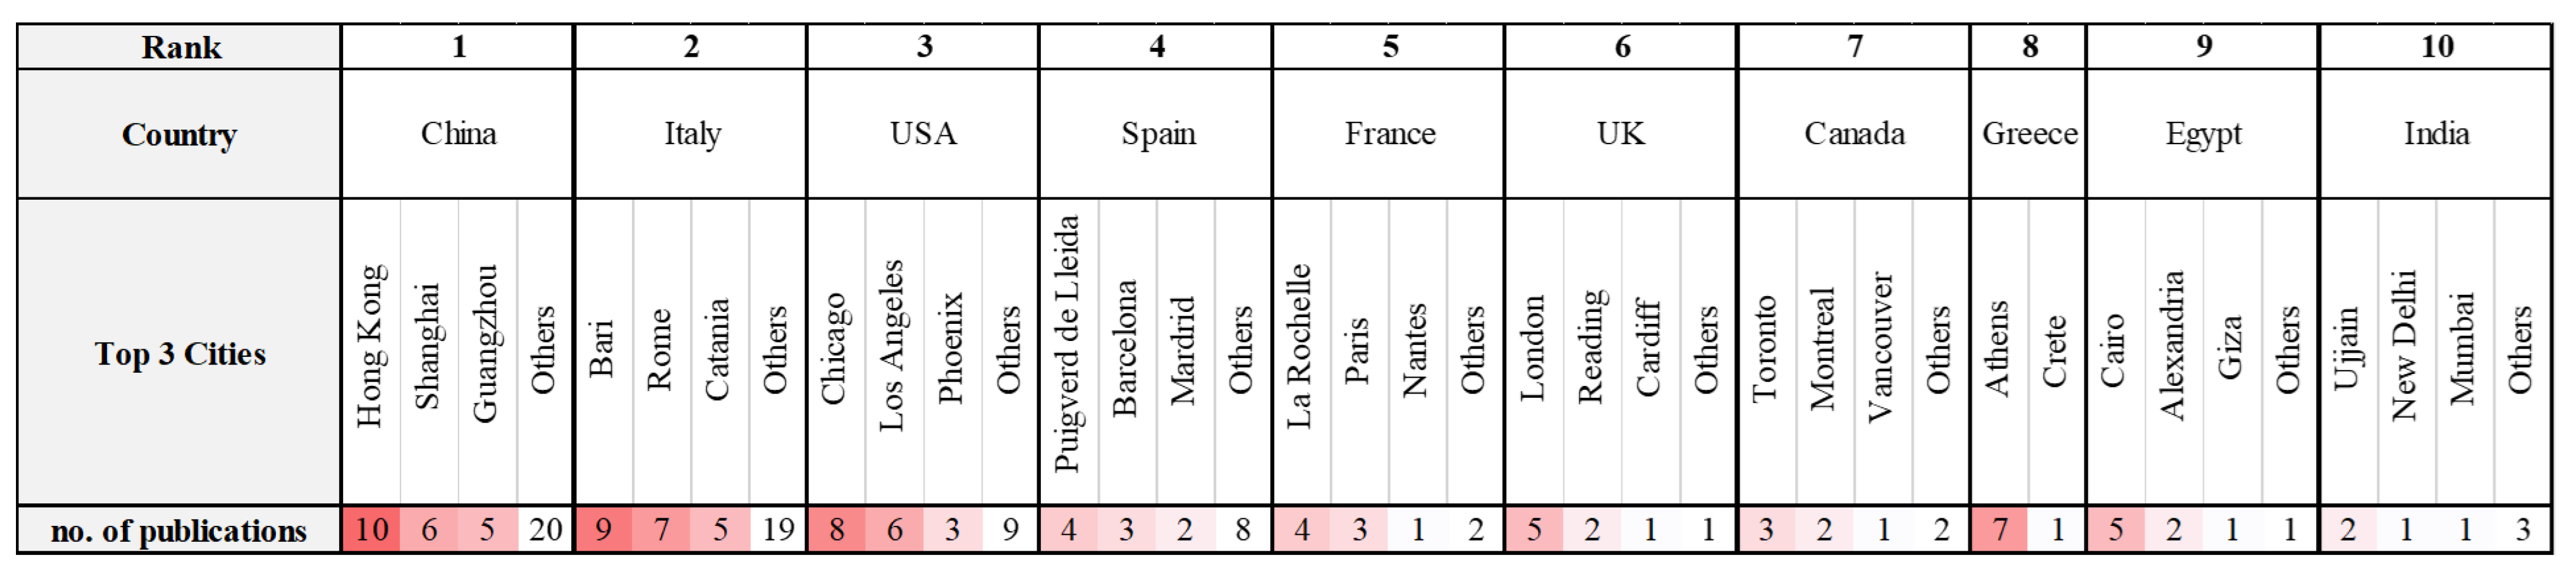
Each country and city has a different level of progress in UGI development, depending on the corresponding socioeconomic factors and the level of government interest. The top ten countries with the highest numbers of UGI research publications are shown in Figure 3. From the systematic review, the results show that China has published the most studies in the last decade, with 41 articles; most of the studies in China were conducted in Hong Kong, Shanghai, and Guangzhou. Italy is the second most popular country in terms of UGI studies, with 40 articles; Bari, Rome, and Catania are the most popular Italian cities in terms of UGI research. The third country in terms of the most UGI publications is the United States of America (USA) with 26 articles; Chicago, Los Angeles, and Phoenix are the most frequently studied US cities.
Figure 3. The ranking of the top 10 countries with the most UGI research publications, published between 2010 and 2021, with additional information on the top 3 cities in each country.
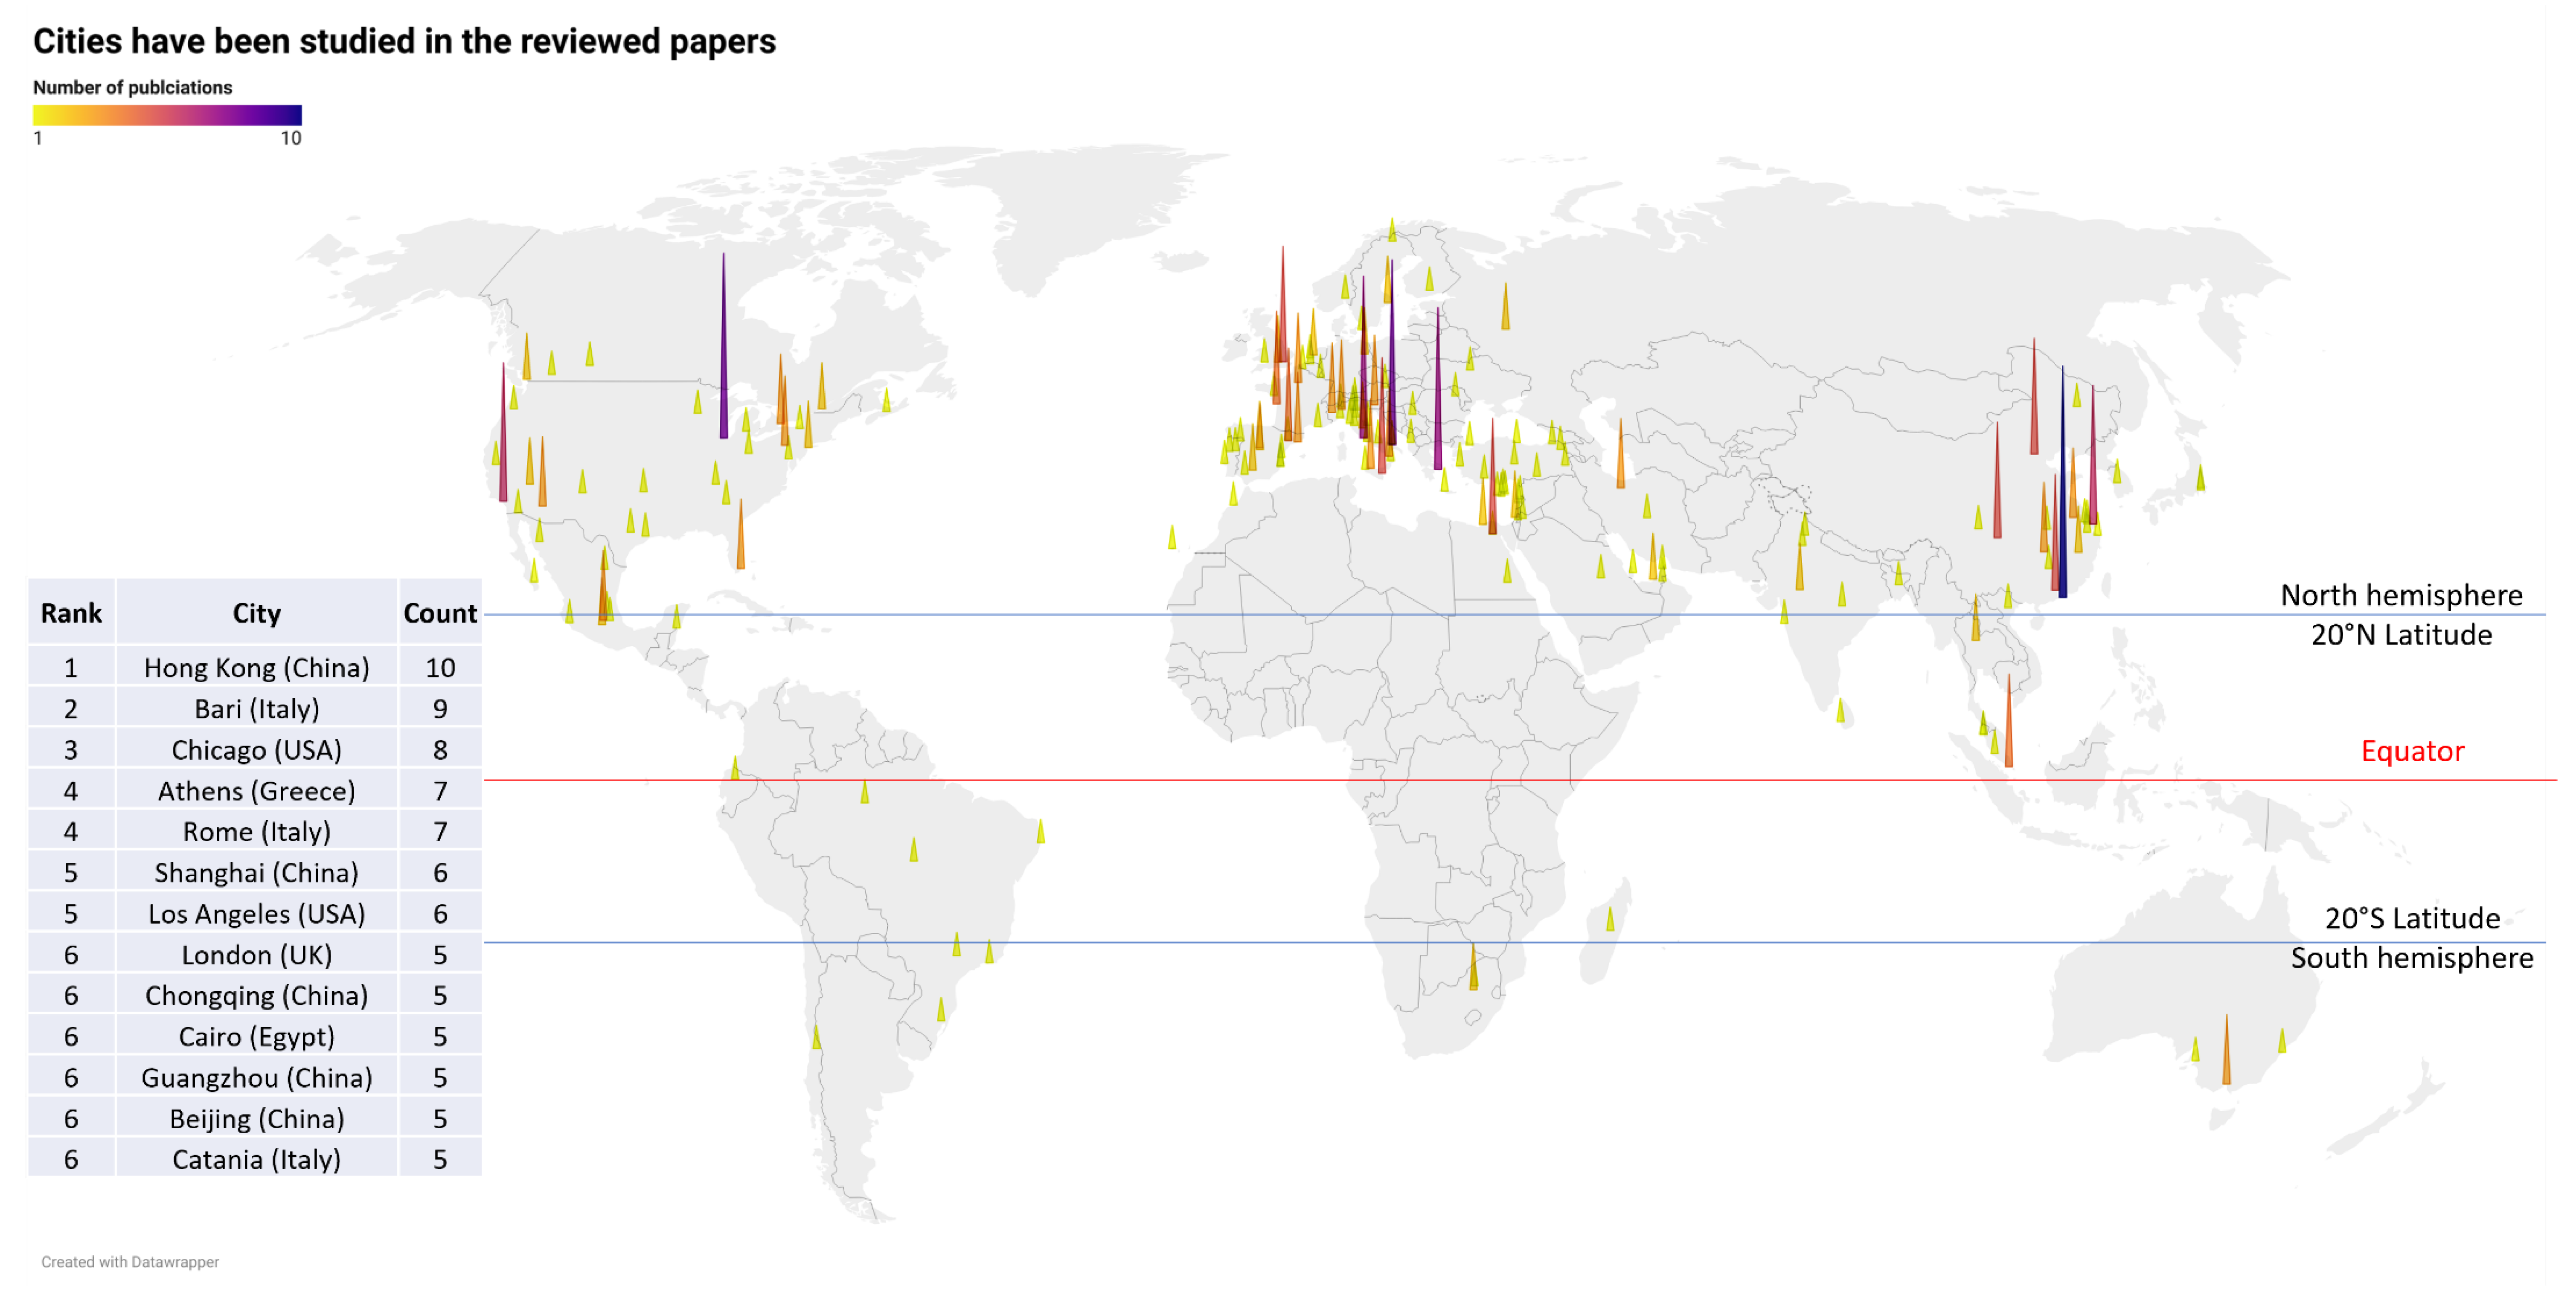
In total, 177 separate cities across 50 countries around the world were identified; as there are some cities that have been studied more than once, a total of 310 counts in terms of the studied locations were recorded. The map in Figure 4 illustrates the distribution of the studied cities and the number of publications that are represented. It shows that most of the studies are conducted in European countries and those countries surrounding the Mediterranean Sea, typically, the United Kingdom (UK), France, Spain, Italy, Egypt, and Greece. Away from Europe, the majority of UGI studies are conducted in southeast Asian and northern American countries, such as China, India, Singapore, the US, and Canada. The rest of the world shows relatively fewer publications that are scattered around the globe; only Brazil, Mexico, and Australia exhibit slightly more UGI studies than the other countries.
Figure 4. A world map illustrating the distribution of the studied cities in the reviewed papers. Map edited using Datawrapper website. Available online:
https://www.datawrapper.de/ (accessed on 7 May 2022).
To understand why these countries are more advanced in terms of UGI research compared to the others, the following factors have been considered:
-
The overall number of publications, by country;
-
The gross domestic product (GDP);
-
Urban population;
-
Urban land area;
-
Primary energy consumption:
-
Greenhouse gas and carbon dioxide emissions
[4].
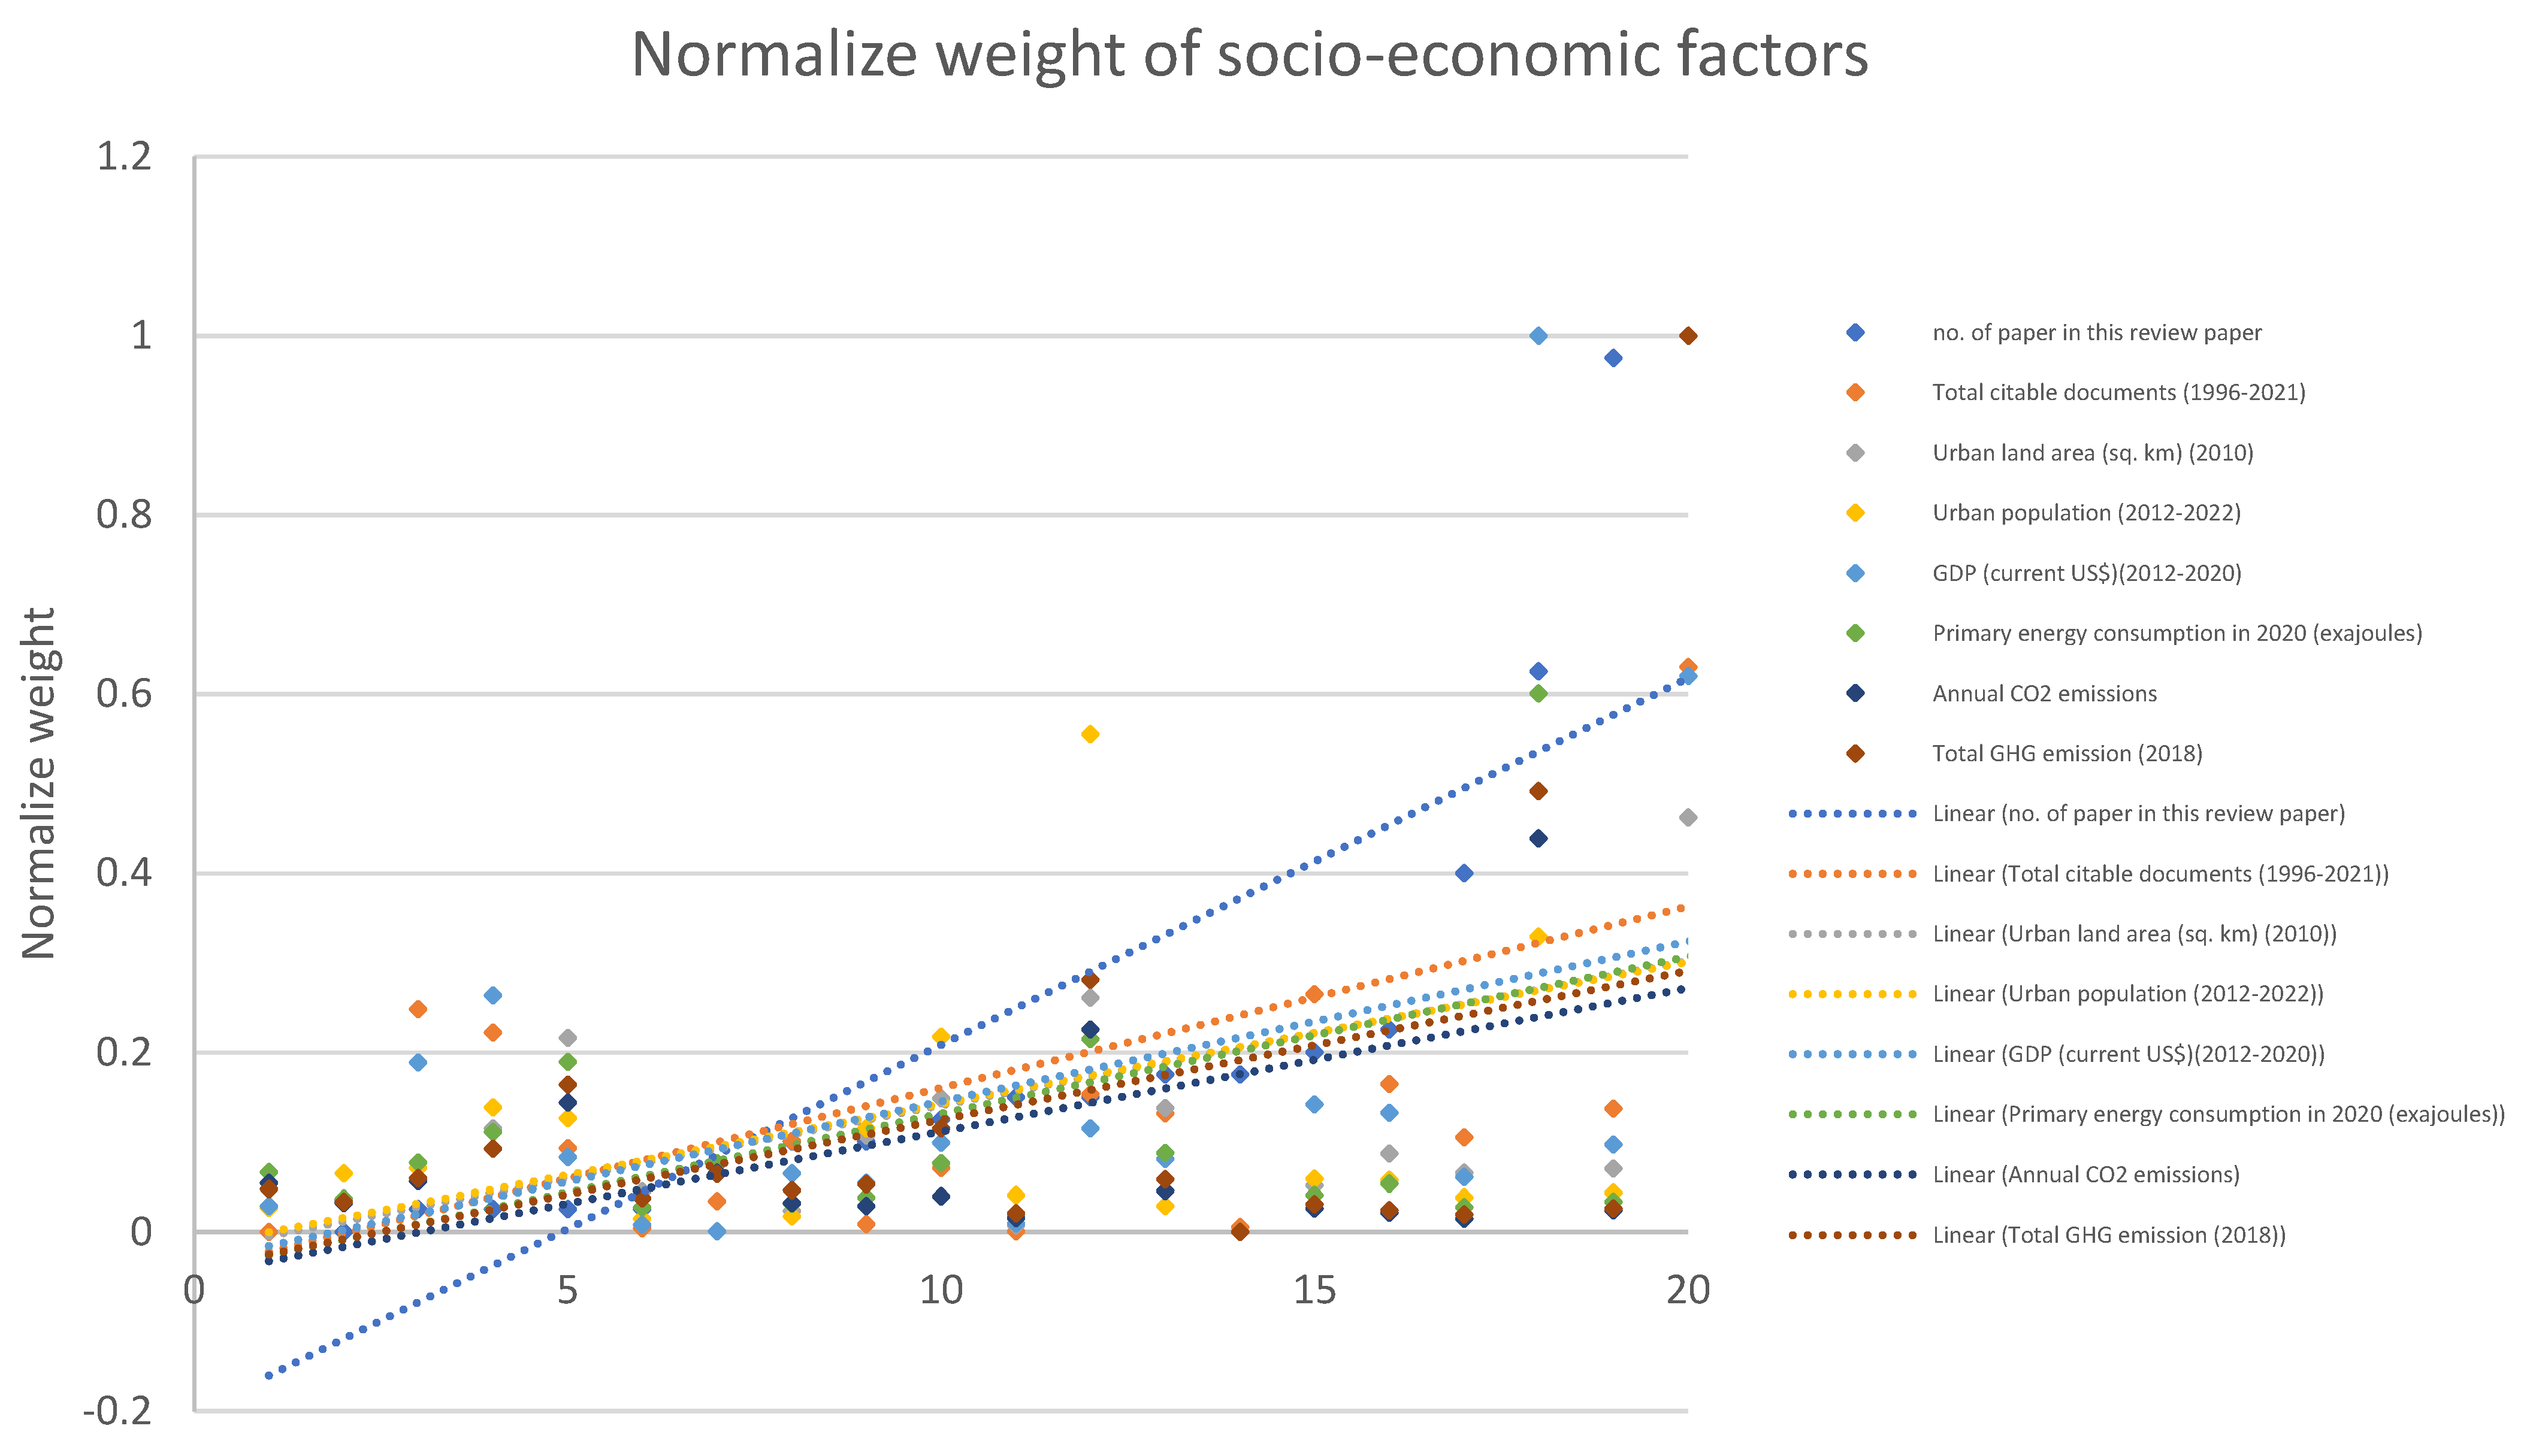
Based on the above factors, a normalized weight for each factor was generated to compare the patterns in the top 20 countries with the highest numbers of research publications. The normalizing factors are shown in Figure 5, with the trendlines identifying similar patterns. China, the US, Italy, India, Canada, and Brazil demonstrate stronger relationships with the above factors. It is worth mentioning that Germany and Japan were not on the top ten list of countries. With further investigation, it was found that although Germany and Japan do have a fair number of UGI studies, the research focus of this research is on the combined parameters of “electrical energy” and “thermal comfort” performance, in which areas Germany ranks below 20 and Japan ranks 14. As Germany and Japan are not among the top ten countries in the screening process of this research, this does not affect the primary conclusions of this research.
Figure 5. The normalized weight of the socioeconomic factors.
In the case of the Russian Federation, UGI is not the focus of research in the country because of various factors; it has a low urban land area percentage and UGIs do not provide many benefits in an area with an extremely cold climate.
2. Study Parameters
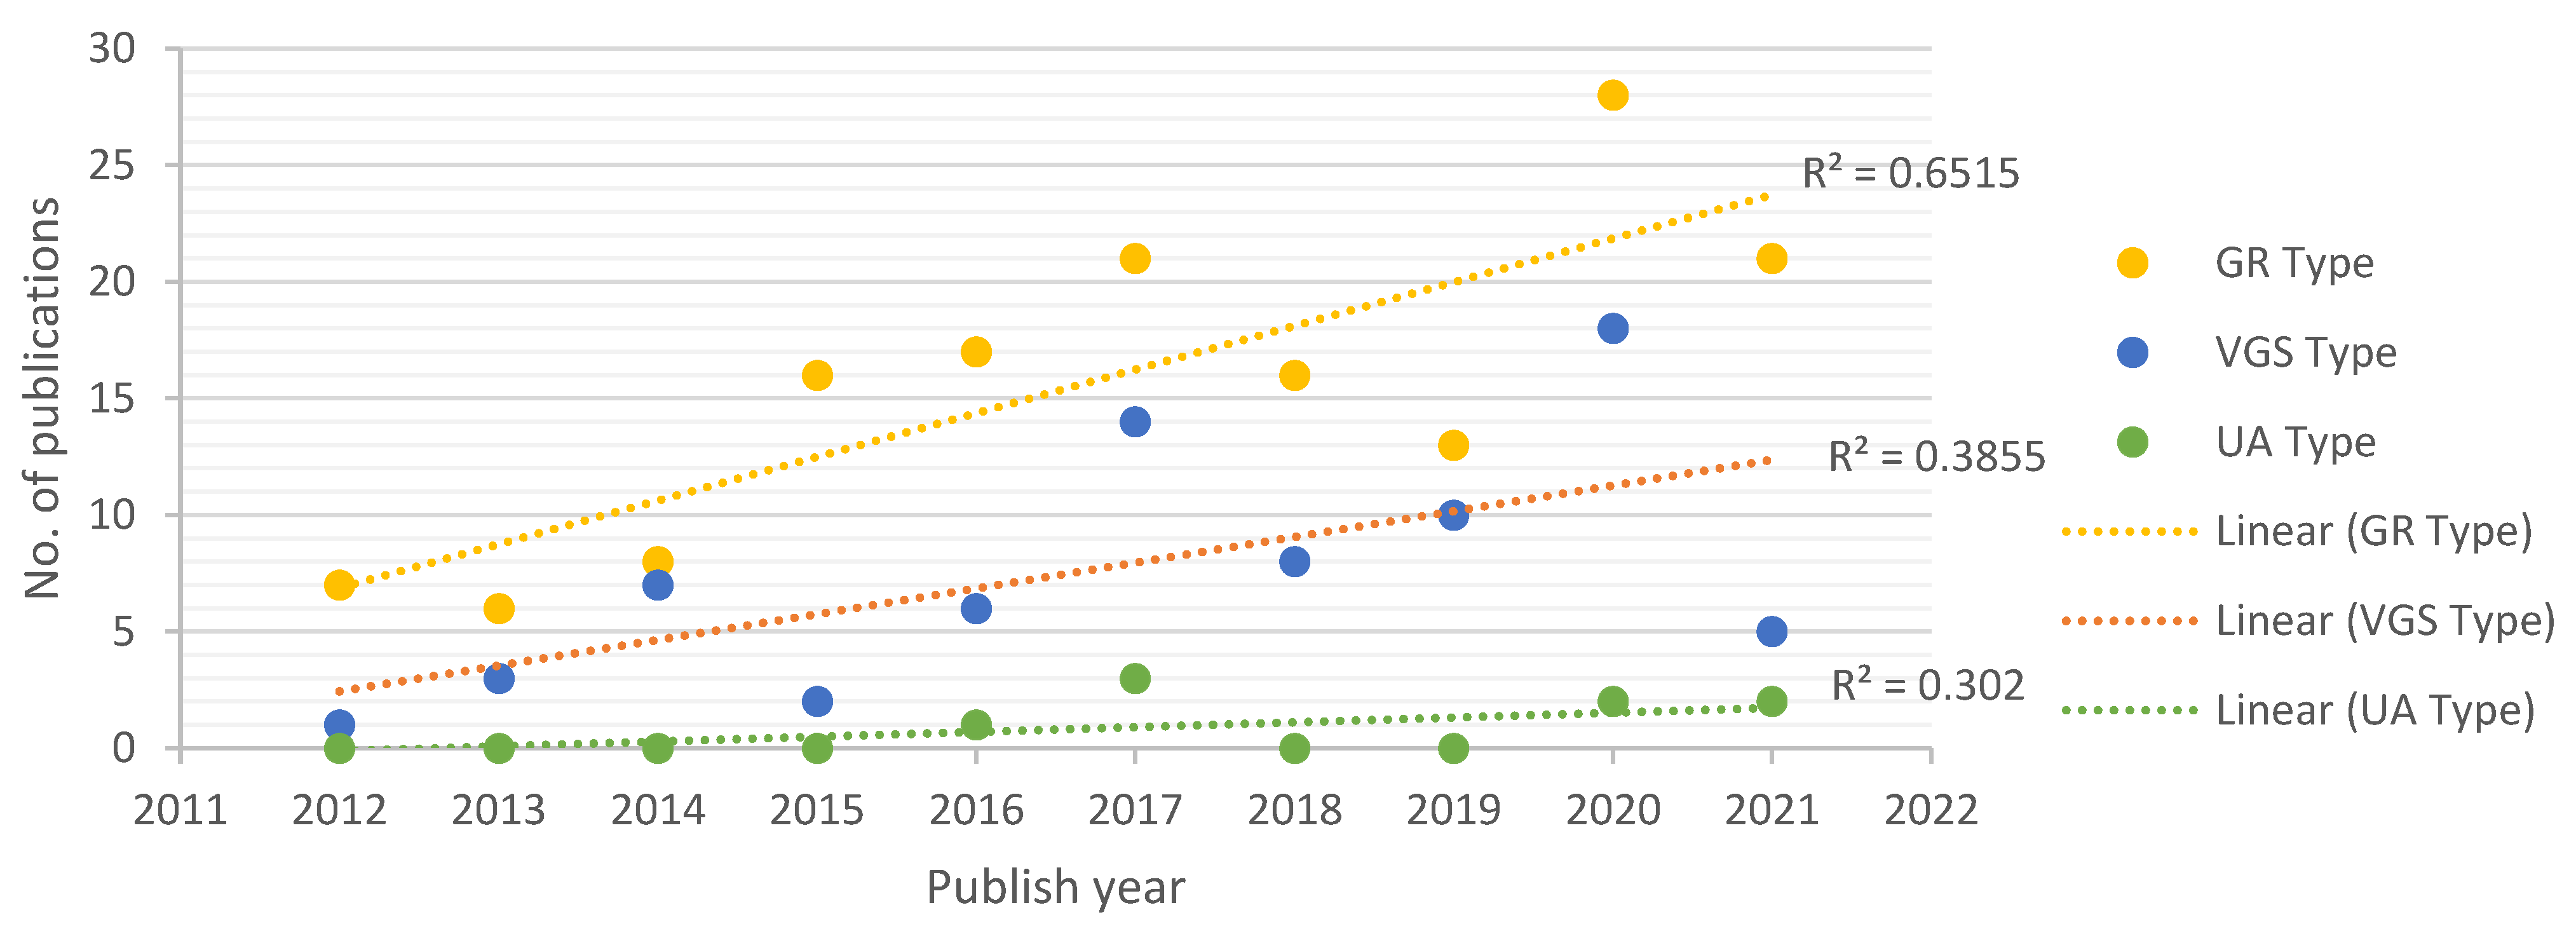
Different types of UGI require different design parameters to achieve ideal effectiveness; understanding the current practices will help to standardize the design parameters in the future. Figure 6 shows the number of reviewed papers that have been published between 2012 and 2021, according to the individual UGI categories. Figure 6 shows a general increasing trend for all three UGI categories. There are far more publications studying the GR types, compared with the VGS and UA types.
Figure 6. Distribution of the reviewed papers published between 2012 to 2021, according to their UGIB categories.
2.1. UGI Categories and Types
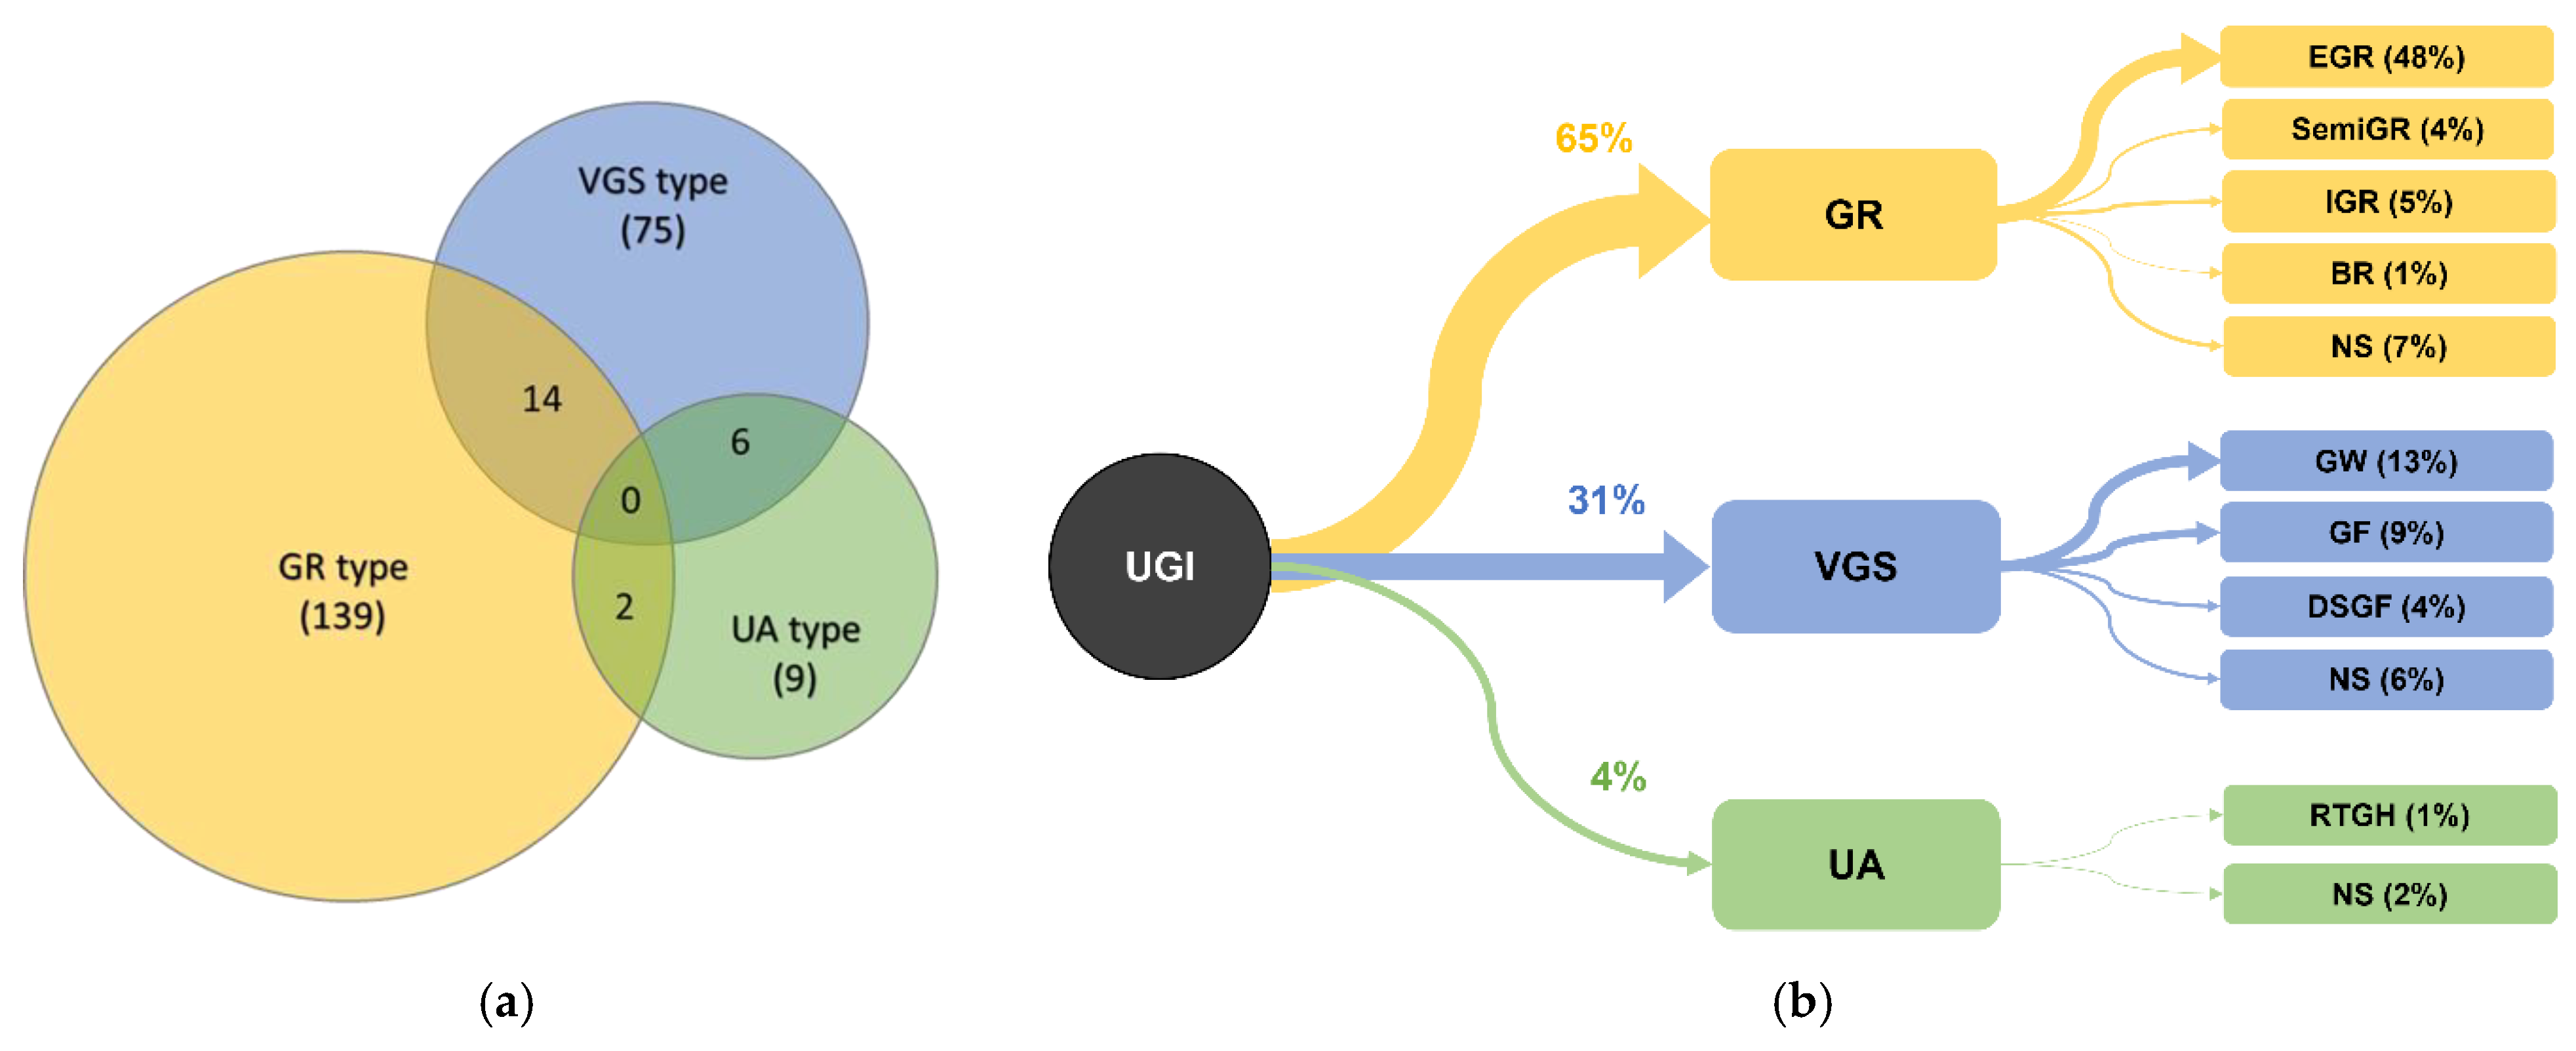
The Venn diagram in Figure 7a illustrates the proportions of the three different types of UGI from the 217 reviewed papers. The majority of papers focused only on GR, with 139 papers in total. In total, 75 papers focused only on VGS, and only 9 papers focused solely on UA. A small number of papers studied more than one UGI type, with 14 papers studying both GR and VGS and 2 papers studying both GR and UA, while 6 papers studied both VGS and UA; none have studied all three types of UGI.
Figure 7. (a) Venn diagram of the number of studies, based on the three main UGI categories; (b) the distribution of UGI studies according to the categories and subcategories.
The subcategory distribution of UGI types is illustrated in
Figure 7b. The most popular type of GR to be studied was the EGR (48%), while the SemiGR shared a similar number of studies as the IGR, which contributed 4% and 5%, respectively. BRs only appeared in 1% of overall studies, while the remainder are not specified (NS). Although this research showed that IGR can achieve a better performance in terms of improving thermal comfort and reducing building cooling energy demand, the construction and maintenance costs favor the use of an EGR
[5]. Articles studying VGS have a relatively balanced distribution across the different types of VGS; the most popular to the least popular are GF, GW, and DSGF, respectively, while the remainder are not specified. Only a small number of papers investigated the UA type, making it difficult to group them into a particular structure type of UA, as each of these papers used a different typology that is hard to classify (for example, edible green roofs, rooftop farms, etc.), although the RTGH has been used in more than one paper. Overall, 15% of the combined studies are not specified in terms of the subcategories of UGI types, and a few studies on VGS have not used the terminology of GW and GF. This finding further supports the need for a standardized classification scheme, as suggested by Koc et al.
[6].
2.2. Scale and Height Parameters
Scale is important when planning and designing the UGI. In terms of city planning, the scale would determine the applicable UGI type and the suitable building types, as well as the level of impact on the surroundings
[7]. Therefore, this research investigates the scale and building types to understand the trends.
Table 1 provides the range of each scale level of UGI, along with a brief description.
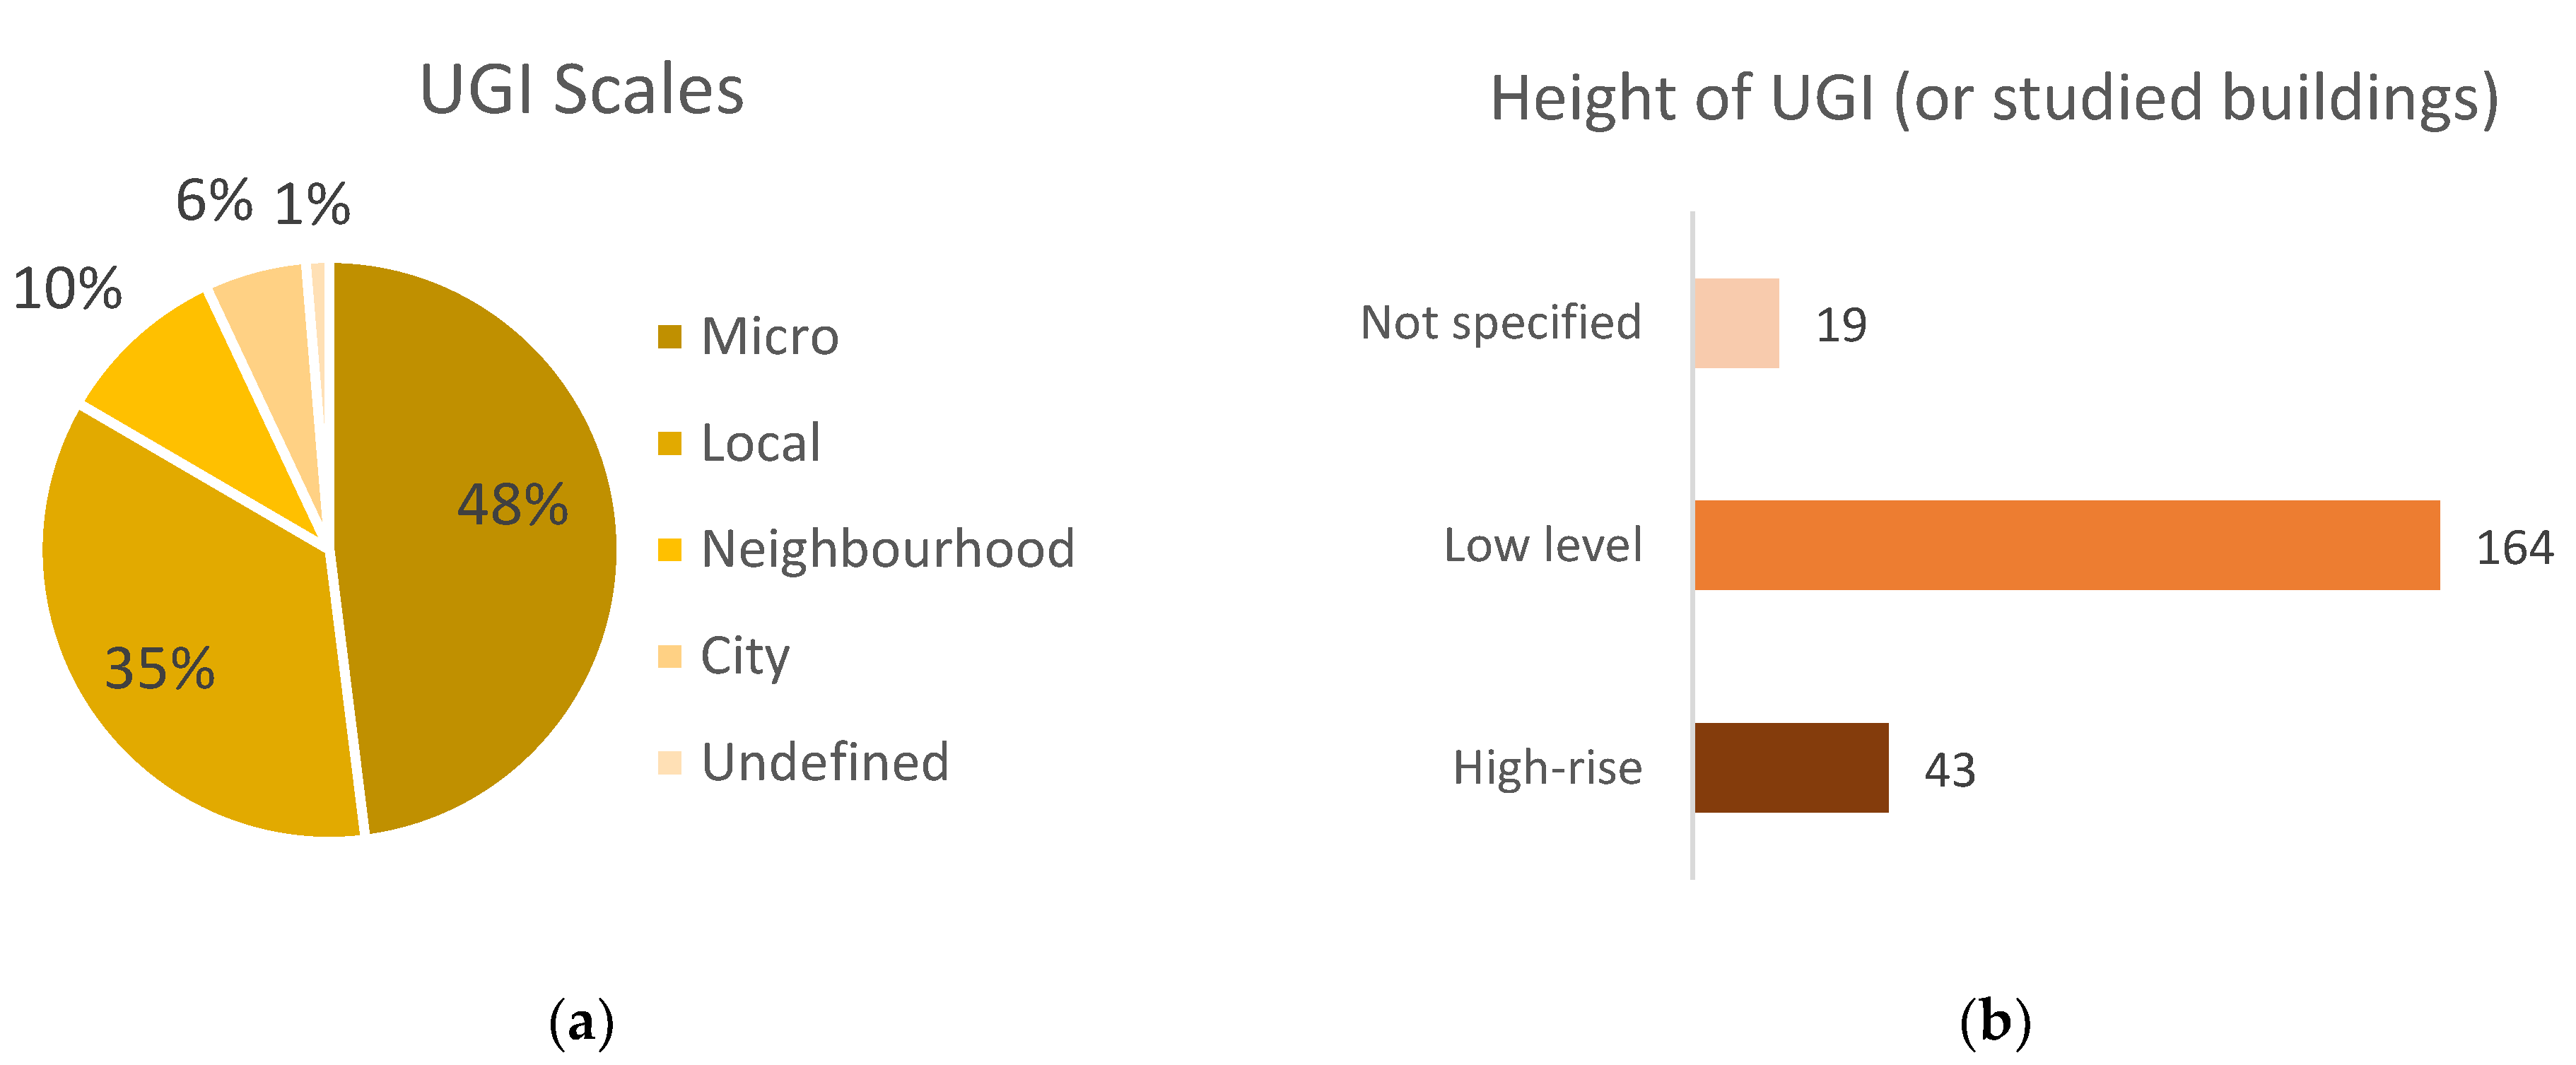
Figure 8a shows the scales of UGI that have been studied; almost half of the UGI schemes are on a microscale (48%), while about one-third are at a local scale (35%), with 10% in the neighborhood scale, and 6% on the city scale. The trend shows a constant pattern, where smaller-scale structures were more common than a large-scale study. This result is also similar to that of another review study that focused only on GR
[8]. A case study regarding GW in Hong Kong showed that a 100% increase in greenery coverage could potentially achieve an 88% saving on cooling load
[9].
Figure 8. (a) The scale of the studied UGI; (b) the height of the UGI (or studied buildings).
Table 1. The scale of the UGI compared with the size of the studied site.
Similar to the scale, the height of the UGI or, otherwise, the height of the studied site also impacts the effectiveness of the UGI. As claimed by Dahanayake and Chow
[9], GW provides a higher potential for cooling load reduction when the building height increases. For example, if the research is focused on outdoor thermal comfort, it should prioritize human comfort at the pedestrian level, although some studies claim that a GR will not provide a direct cooling effect at the pedestrian level; however, the existing surrounding buildings will still have an effect on factors such as air velocity and solar angle, etc.
[10][11]. Alternatively, if the research is focused on investigating indoor thermal comfort, the building height might not be the main concern; however, the number of levels/floors of the building should be taken into account, as the thermal performance might be different on the upper floors compared with the lower floors. Consequently, the owners of a rooftop terrace on a multi-story residential building will often have the most interest in installing a green roof
[12].
Figure 8b shows that the majority of the published studies, about 73%, focused on investigating the UGI in low-rise buildings (less than 4 stories or 15 m tall), compared to the UGI in high-rise buildings, which appeared in only 19% of the published studies.
Building types represent the scale and function of a building, the occupancy level, and the activities within it; hence, the energy demand can be estimated. For example, one study simulated the cooling energy demand of a primary school, with estimations of the occupant numbers and the assumption of mechanical ventilation in the computer lab and staff rooms
[13].
Figure 9 shows the ratio of building types that have been studied, as well as the distribution of the building types in relation to the study scales. It shows that most micro-scale papers studied a test cell or prototype structure. In an experimental study, test cells were used with a thermal scenario that was established based on an office profile to evaluate the internal heat load
[14]. Although the use of test cell and prototype structures is more economically feasible for conducting basic analysis in the early stages of a study, it might not reflect the actual scenarios at full scale on a real building.
Figure 9. The scale of UGI in relation to the building type.
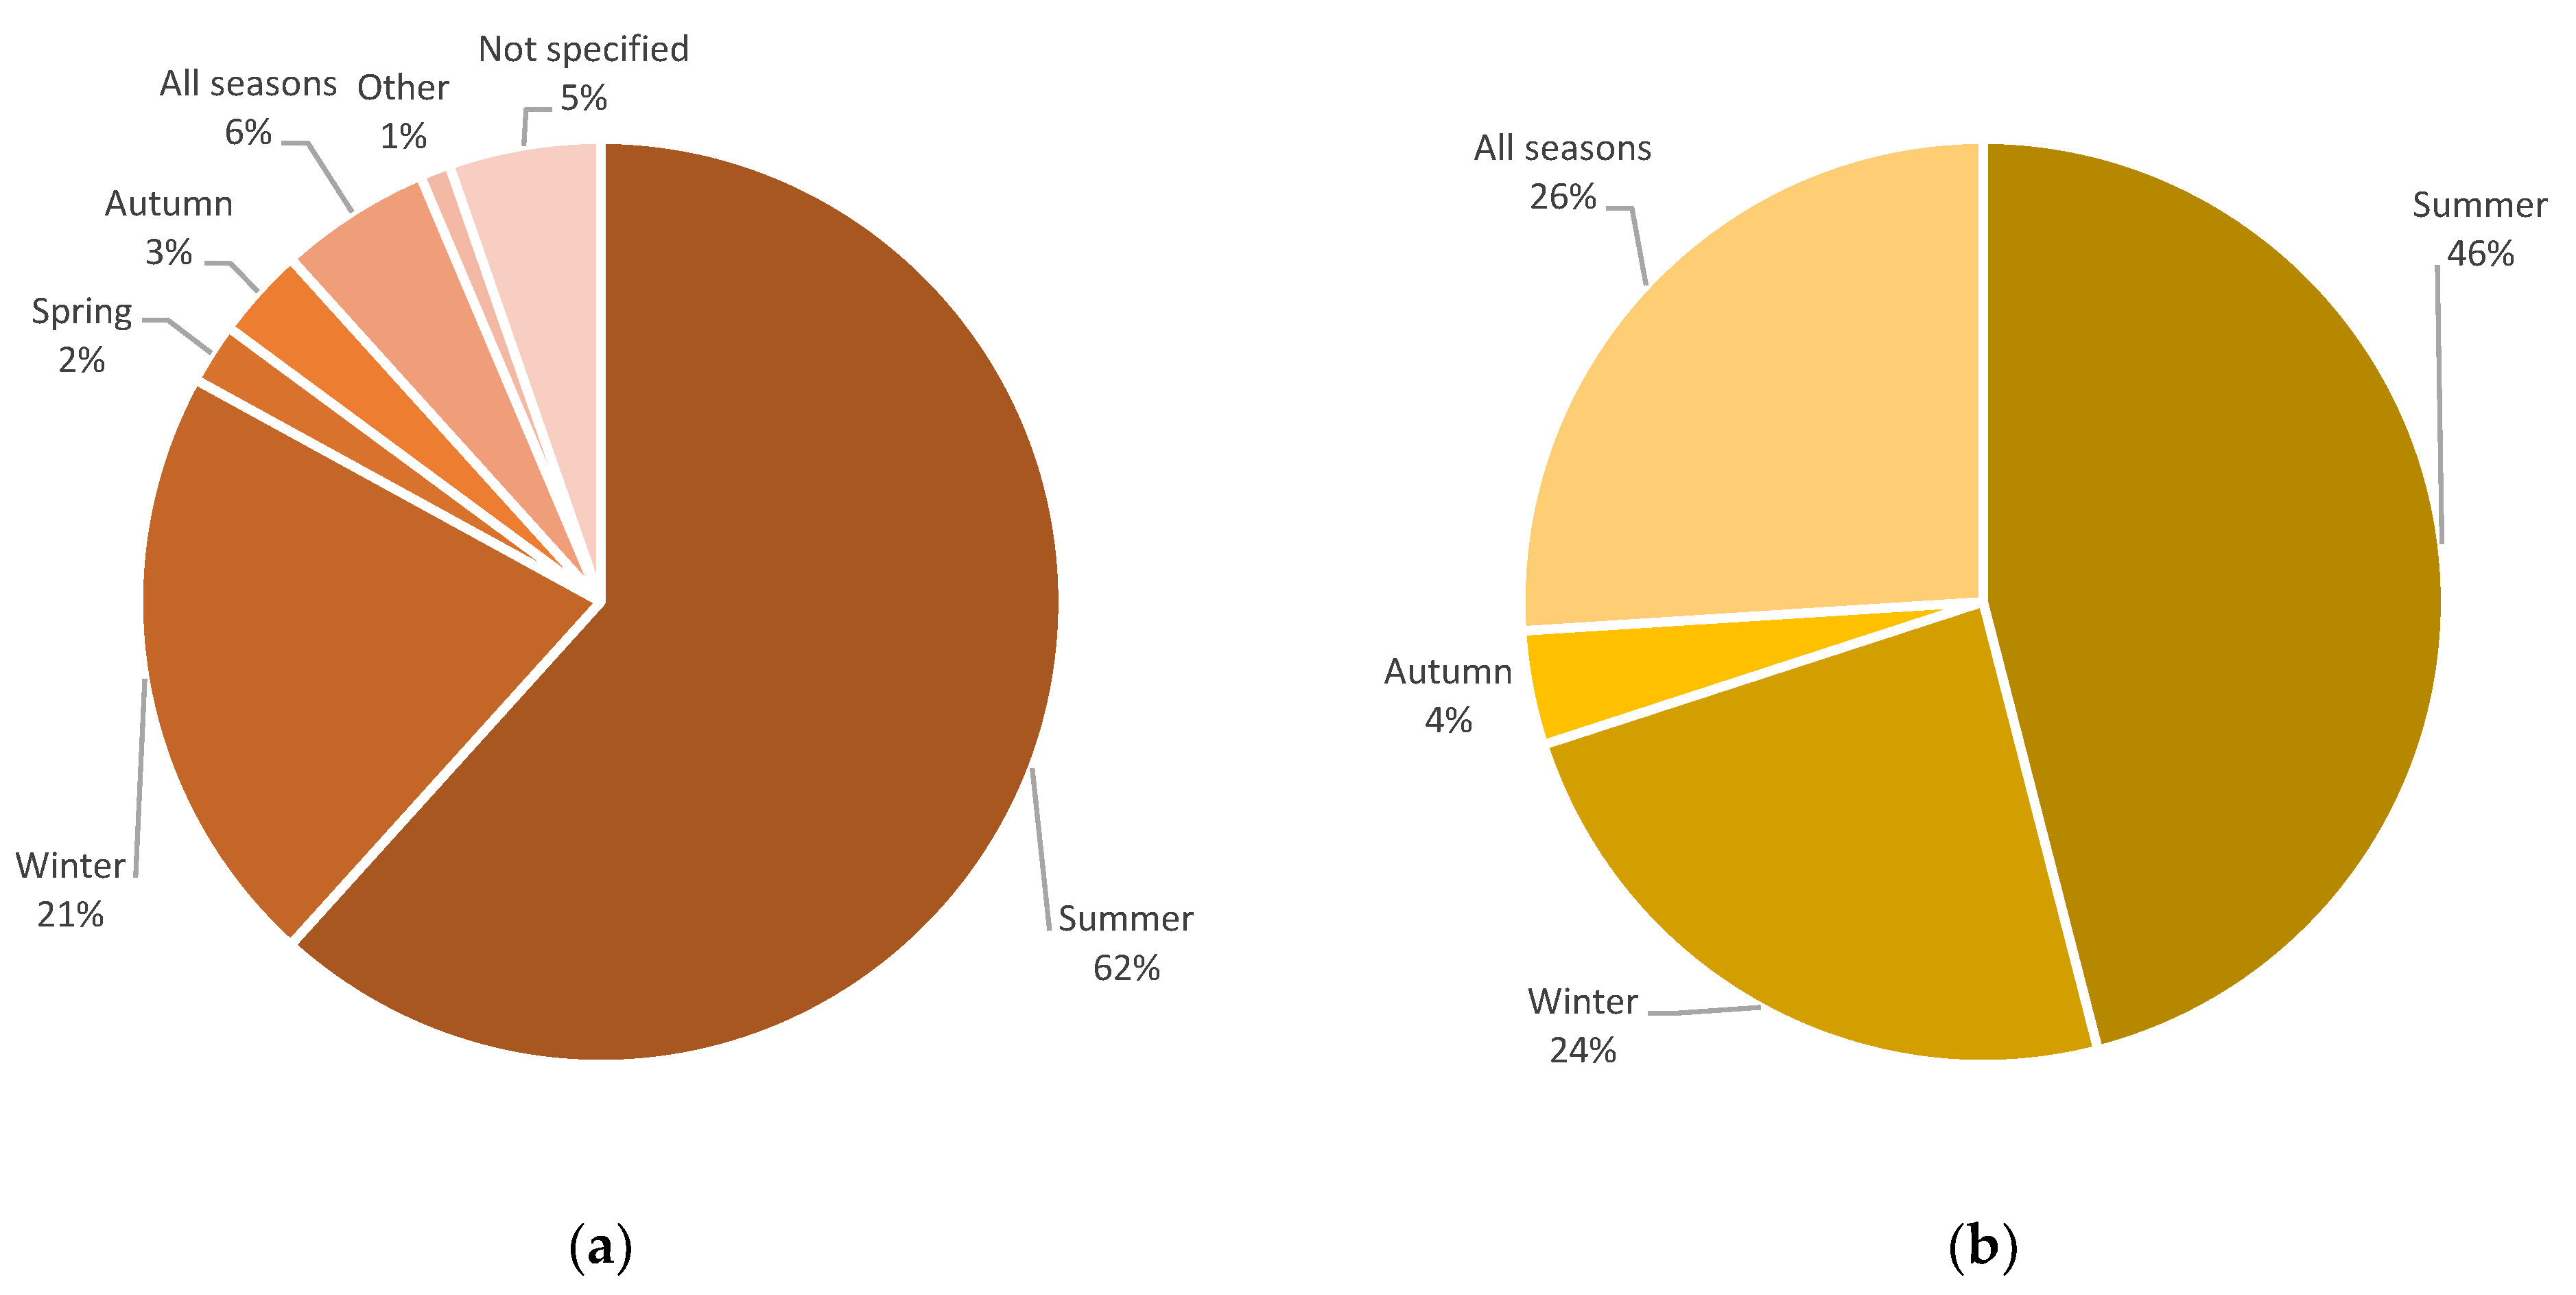
2.3. Seasons of Study Focus
Depending on the UGI application and design focus, the performance of the UGI might vary according to seasonal changes.
Figure 10 shows the seasons that were studied in the reviewed papers. In terms of both thermal and electricity energy performance, the majority of the studies were focused on summer periods, with 62% for thermal performance and 46% for electrical energy performance. Winter is the second most popular study period in terms of thermal performance, at 21%. However, for electricity energy performance, the annual performance was slightly more popular, with 26% of papers in comparison to the winter period alone, at 24%. There are only a small number of studies that have focused on spring, autumn, and monsoon seasons. The results show that most studies only focused on either summer or winter, which might not represent the annual performance of the UGI. For example, one study shows that the annual HVAC energy consumption with a green roof performed better in summer and winter; however, the spring and autumn underperformed, resulting in a 3% worse performance than a conventional roof with the same effective thermal insulation in terms of annual HVAC energy use
[15]. Another study also suggested that detailed seasonal and annual analyses can help to determine the best irrigation schedules with the highest reduction in energy demand
[16]. Nevertheless, the lack of studies on transitional seasons might lead readers to overestimate the UGI performance.
Figure 10. (a) The studied seasons for thermal performance; (b) the studied seasons for electricity energy performance.
2.4. Plant Characteristics
The plant characteristics of GFs vary depending on the objectives, locations, and climate of the study area. In total, 150 research papers mentioned the plant types that were used for the investigation of UGI; 55 studies out of 150 only provide the genera of the plant types, while an average of 3.4 plant species types are investigated per article. The maximum number of species that were investigated was 32 plant types. There were 83 articles using the leaf area index (LAI) as the main parameter; while 56 articles have the actual measurements of the LAI of specific plant species, the other papers either assumed the LAI values or used a reference value from other papers with the same plant types.
The most common plant types used in a green roof are sedums and grass, lawn, and herbaceous plants. Most studies also investigated at least four different types of plants to compare the results. Most VGS utilized climbing plants and creepers as they naturally grow vertically, needing less substrate or supports along the building façade. There are 57 articles on VGS that investigated the plant types, including the evergreen climbing ivy (Hedera helix) and Boston ivy (Parthenocissus tricuspidata), which are relatively popular, with 7 and 8 articles, respectively. In Italian cities, a climbing shrub named Rhyncospermum jasminoides and a variegated form of a vine called Pandorea jasminoides were studied extensively and appeared in 7 articles.
The selection of plant types is dominated by multiple factors; for example, the climate zone where the UGI is located affects the survivability of the plants and the requirements for maintenance, especially in terms of irrigation water, growing substrate, and supporting structure
[17][18][19]. The types of UGI determine the growing environment of the plants
[20][21]. The orientation of the building is particularly important because VGS relies on the vegetation providing shade to reduce the thermal heat by controlling the amount of incoming solar radiation
[22]. For example, some plants can achieve a better LAI value to reduce the incoming solar radiation, while other plants can achieve a better evapotranspiration rate
[14].
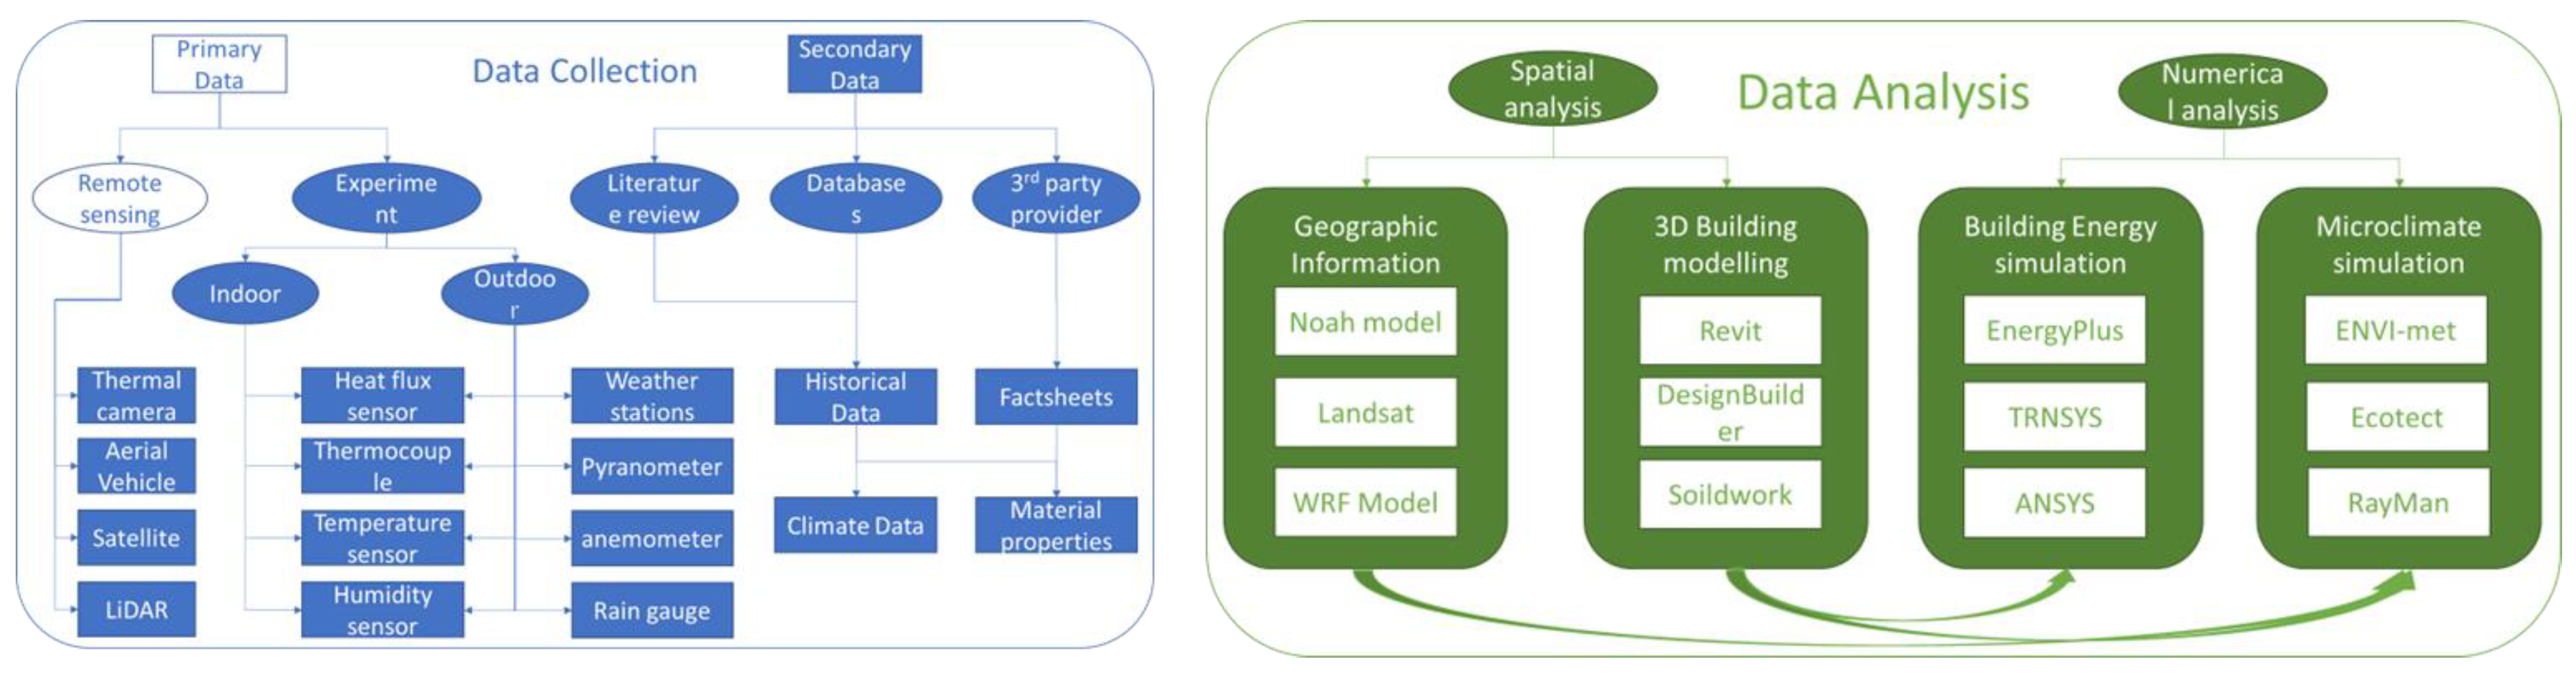
3. Approaches
In this research, the approaches of the screened articles can be separated into two stages, the data collection stage and the data analysis stage. The typical methods and tools that were most often used for these two stages are illustrated in Figure 11.
Figure 11. The typical methods and tools for data collection and analysis that were used in the reviewed articles.
3.1. Data Collection Setup and Tools
As shown in
Figure 11, there are two main data sources—primary and secondary data. Primary data is collected by either remote sensing or an experimental setup. Remote sensing refers to technology using satellites, aerial vehicles, infrared thermal cameras, or light detection and range (LiDAR) equipment to provide topology and geometry information; these tools allow researchers to generate information for a large area simultaneously
[1][23][24]. An experimental setup refers to using a test cell/cube or prototype that has been built or set up in a dedicated study area and that is solely used for research objectives
[25]. Sensors and equipment setups are usually long-term or even permanent and are secured in position with limited disturbance. Although an experimental setup is more flexible so that the researcher can set up their own parameters, it requires the researcher to have a good understanding of operating the equipment correctly. Secondary data refers to collecting historical data from literature reviews, databases, or a third-party provider. The advantage of using historical data is that of time efficiency; it allows the researcher to have faster access to information, and to conduct the analysis without physical fieldwork.
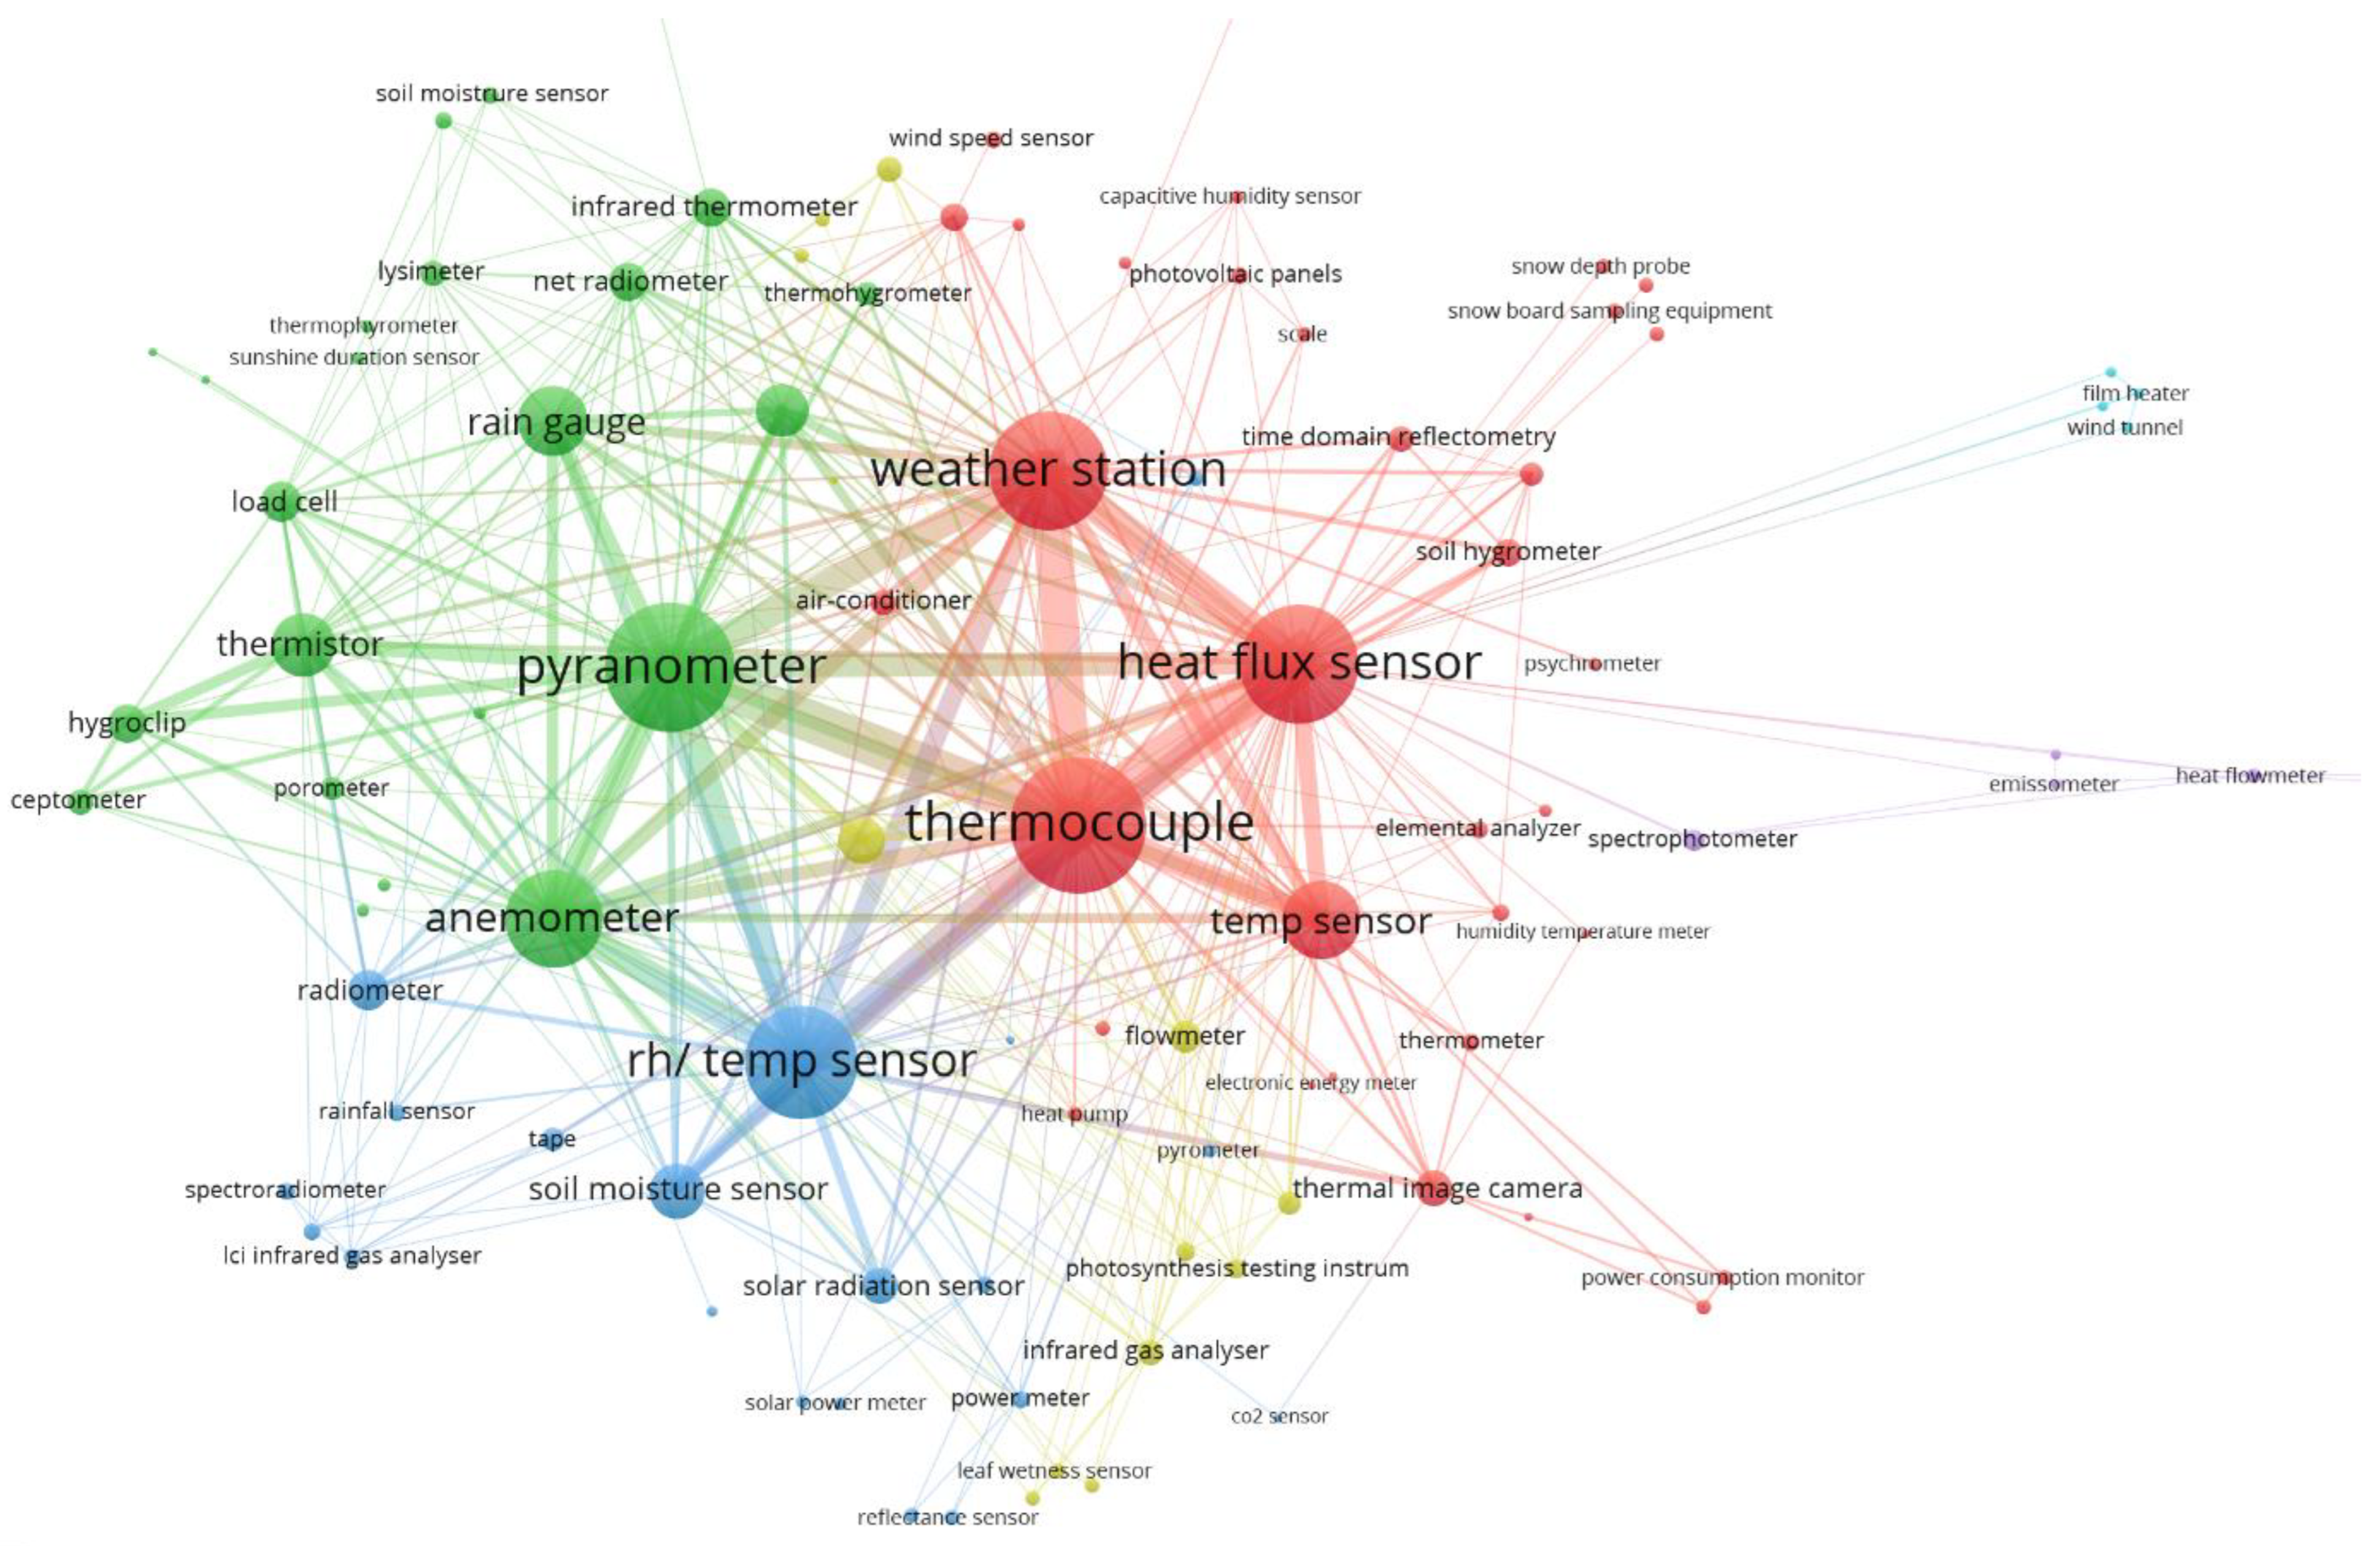
Figure 12 shows a bibliography network based on the sensors that were used in the reviewed articles, to illustrate how different types of sensors are associated with each other. It shows that the most commonly used sensors are thermocouples, heat flux sensors, pyranometers, anemometers, temperature-humidity sensors, and weather stations. These sensors are mainly used for collecting meteorological data, particularly the air temperature, relative humidity, heat flux of materials, wind speed and direction, and solar radiation.
Figure 12. Bibliography network of the sensors used in the reviewed articles.
3.2. Data Analysis Software and Models
From the reviews, two main types of data analysis methods appear and can be grouped into spatial and numerical analyses. The spatial analysis is associated with geographical information systems (GIS) such as Landsat, the single-layer urban canopy model (SLUCM), and the weather research forecast (WRF) model
[26][27], as well as three-dimensional building modeling using computer-aided design software, such as Revit, DesignBuilder, and Solidworks. Numerical analysis is useful for creating building energy simulations (BES), microclimate analysis, and computational fluid dynamics (CFD). A building energy simulation is useful to analyze energy consumption and demand, indoor climate, and the indoor thermal comfort of an individual building
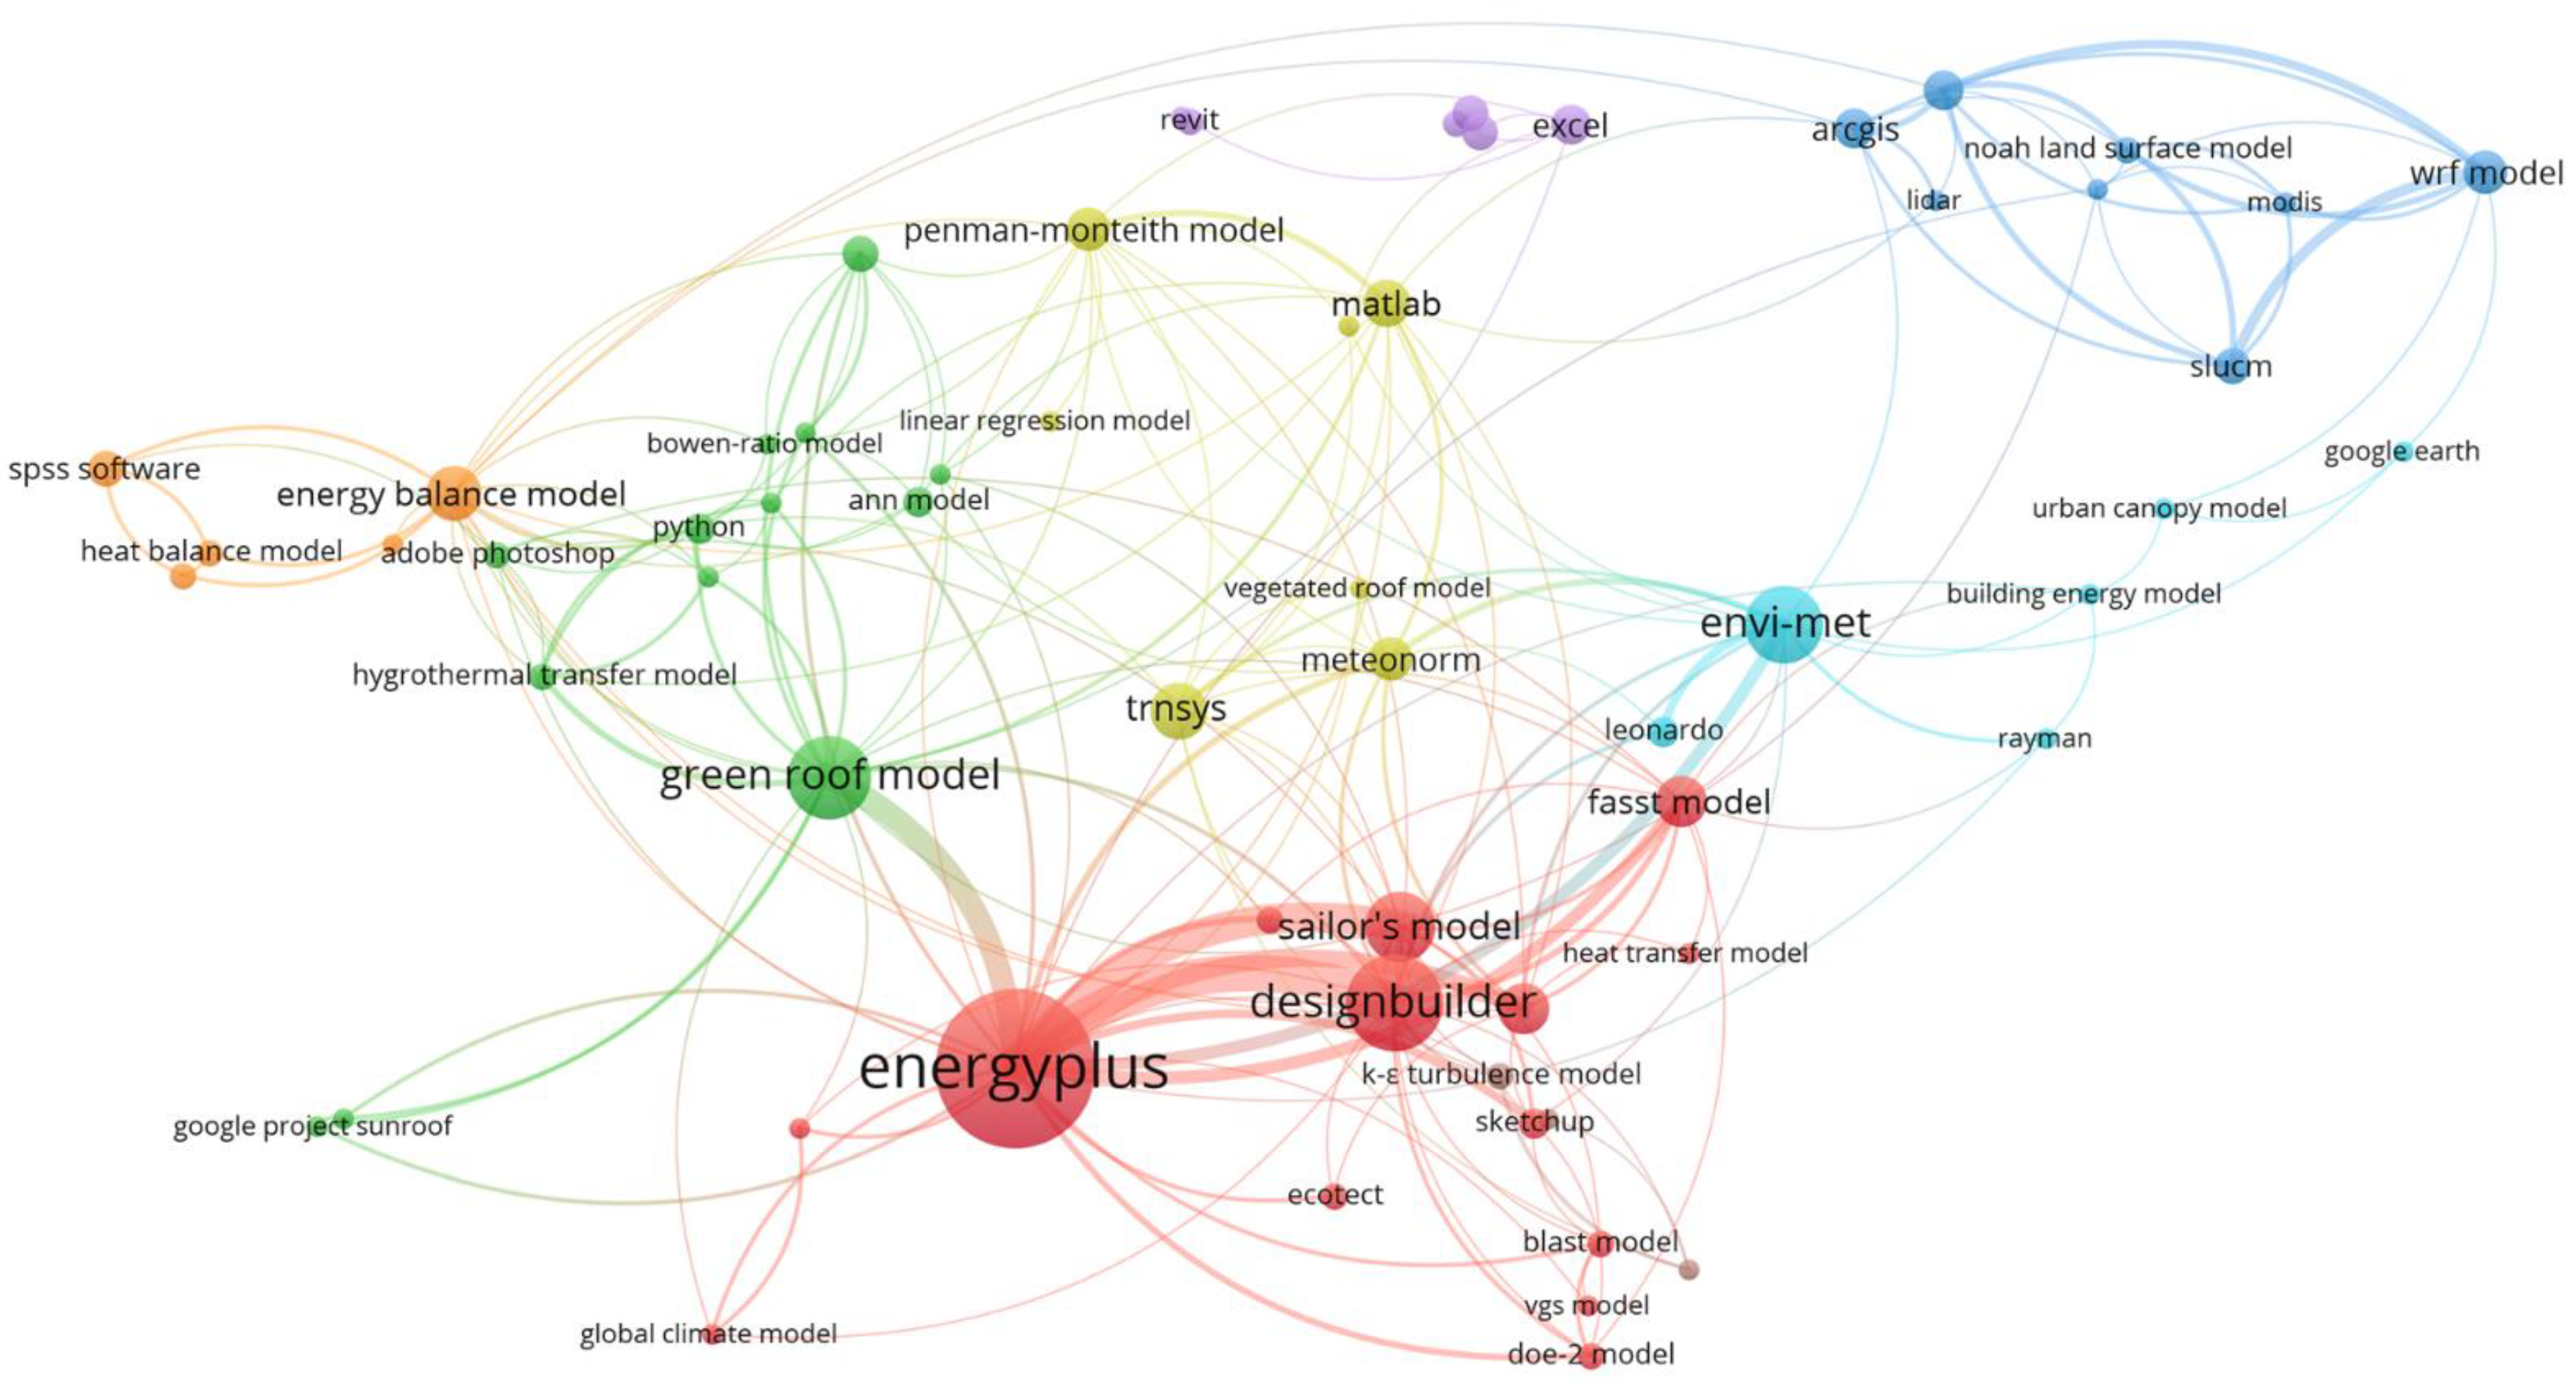
[28]. From the reviewed articles, EnergyPlus is the most popular software used for building energy analyses, with 69 studies. Another commonly used software program for building energy analysis is TRNSYS, a CFD software program that is used in 13 studies. A microclimate simulation is commonly used for thermal comfort analysis. ENVI-met is the most popular program, with 22 articles.
Figure 13 represents the popularity of the software.
Figure 13. The connections and relationships among methods and tools. This figure was produced using a VOS viewer based on the occurrence of the tools and methods keywords. The thickness of the line represents stronger or weaker links between the keywords.
Note that statistical software such as Excel, SPSS, and CoStat are not always considered simulation software, since the majority of studies would simply generate graphs/figures from raw data without using simulation modeling. However, with the appropriate coding, coupling, and plugin mathematical modules, such as the Sailor’s model or the FASST (Fast All-Season Soil Strength) model to program the software, based on equations and formulas, it will be able to run simulations for analysis
[16]. Another study has combined the MATLAB, KASPRO, and TRNSYS systems to calculate the energy balance of investigated greenhouse structures
[29].
The use of software is related to the scale of the UGI. For example, the WRF model is typical for mesoscale analysis, while ENVI-met is appropriate for microclimate-scale analysis
[30]. EnergyPlus and DesignBuilder are more suitable for building and indoor scales
[31][32][33]. As there are more small-scale UGI studies, the use of software for the building scales analysis is thus more common. As a result, when the research needs to analyze both indoor and outdoor environments on different scales, it will require more than one software type to complete the analysis. For example, one study used the ENVI-met to obtain the outdoor microclimate data for an urban area as the input parameter in TRNSYS for building a scale energy analysis
[10].
 +1 credit