1. Electrochemical Detection
Electrochemical techniques are rapid and cost-efficient, widely applied and amenable to the detection of illicit drugs, such as cocaine, marijuana, and ecstasy
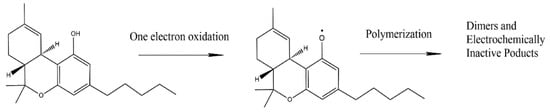
[1]. The electrochemical techniques related to cannabinoid detection include square wave voltammetry (SWV), differential pulse voltammetry (DPV), and electrochemical impedance spectroscopy (EIS). It is worth mentioning that the direct detection of THC relies on its electrochemical oxidation. As mentioned before, THC is an electroactive compound that undergoes oxidation following a phenol-like mechanism
[2]. The reaction route in the basic medium (as proposed by Balbino et al.
[3]) involves the deprotonation of the phenolic hydroxyl group, followed by oxidation and formation of a phenoxy radical (
Scheme 1). After its formation, the phenoxy radical reacts with another THC molecule or other similar compounds
[4]. Despite overwhelming advantages, the electrochemical detection of THC is challenging, because of the hydrophobicity of THC
[5].
Scheme 1. Phenol-like oxidation mechanism of THC as proposed by Balbino et al.
[2]. Adapted from
[2] (with permission of Elsevier) and from
[3] (with permission of Wiley).
To overcome the drawback associated with THC’s low solubility in aqueous media or with inherent interferences caused by alcohol solvents, biosensors based on affinity recognition of THC and metabolites by immobilized biomolecules, have been recently spotted. The most relevant papers will be further discussed.
1.1. SWV- and DPV-Based Biosensors
In SWV, the staircase potential ramp is modified with square-shaped potential pulses
[6]. At each step of the staircase ramp, two opposite potential pulses that are equal in height are imposed. The current sampling is carried out at the end of each potential pulse for decreasing the contribution of the non-faradaic current
[7]. DPV is a technique related to SWV. Here, pulses of constant amplitude are superimposed on the potential linear sweep
[8]. The current sampling is achieved just before and at the end of the modulation pulse, and the difference is recorded, in order to reduce the contribution of the non-faradaic current
[9]. In both SWV and DPV the net current vs. potential pulse displays a symmetrical peak-shaped feature.
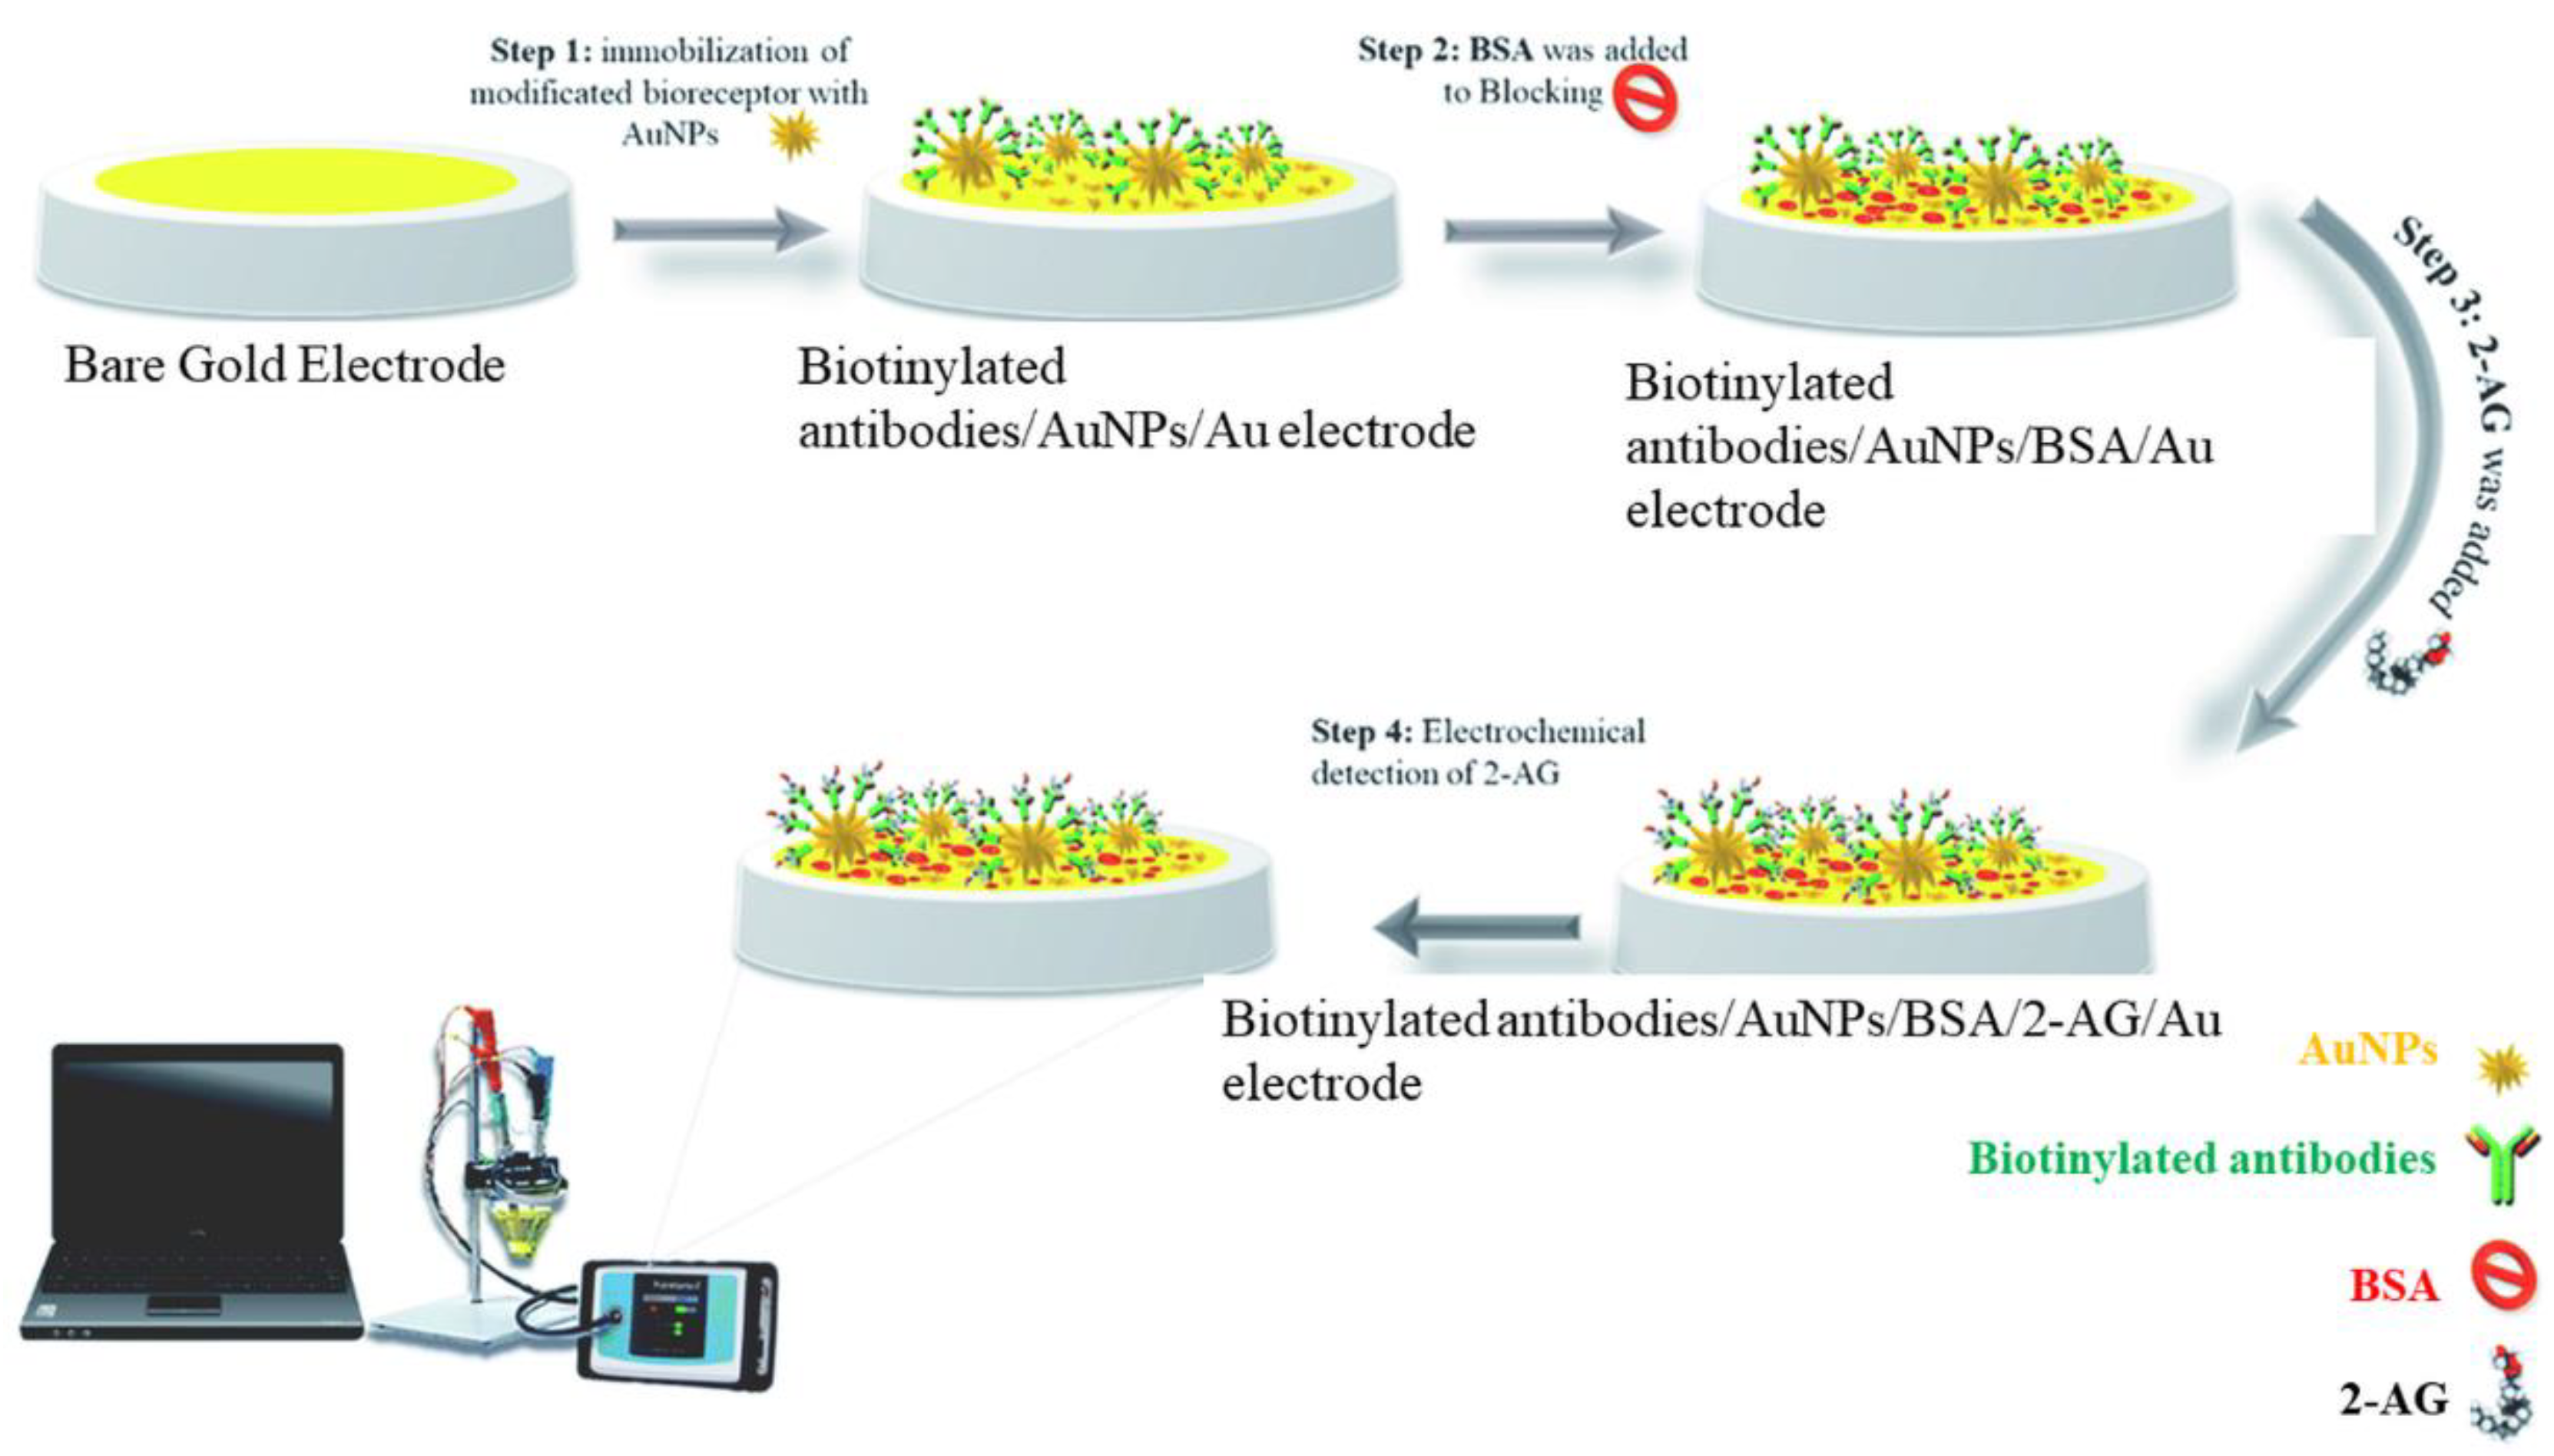
Kohansal et al. have developed an immunosensor for 2-AG in human plasma and rat serum exploiting the conductivity changes at the modified electrode in the presence of the ferricyanide/ferrocyanide system
[10]. The interrogation techniques were DPV and SWV. Gold nanostars (GNS) were used to expand the electroactive surface and immobilize Anti-2-Ag antibodies. Firstly, the affinity format exploited the interaction between the surface-immobilized anti-2-Ag antibody and the 2-Ag protein conjugate. The net peak current decreased with the increase in the 2-Ag protein concentration, because of electron transfer blocking between the ferry/ferrocyanide couple and the electrode surface. 2-AG protein was measured with a linear range of 0.48–1 ng/mL and a limit of quantification (LOQ) of 0.48 ng/L. Secondly, 2-Ag was detected in real samples based on the competition between 2-Ag protein and the target 2-Ag for the binding sites of the immobilized anti-2-Ag antibodies. The detection principle was based on the increase in the net peak current with the target (2-AG) concentration. The signal enhancement was accompanied by a slight shift of the redox potential to more negative values. The developed immunosensor showed high sensitivity and specificity in the presence of interferents. Bovine serum albumin (BSA) was used for surface blocking. The preparation of the immunosensor is depicted in
Figure 1. This affinity format may be as well applied to the detection of relevant phytocannabinoids or SCs.
Figure 1. Schematic representation of the immunosensor proposed by Kohansal et al. for the detection of 2-Ag protein conjugate. Reproduced with permission from
[10]. This entry is licensed under a Creative Commons Attribution 3.0 International License, which permits use, sharing, adaptation, distribution, and reproduction in any medium or format, as long as you give appropriate credit to the original author(s) and the source, provide a link to the Creative Commons license, and indicate if changes were made. The images or other third party material in this entry are included in the entry’s Creative Commons license unless indicated otherwise in a credit line to the material.
1.2. EIS-Based Biosensors
According to the relation between the charge transfer and the measured parameters, EIS-based sensors can be categorized into (A) faradaic and (B) non-faradaic (capacitive)
[11]:
(A) Faradaic (bio)sensors use electrodes with conductive surfaces; the charge transfer resistance (Rct) is measured in the presence of redox-active species in solution, such as hexacyanoferrate (II)/(III) anions, or hexaammineruthenium (II)/(III) cations
[12]. The deposition of non-conductive molecules onto the surface blocks the electron transfer causing an increase in Rct. Conversely, the deposition of conductive molecules or molecules able to catalyze redox reactions determines the decrease in Rct.
(B) Non-Faradaic (bio)sensors are devices containing electrodes with surfaces covered by layer(s) with insulating properties. Here, the double-layer capacitance (Cdl) is the main parameter that characterizes the processes at the electrode interface
[13]. The adsorption of molecules onto the surface usually decreases the value of Cdl
[14]. Modified electrodes can be used in disposable sensors, to overcome the drawbacks of low signal-to-noise ratios
[15].
Durmus et al. proposed an EIS immunosensor for the detection of JWH-018 (
N-4-hydroxypentyl metabolite)
[16]. First, a functional surface was built up using a catechol-attached polypeptide (CtP). Then, the anti-K2 antibody was incorporated within the polymer via a covalent cross-linker. The modifications, carried out on the glassy carbon electrode surface, are shown in
Figure 2, together with the Nyquist plots. The principle of detection lies in the increase in Rct following the direct binding of the target to the functionalized surface. Linearity and the limit of detection for JWH-018 (
N-4-hydroxypentyl metabolite) were determined as 10–500 ng/mL and 5.892 ng/mL, respectively. The selectivity of the biosensor was evaluated with different interfering molecules (cocaine, codeine, and(methamphetamine). Finally, the immunosensor successfully detected JWH-018 (
N-4-hydroxypentyl metabolite) in spiked synthetic urine samples. The results showed that the developed platform can be applied to detect other JWH series with high sensitivity and accuracy.
Figure 2. Development of the impedimetric immunosensor for the detection of JWH-018 (
N-4-hydroxypentyl metabolite). Each step of the sensor development is accompanied by an increase in Rct. Reproduced with permission from
[16]. Copyright (2020) American Chemical Society.
The affinity-based immunosensor developed by Stevenson et al. was able to detect THC in saliva
[17]. Non-faradaic EIS was utilized to monitor de binding of a BSA-THC hapten to the capture antibody previously immobilized onto the electrode surface. A linker molecule (dithiobis succinimidyl propionate, DSP) was chemisorbed onto the electrode surface using the gold/thiol chemistry. Then, the capture antibody for the BSA-THC hapten was bound to the surface via the DSP linker. The binding of the hapten to the immobilized antibody was analyzed by non-faradaic changes in the dielectric properties of the electrode/electrolyte interface. The overall measurement of THC took approximately 1 min and provided a LOD of 100 pg/mL.
1.3. Chronoamperometric Biosensors
Chronoamperometry (CA) is a potential step method: it measures the current variation vs. time as a response to a variation (step, pulse) in potential. Since the measurements are performed in a transient state, it allows a dramatic reduction of response time compared to amperometry in stirred solution
[18]. A sandwich immunoassay based on a double-layer gold nanoparticles-amplification system for THC detection was reported by Lu et al.
[19]. Chitosan/gold nanoparticles (GNPs) nanocomposites were deposited onto a glassy carbon electrode (GCE), to absorb horseradish peroxidase (HRP) and thionine (Thi). The anti-THC was trapped between two conductive layers of chitosan/GNP/HRP/thionine. In the presence of H
2O
2, the immobilized HRP and thionine were involved in a sequence of consecutive redox reactions that led to the increase in the faradaic current. The binding of the target THC to the immobilized antibody prevented the electron transfer due to steric hindrance. Chronoamperometry was used to determine the THC in phosphate buffer saline (PBS). The results showed that the response current had a good linear correlation with the THC concentration range from 0.01 to 10
3 ng/mL. The LOD for THC was decreased to 3.3 pg/mL.
2. Magnetoresistive Biosensors
Magnetoresistance (MR) represents the change of resistance upon applying an external magnetic field. The capability of converting magnetic signals to electrical signals has led to the successful development of sensing devices based on the MR effect
[20]. The GMR effect exists in metallic structures with alternating ferromagnetic and nonmagnetic layers. Following the application of a magnetic field, the magnetization directions of two adjoining ferromagnetic layers become either parallel or antiparallel, depending on the orientation of the external field. GMR biosensing technology has the advantages of low cost, high possibility in portability, high sensitivity, and real-time signal readout
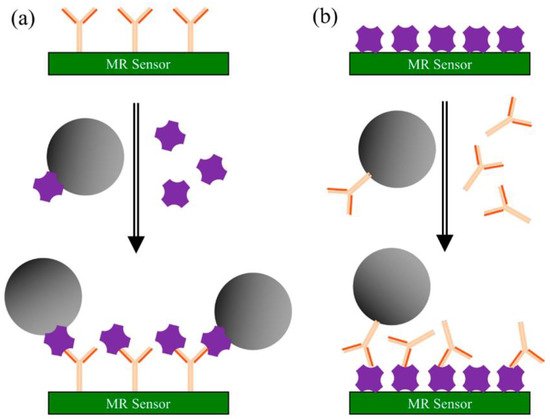
[21][22]. The principle of the surface competition assay, adaptable for on-site screening of cannabinoids, is depicted in
Scheme 2 [20].
Scheme 2. Principle of surface competition assays using MR sensors: (
a) capture antibodies are pre-coated on the sensor’s surface. A mixture of magnetic nanoparticles (MNPs) labeled antigen and unlabeled antigen from the testing sample is injected onto the surface. Both labeled and sample antigens are competing for the antibody’s binding sites; (
b) antigens are pre-coated on the sensor’s surface. A mixture of MNPs-labeled antibodies and unlabeled antigens from the sample is injected onto surface. Here, the competition occurs between the immobilized and the free antigen for the MNPs-labeled antibody’s binding sites. In both types of assays, the recorded signal is directly proportional to the number of MNPs bound to the surface. Reproduced with permission from
[20]. This entry is licensed under a Creative Commons Attribution 4.0 International License, which permits use, sharing, adaptation, distribution, and reproduction in any medium or format, as long as you give appropriate credit to the original author(s) and the source, provide a link to the Creative Commons license, and indicate if changes were made. The images or other third party material in this entry are included in the entry’s Creative Commons license unless indicated otherwise in a credit line to the material.
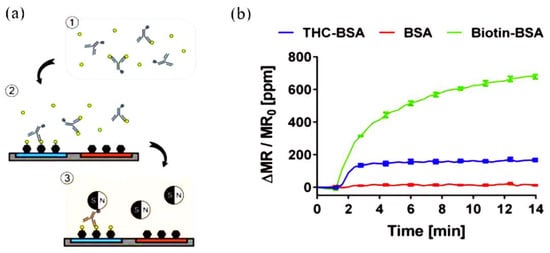
A sensing platform that employs GMR immunosensors integrated with a portable reader system and smartphone to detect THC in saliva using competitive immunoassays was reported by Lee et al.
[23]. The competitive assay required only one type of antibody to recognize THC and link the magnetic nanoparticles (MNPs) to THC bound on the electrode surface via biotin−streptavidin interaction. The biotinylated antibodies were added to the sample containing THC to bind to THC in the sample in the preincubation step. Then, the mixture was added to the chip where BSA and THC conjugated with BSA (THC-BSA) were immobilized on different sensors to allow active antibodies to bind to THC-BSA on the sensors. After the washing step, the chip cartridge was inserted into the measurement reader and streptavidin-coated MNPs were added. The stray field from the bound MNPs disturbed the magnetization of the sensors underneath, changing the resistance (
Figure 3). The changes in resistance, monitored as GMR signals (ΔMR/MR
0), were proportional to the number of bound MNPs and have an inverse relationship with the concentration of THC in the sample due to the nature of competitive assays. THC was detected in the range of 0–50 ng/mL, covering most cutoff values proposed in previous studies. The reported work is amenable to the on-site screening of THC.
Figure 3. Schematic representation of the GMR biosensing platform for THC: (
a) 1: biotinylated anti-THC antibodies were incubated with THC-containing samples. 2: the mixture was injected on a chip with immobilized bovine serum albumin (BSA) and THC–BSA bioconjugate, to allow the antibodies to bind. 3: Streptavidin-coated MNPs were added to the chip to communicate the signals. (
b) Representation of the measured signals of THC-BSA, BSA, and biotinylated BSA (Biotin-BSA) immobilized on different sensors. Adapted with permission from
[23]. Copyright (2016) American Chemical Society.
3. Optical Detection
Fluorescence-based detection has grown in popularity, being a swift and on-point detection technique. The popularity of this technique is probably due to its simplicity, high sensitivity, and capability of detecting analytes in small volumes. Moreover, low-cost and simple devices for on-site detection can be designed using a light-emitting-diode (LED) for excitation and photodetector
[24]. Fluorescent quantum dots (QDs) techniques have massively improved detection performances. Quantum confinement effects of small nanoscale materials can produce a strong enhancement of fluorescence emission leading to new possibilities over traditional fluorescent organic dye
[25]. Lateral flow immunoassay (LFIA) strips coupled with fluorescence analytic devices were used to detect THC from saliva samples.
Plouffe and Murthy
[26] reported a fluorescence-based LFIA for THC detection in saliva. Anti-THC antibodies were conjugated to polymeric phycoerythrin-fluorescent particles. The antibodies were used further to capture THC. The positive interaction of THC with the conjugates and the test line produced a fluorescent quantifiable signal. The strategy provided a LOD of 2.57 nM.
LFIA results are often obtained by visualizing the color changes in specific areas, thus providing qualitative information about the presence/absence of the target analyte
[27]. Colorimetric detection is an intuitive method for obtaining positive or negative results in LFIA multiplexed detection because the color changes are easy to observe, without the need for special equipment
[28][29]. Most of the colorimetric systems involve enzymes with peroxidase activity such as horseradish peroxidase and/or hydrolases such as alkaline phosphatase (ALP) as components of the color development process. Enzymes are preferred in the assays based on color development due to their high specificity toward the target analyte
[30]. In all the affinity assays discussed in this entry, the recognition elements were antibodies from various sources. Although not so often reported, the cannabinoids’ interaction with the CB
1 and CB
2 receptors was exploited to develop activity-based bioassays. A bioassay in which the cannabinoid receptor activation by cannabinoids caused the recruitment of truncated β-arrestin 2 to the cannabinoid receptors, resulting in functional complementation of a split luciferase, allowed readout via bioluminescence
[31]. This method seems suitable for a yes/no format around a threshold value (since positive results were obtained for THC levels exceeding 12 ng/mL. It was found recently that CBD and carboxy-THC act as allosteric modulators of the growth hormone secretagogue receptor (GHS-R1a) during its interaction with the endogenous ligand, ghrelin (GHR)
[32], and this fact can be further exploited to detect these cannabinoids using a surface competition assay format.
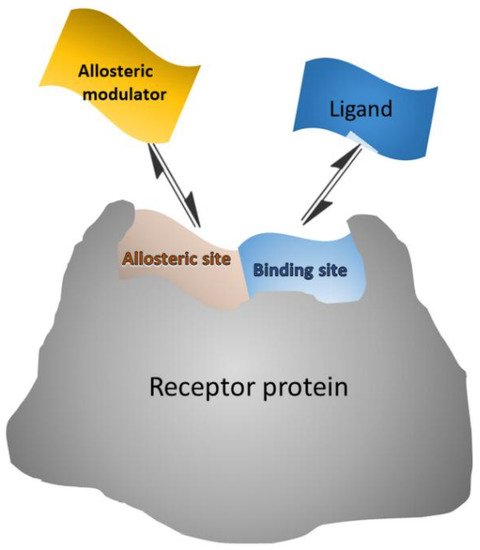
Allosteric modulators are in general small molecules that can bind to a distant site (allosteric site) from the binding (orthosteric) site, causing a functional change of the binding site (
Scheme 3). Some allosteric modulators bind both allosteric and orthosteric sites
[33]. Thus, the allosteric modulators “push” the conformational equilibrium towards a specific state
[34]. Allosteric activators shift the equilibrium towards the active state, where the orthosteric ligand binds with higher affinity, while allosteric inhibitors shift the equilibrium towards the inactive state, where the orthosteric ligand cannot bind
[33].
Scheme 3. Schematic representation of allosteric modulator/receptor and orthosteric ligand/receptor interactions that can be exploited in surface competition assays, where the surface-bound receptor interacts with both labeled ligand and unlabeled modulator from the sample.
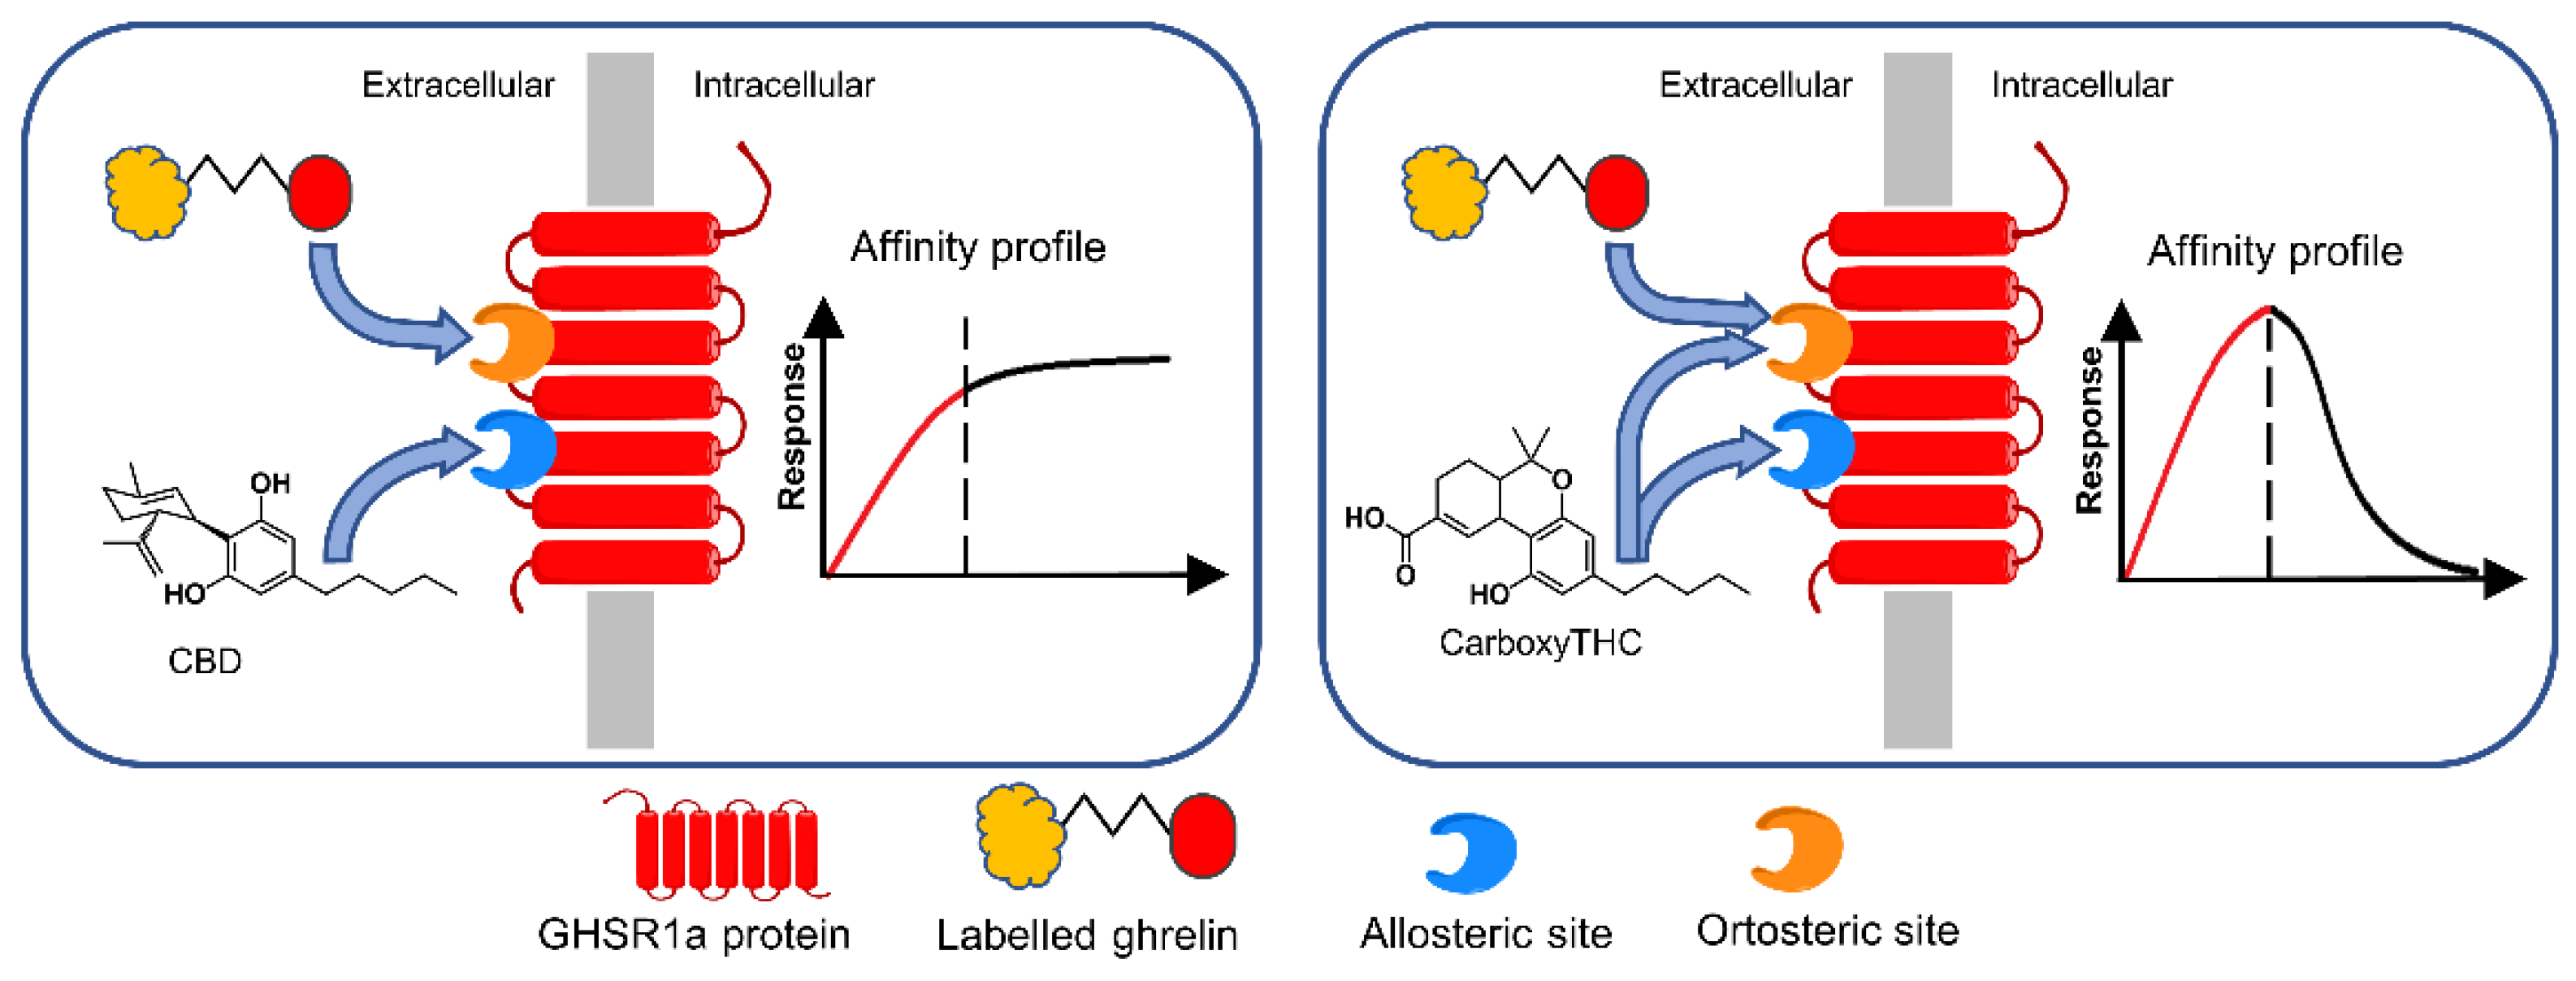
Thus, carboxy-THC and CBD were detected via their interaction with the growth hormone secretagogue receptor (GHS-R1a), in competition with the labeled ghrelin GHR) (GHS-R1a’s endogenous ligand)
[32] (
Figure 4). It was noticed that the two cannabinoids acted as allosteric modulators of GHS-R1a. First, biotinylated anti-GHS-R1a antibodies were coated onto the surface via biotin/streptavidin interaction. Then, the receptor was let to interact with the immobilized antibody, which acted as support for controlled GHS-R1a immobilization. Peroxidase-labeled GHR and cannabinoids competed for the binding sites of GHS-R1a. Finally, after the addition of hydrogen peroxide and chromogenic substrate (tetramethylbenzidine), color development was monitored to build up an affinity profile. The absorbance was directly proportional to labeled GHR bound onto the surface. It was found that CBD strongly enhances the binding of the labeled GHR, probably due to its interaction with the allosteric site of GHS-R1a. The results suggested that CBD binds to the allosteric site only, while carboxy-THC binds to both allosteric and orthosteric sites.
Figure 4. Biosensing principle of CBD and carboxy-THC detection according to their affinity profile in direct competitive assay with HRP-labeled ghrelin. The immobilized recognition element was GHS-R1a. Reproduced from
[32] with permission from Elsevier.
The analysis was performed on spiked urine samples and was able to detect cannabinoids even in the presence of GHR mimetics. The proposed method exploited the linear parts of the competitive binding curves to detect CBD and carboxy-THC. A linear range of 5–30 ng/mL was obtained for both CBD and carboxy-THC.
 +1 credit