Your browser does not fully support modern features. Please upgrade for a smoother experience.
Submitted Successfully!
 +1 credit
Thank you for your contribution! You can also upload a video entry or images related to this topic.
For video creation, please contact our Academic Video Service.
| Version | Summary | Created by | Modification | Content Size | Created at | Operation |
|---|---|---|---|---|---|---|
| 1 | Ebuwa Elisabeth Eweka | -- | 2157 | 2022-08-16 14:14:55 | | | |
| 2 | Dean Liu | Meta information modification | 2157 | 2022-08-17 04:11:57 | | |
Video Upload Options
We provide professional Academic Video Service to translate complex research into visually appealing presentations. Would you like to try it?
Cite
If you have any further questions, please contact Encyclopedia Editorial Office.
Eweka, E.E.; Lopez-Arroyo, E.; Medupin, C.O.; Oladipo, A.; Campos, L.C. Renewable Energy Resources in Nigeria. Encyclopedia. Available online: https://encyclopedia.pub/entry/26194 (accessed on 24 July 2026).
Eweka EE, Lopez-Arroyo E, Medupin CO, Oladipo A, Campos LC. Renewable Energy Resources in Nigeria. Encyclopedia. Available at: https://encyclopedia.pub/entry/26194. Accessed July 24, 2026.
Eweka, Ebuwa Elisabeth, Enrique Lopez-Arroyo, Christian Oluwaremilekun Medupin, Abiola Oladipo, Luiza Cintra Campos. "Renewable Energy Resources in Nigeria" Encyclopedia, https://encyclopedia.pub/entry/26194 (accessed July 24, 2026).
Eweka, E.E., Lopez-Arroyo, E., Medupin, C.O., Oladipo, A., & Campos, L.C. (2022, August 16). Renewable Energy Resources in Nigeria. In Encyclopedia. https://encyclopedia.pub/entry/26194
Eweka, Ebuwa Elisabeth, et al. "Renewable Energy Resources in Nigeria." Encyclopedia. Web. 16 August, 2022.
Copy Citation
Renewable energy resource utilisation is becoming more prevalent in society and can be a sustainable method to meet rising energy demand and consumption. The International Renewable Energy Agency reports that presently, approximately 33% of total electricity output around the world is from renewable energy sources. In Nigeria, the World Bank reported this figure as 18.2% in 2015. It is important to understand how Nigeria can raise this average as the world moves towards less use of fossil fuels.
bioenergy
biogas
electricity
Nigeria
solar energy
1. Introduction
Worldwide, there are over 860 million people without access to power. Sub-Saharan Africa accounts for 600 million [1]. Over the last century, extensive research has focused on the synergies between energy and development. Research has found that inclusive growth is not possible without modern energy [2]. Global energy demand is growing rapidly, and by 2035, worldwide energy consumption is projected to double [1]. Consequently, there have been major concerns about how to meet demand sustainably.
Currently, Nigeria has an electricity problem. The Nigerian “energy supply crisis” is referred to as the continuing failure of the Nigerian government and power sector to provide an adequate electricity supply to urban and rural communities. This is reflected in the low overall electrification rate in Nigeria, which stands at 56.5% [3]. Energy demand is estimated at approximately 17,520 MW annually, but peak generation capability is around 5300 MW [4]. The Nigerian energy sector is greatly dependent on petroleum and fossil fuels for energy and electricity production. The International Renewable Energy Agency (IRENA) reports that presently, approximately 33% of total global electricity output is from renewable energy sources, whereas, in Nigeria, the figure is 18.2% [5][6]. This exerts pressure on the limited renewable energy resources available as fossil fuel availability continues to deplete. Thus, the appeal for renewable energy sources has grown exponentially in the pursuit of climate change mitigation whilst still expanding energy access. The development of renewable energy can lead to the reduction in greenhouse gas emissions and can also have other benefits, such as contributing to the creation of new jobs, called “green jobs”. Additionally, indirect benefits such as a reduction in deforestation and soil erosion due to inefficient and unsustainable consumption of biomass. Incorrect burning of biomass can also lead to greenhouse gas emissions, and indoor smoke can cause respiratory diseases in children and adults.
2. Renewable Energy Resources in Nigeria
Over the past two decades (2000–2020), there has been a global push towards reducing greenhouse gas emissions. As a result, energy systems are moving towards low-carbon technologies such as renewable energy sources (hydropower, bioenergy, wind, solar, marine and geothermal) and nuclear energy. This process of transitioning from the use of fossil fuels to low-carbon energy sources is known as “decarbonisation”. The International Renewable Energy Agency reports that presently, approximately 33% of total electricity output globally is from renewable energy sources [5]. In Nigeria, the World Bank reports this figure as 18.2% in 2015 [6]. Nigeria is abundantly blessed with conventional and renewable energy sources. A map of Nigeria is presented in Figure 1. Alas, most of the available renewable resources are untapped. Table 1 presents the renewable potentials per resource type in Nigeria. The table shows that biomass, solar and large hydropower have the highest energy potential in Nigeria, but current utilisation is still low. Less than 30% of each renewable energy source potential is utilised.
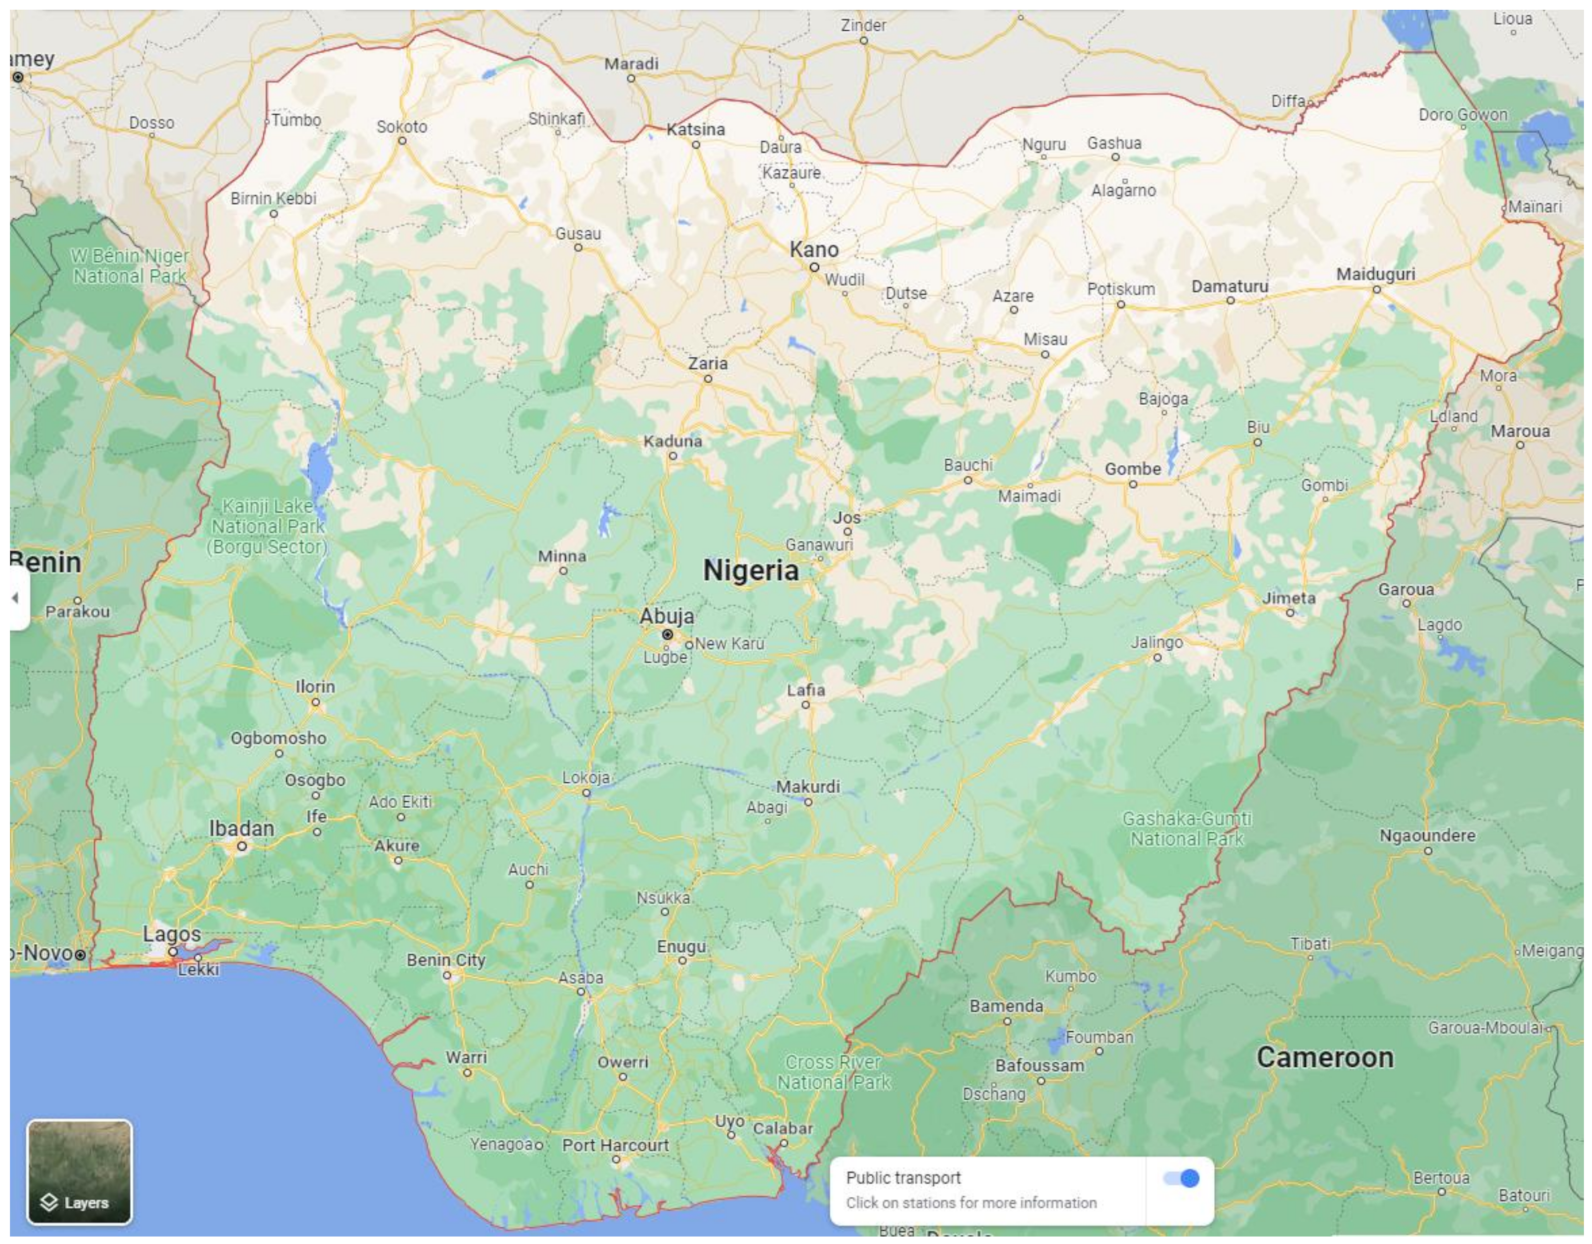
Figure 1. Map of Nigeria (plan view). Source: [7].
Table 1. Renewable energy potential. Data taken from [8].
| Resource | Potential | Current Utilisation |
|---|---|---|
| Wind | 2–4 m/s ( 10 m height mainland) |
N/A |
| Small Hydropower | 3500 MW | 64.2 MW |
| Large Hydropower | 11,250 MW | 1900 MW |
| Solar | 4–6.5 kWh/m2.day | 15 MW (dispersed solar PV) |
| Biomass | Municipal Waste | 0.5 kg/capita.day |
| Energy Crops | 28.2 million hectares of arable land (8.5% cultivated) | |
| Fuel Wood | 43.4 million tonnes/year (consumption) | |
| Agricultural Residues | 91.4 million tonnes/year (produced) | |
| Animal Waste | 245 million (assorted animals in 2001) |
Wind Energy
Wind energy potential and wind speed in Nigeria vary from approximately 2 m/s in the coastal region and 4 m/s in the far northern region (Table 1). The use of wind for electricity generation is relatively new due to rapid growth in technology. In order to transform the energy in moving air into mechanical energy, a range of conversion systems can be used, such as wind turbines, generators and dynamos [9]. A wind mapping project carried out by the Ministry of Science and Technology resulted in wind energy resource mapping in Nigeria. This indicated a very small and local potential for wind energy. In fact, Nigeria falls under a poor/moderate wind regime. Despite this, there are two large wind farm projects in Nigeria; a 10 MW project in Katsina and a 100 MW project in Plateau State [8].
Hydropower Energy
Hydropower is the world’s biggest source of renewable electricity generation supplying 70–80% and currently accounts for 16% of the world’s total power supply [10]. Nigeria is endowed with various bodies of water, including large rivers and natural falls, with 11 key river basins located around the country. The research shows that the river systems can provide a total of 70 micro dams, 126 mini dams and 86 small hydropower sites [11]. The total exploitable potential of hydropower resources in Nigeria is 3500 MW for small hydropower and a massive 11,250 MW for large hydropower, which is enough to solely power Nigerian electricity generation (Table 1). However, only 2% of small hydropower and 17% of large hydropower is currently being utilised. As a result, only 18.2% of electricity generation in Nigeria is derived from hydroelectric sources [12].
Solar Energy
Solar energy is one of the most promising renewable energy sources due to its apparent “limitless” potential. Nigeria has great potential for solar energy; the country is located within the “high sunshine belt” region and is just north of the equator. The annual average of total solar radiation varies from about 4 kWh/m2.day in the coastal regions to approximately 6.5 kWh/m2.day in the North (Table 1). The long-term average of GHI (Global Horizontal Irradiation) between 1994 and 2018 in Nigeria was approximately 1534 kWh/m2 yearly total in the coastal states such as Port Harcourt, whereas it increased to approximately 2264 kWh/m2 yearly total in northern states such as Sokoto, Kano and Maiduguri (see Figure 1). Average sunshine hours are estimated at 6 h per day. Due to the high irradiation in Nigeria, research has shown that if 1% of the land mass in Nigeria (920 km2) is covered with solar PV, it has the potential to generate over 200 GWh annually, which is nearly 10 times more than the current electricity generated [11]. However, the economic viability of solar PV is often questioned due to the levelised cost of energy (LCOE) and the high initial installation cost. Nevertheless, the World Bank suggests that PV and hybrid systems are already economically competitive for off-grid applications [8]. Solar PV, off-grid or mini-grid is ideal for rural communities not connected to the national grid. A GIS survey by GIZ identified 8000 clusters of 26 million people who can be served with solar mini-grids, generating a capacity of over 3000 MW [13].
Bioenergy (Biomass)
Biomass energy refers to the energy of biological systems such as wood and other biological materials. Biomass is considered to be carbon neutral due to no net gain in atmospheric CO2 when the fuel is burned [14]. Many technologies have been designed to turn biomass into an efficient, clean and sustainable energy, including direct combustion, co-firing, biomass gasification and anaerobic digestion, which involves using micro-organisms to break down the biomass and turn it into biogas [15]. Solid biomass and waste account for approximately 80% of total primary energy consumed in Nigeria [16]. A study by Simonyan and Fasina (2013) explored the annual bioenergy potential for each source of biomass in Nigeria (see Table 2).
Table 2. Bioenergy potential, Nigeria (2013). Data taken from [17].
| Source | Bioenergy Potential (GJ/Year) |
|---|---|
| Municipal Solid Waste | 186 |
| Energy Crops | 1700 × 106 |
| Forestry and Wood Residues | 18 × 10−3 |
| Agricultural Crop Residues | 604 × 106 |
| Human Waste | 8 |
| Animal Waste | 29 |
| Food and Feed Processing Waste | Limited |
| TOTAL | 2.3 × 10⁹ |
From Table 2, it is clear that energy crops and agricultural residues have the biggest potential for bioenergy production in Nigeria. Energy crops are grown specifically for energy; in Nigeria, this includes eucalyptus, poplar and jatropha. Out of the total land area in Nigeria (91,077 kha), approximately 78% (70,800 kha) is arable land [18]. Many agricultural crops such as cassava, maize and sugar cane, which are cultivated in Nigeria, can be converted into liquid and solid biofuels. However, this may lead to food competition and, hence, it is necessary to only use residues from the crops instead of the crops themselves. Table 3 shows the energy available from agricultural crops in Nigeria. The study by Simonyan (2013) [17] details the residue estimates from agricultural crops in Nigeria in 2010. However, by using data from The Food and Agriculture Organisation of the United Nations (FAOSTAT) (2020) [19] shown in Table 4, it is clear that crop production and, therefore, the total energy available has increased between 2010-2018. Therefore, the potential for biomass is much bigger than previously calculated.
Table 3. Residue estimates from agricultural crops in Nigeria (2010). Data taken from [8].
| Crop | Production (000t) | Component | Weigh Available in Million Tons | Total Energy Available (PJ) | Total Energy Available (GW) |
|---|---|---|---|---|---|
| Rice | 3368.24 | Straw | 7.86 | 125.92 | 34,977.8 |
| Husk | 1.19 | 23 | 6388.9 | ||
| Maize | 7676.85 | Stalk | 10.75 | 211.35 | 58,708.3 |
| Cob | 2.1 | 34.19 | 9497.2 | ||
| Husk | 0.92 | 14.32 | 3977.8 | ||
| Cassava | 42,533.17 | Stalks | 17.01 | 297.68 | 82,688.9 |
| Peelings | 76.56 | 812.3 | 225,638.9 | ||
| Groundnut | 3799.25 | Shells | 1.81 | 28.35 | 7875 |
| Straw | 4.37 | 76.83 | 21,341.7 | ||
| Soybean | 365.06 | Straw | 0.91 | 11.27 | 3130.6 |
| Pods | 0.37 | 4.58 | 1272.2 | ||
| Sugar Cane | 481.51 | Bagasse | 0.11 | 1.99 | 552.8 |
| Tops/Leaves | 0.14 | 2.21 | 613.9 | ||
| Cotton | 602.44 | Stalk | 2.25 | 41.87 | 11,630.6 |
| Millet | 5170.45 | Straw | 7.24 | 89.63 | 24,897.2 |
| Sorghum | 7140.96 | Straw | 7.14 | 88.39 | 24,552.8 |
| Cowpea | 3368.24 | Shell | 4.89 | 95.06 | 26,405.6 |
| Total | 145.62 | 1958.94 | 544,150.2 |
Table 4. Crop production, 2010 vs. 2018. Data taken from [19].
| Crop | Production (000 t) | Difference (%) | |
|---|---|---|---|
| 2010 | 2018 | ||
| Rice (paddy) | 4472.52 * | 6809.33 | +52.2% |
| Maize | 7676.85 | 10,155.03 | +32.3% |
| Cassava | 42,533.17 | 59,475.20 | +39.8% |
| Groundnut | 3799.25 | 2886.99 | –24% |
| Soybean | 365.06 | 758.03 | +107.7% |
| Sugarcane | 849.90 * | 1423.09 | +67.4% |
| Cotton | 602.44 | 270.53 | –55.1% |
| Millet | 5170.45 | 2240.74 | –56.7% |
| Sorghum | 7140.96 | 6862.34 | –3.9% |
| Cowpea | 3368.24 | 2606.91 | –22.6% |
| TOTAL | 75,978.84 | 93,488.19 | +23% |
* Figures differ from numbers given in the Simonyan (2013) study [17].
Another high source of biomass is municipal solid waste, which is produced by households and commercial and industrial businesses. This includes food waste, unwanted materials, street sweepings and more. The research shows that up to 87% of the municipal solid waste composition is organic, with an estimated 3168 million tonnes of waste generated each day in Nigeria (2010). This has the potential to generate 186 GJ of energy [18]. However, this potential is not utilised as municipal solid waste is sent to landfills. The study by Simonyan (2013) showed that in 2010, there were over 15 million tonnes of dry animal dung available in Nigeria, which gives a bioenergy potential of 29.25 GJ of energy. It is clear that abattoirs and cattle farms have the highest biogas potential.
Biomass consumption does have some environmental, health and socio-economic effects. Inefficient and unsustainable consumption of biomass can lead to deforestation and soil erosion. Inefficient and incorrect burning of biomass can also lead to greenhouse gas emissions, and indoor smoke can cause respiratory diseases in children and adults. Studies show that children exposed to indoor air pollution are 2–3 times more likely to catch pneumonia [20]. Lastly, biomass use can have negative effects on rural communities that have to collect the fuel. Oftentimes, young girls are withdrawn from school to attend to domestic chores related to biomass usage. Moreover, women often suffer health issues and physical pains from strenuous work collecting and using biomass such as wood.
Biogas is produced by the anaerobic digestion of biomass. A biogas digester creates a favourable environment for the fermentation process to occur. The digester consists of an airtight reservoir where suitable feedstock is placed; this can include human waste, cow dung and abattoir waste. Depending on the temperature and moisture content in the digester, it can take 6–25 days to fully process a batch of feedstock [21].
Animal wastes have a high potential for bioenergy production in Nigeria. The research shows that daily input of waste from a single cow can produce 1–2 kwh of electricity or 8–9 kwh of heat [21]. An increase in meat production has meant an increase in abattoirs and slaughterhouses in Nigeria. The wastes generated in these environments are ideal for biogas production in Nigeria. It is estimated that about 227,500 tonnes of fresh animal waste are produced daily in Nigeria. With 1 kg of waste generating 0.03 m3 of gas, Nigeria is capable of producing over 6 million m3 of biogas every day [22]. A study by Simonyan (2013) also reports on animal waste production and its potential for biogas yield in Nigeria (2010). This is detailed in Table 5. The study by Akinbami et al. (2000) [22] reports an improvement in gas quality when different types of waste are mixed together. This is presented in Table 6. Codigestion is important in biogas production, and Nigeria, being in a tropical region, can aid this process. This is useful for applications in which there are low quantities of each type of feedstock.
Table 5. Animal waste production and its potential for biogas in Nigeria (2010). Data taken from [17].
| Type | Population | Dry Matter Production Kg/Head/Day * | Amount of Dry Matter Produced Per Year Kg | Biogas Yield | |||
|---|---|---|---|---|---|---|---|
| Fraction Recoverable | Amount of Dry Matter Available Per Year Kg (×109) | m3/kg Dry Matter ** | Total Potential m3/Year (×109) | ||||
| Cattle | 18,871,339 | 2.86 | 1.970 × 10¹⁰ | 0.3 | 5.91 | 0.2 | 1.182 |
| Goat | 65,651,252 | 0.552 | 1.323 × 10¹⁰ | 0.4 | 5.292 | 0.25 | 1.323 |
| Pig | 6,040,820 | 0.66 | 1.457 × 10⁹ | 1 | 1.457 | 0.56 | 0.815 |
| Sheep | 37,422,554 | 0.329 | 4.493 × 10⁹ | 0.3 | 1.348 | 0.25 | 0.337 |
| Chicken | 101,676,710 | 0.043 | 1.596 × 10⁹ | 1 | 1.596 | 0.28 | 0.447 |
| Duck | 9,553,911 | 0.05 | 0.177 × 10⁹ | 0.9 | 0.159 | 0.56 | 0.089 |
| Total | 15.762 | 4.193 | |||||
* Daily dry matter production per cow. ** Dry matter density.
Table 6. Gas yield increase with mixed waste (40-day retention time). Data taken from [22].
| Wastes | Gas Production (m3/kg) | % Volume |
|---|---|---|
| Cattle | 0.380 | - |
| Pig | 0.569 | - |
| Poultry | 0.617 | - |
| Sewage | 0.265 | - |
| Weeds | 0.277 | - |
| Cattle + Pig (50:50) | 0.510 | +6 |
| Cattle + Sewage (50:50) | 0.407 | +16 |
| Cattle + Weeds (50:50) | 0.363 | +5 |
| Poultry + Sewage (50:50) | 0.413 | +1 |
| Poultry + Weeds (50:50) | 0.495 | +1 |
| Sewage + Weeds (50:50) | 0.387 | +39 |
There is a lack of data concerning the number of biogas digesters in use in Nigeria due to the fact that there is not a certified authority responsible for it within the government. However, multiple studies ([22][23][24][25]) focus on biogas potential in Nigeria using abattoir wastes. It was challenging to find up-to-date (in the last five years, 2015–2020) literature with information on biomass/biogas feedstock specifically based in Nigeria.
References
- IEA. SDG7: Data and Projections. 2019. Available online: https://www.iea.org/reports/sdg7-data-and-projections/access-to-electricity (accessed on 23 March 2020).
- Indrawati, S.M.; What You Need to Know about Energy and Poverty. World Bank Blogs. 2015. Available online: https://blogs.worldbank.org/voices/what-you-need-know-about-energy-and-poverty (accessed on 4 April 2020).
- The World Bank. Access to Electricity (% of Population)—Nigeria. 2018. Available online: https://data.worldbank.org/indicator/EG.ELC.ACCS.ZS?end=2018&locations=NG&start=1990&view=chart (accessed on 31 March 2020).
- National Council on Power. Federal Republic of Nigeria Sustainable Energy for All Action Agenda (Se4All-Aa). 2016, p. 12. Available online: https://www.seforall.org/sites/default/files/NIGERIA_SE4ALL_ACTION_AGENDA_FINAL.pdf (accessed on 23 March 2020).
- IRENA. Renewable Energy Statistics 2019. Abu Dhabi. 2019. Available online: https://www.irena.org/-/media/Files/IRENA/Agency/Publication/2019/Jul/IRENA_Renewable_energy_statistics_2019.pdf (accessed on 8 May 2020).
- Trading Economics. Nigeria—Renewable Electricity. 2020. Available online: https://tradingeconomics.com/nigeria/renewable-electricity-percent-in-total-electricity-output-wb-data.html (accessed on 27 March 2020).
- Google Maps. “Image of Nigeria”. Available online: https://goo.gl/maps/v5aXg4DRMu9PBd477 (accessed on 9 June 2022).
- GIZ. The Nigerian Energy Sector. 2015. Available online: https://www.giz.de/en/downloads/giz2015-en-nigerian-energy-sector.pdf (accessed on 13 May 2020).
- Vincent, E.N.; Yusuf, S.D. Integrating Renewable Energy and Smart Grid Technology into the Nigerian Electricity Grid System. Smart Grid Renew. Energy 2014, 5, 220–238.
- 49. International Hydropower Association (IHA). Hydropower Status Report 2019; International Hydropower Association: London, UK, 2019; pp. 1–83.
- GET.invest. Nigeria—Renewable Energy Potential. Available online: https://www.get-invest.eu/market-information/nigeria/renewable-energy-potential/ (accessed on 5 June 2020).
- The World Bank. Electricity Production from Hydroelectric Sources (% of Total)’. 2014. Available online: https://data.worldbank.org/indicator/EG.ELC.HYRO.ZS (accessed on 13 May 2020).
- Ogunleye, E.K. Political Economy of Nigerian Power Sector Reform. Helsinki. 2016. Available online: https://www.wider.unu.edu/publication/political-economy-nigerian-power-sector-reform (accessed on 6 April 2020).
- thisiseco. The Difference between Biomass and Biogas. 2020. Available online: https://www.thisiseco.co.uk/news_and_blog/the-difference-between-biomass-and-biogas.html (accessed on 17 April 2020).
- Olaoye, T.; Ajilore, T.; Akinluwade, K.; Omole, F.; Adetunji, A. Energy Crisis in Nigeria: Need for Renewable Energy Mix. Am. J. Electr. Electron. Eng. 2016, 4, 1–8.
- Ben-Iwo, J.; Manovic, V.; Longhurst, P. Biomass resources and biofuels potential for the production of transportation fuels in Nigeria. Renew. Sustain. Energy Rev. 2016, 63, 172–192.
- Simonyan, K.J. Biomass resources and bioenergy potentials in Nigeria. Afr. J. Agric. Res. 2013, 8, 4975–4989.
- RECP. Captive Power in Nigeria. 2015. Available online: https://www.get-invest.eu/wp-content/uploads/2019/06/RECP-Market-Study_Captive-Power_Nigeria_2016.pdf (accessed on 6 June 2020).
- FAO. Crops. Food and Agriculture Organisation of the United Nations. 2020. Available online: http://www.fao.org/faostat/en/#data/QC (accessed on 3 May 2020).
- Suleiman, S.; Idris, M.B. Biomass Consumption in Nigeria: Trends and Policy Issues. J. Agric. Sustain. 2016, 9, 127–157. Available online: http://infinitypress.info/index.php/jas/article/viewFile/1316/593 (accessed on 12 May 2020).
- Brown, V.J. Biogas: A bright idea for Africa. Environ. Health Perspect. 2006, 114, 300–303.
- Akinbami, J.-F.; Ilori, M.; Oyebisi, T.; Akinwumi, I.; Adeoti, O. Biogas energy use in Nigeria: Current status, future prospects and policy implications. Renew. Sustain. Energy Rev. 2021, 5, 97–112.
- Adeoti, O.; Ayelegun, T.A.; Osho, S.O. Nigeria biogas potential from livestock manure and its estimated climate value. Renew. Sustain. Energy Rev. 2014, 37, 243–248.
- Ozor, O.C.; Agah, M.V.; Ogbu, K.I.; Nnachi, A.U.; Udu-ibiam, O.E.; Agwu, M.M. Biogas Production Using Cow Dung from Abakaliki Abattoir in South-Eastern Nigeria. Int. J. Sci. Technol. Res. 2014, 3, 237–239.
- Odekanle, E.L.; Odejobi, O.; Dahunsi, S.; Akeredolu, F. Potential for cleaner energy recovery and electricity generation from abattoir wastes in Nigeria. Energy Rep. 2020, 6, 1262–1267.
More
Information
Subjects:
Energy & Fuels
Contributors
MDPI registered users' name will be linked to their SciProfiles pages. To register with us, please refer to https://encyclopedia.pub/register
:
View Times:
14.3K
Revisions:
2 times
(View History)
Update Date:
17 Aug 2022
Table of Contents


Notice
You are not a member of the advisory board for this topic. If you want to update advisory board member profile, please contact office@encyclopedia.pub.
OK
Confirm
Only members of the Encyclopedia advisory board for this topic are allowed to note entries. Would you like to become an advisory board member of the Encyclopedia?
Yes
No
${ textCharacter }/${ maxCharacter }
Submit
Cancel
Back
Comments
${ item }
|
${ item.createdUser.fullName }
${ item.createdAt }
${ item.vote }
${ item.reply }
Delete
${ reply.createdUser.fullName }
${ reply.createdAt }
${ reply.vote }
Delete
There is no reply to this comment~
${ item.replyTextCharacter }/${ item.replyMaxCharacter }
Submit
Cancel
More
No more~
There is no comment~
${ textCharacter }/${ maxCharacter }
Submit
Cancel
${ selectedItem.replyTextCharacter }/${ selectedItem.replyMaxCharacter }
Submit
Cancel
Confirm
Are you sure to Delete?
Yes
No