| Version | Summary | Created by | Modification | Content Size | Created at | Operation |
|---|---|---|---|---|---|---|
| 1 | Ravi Summinga-Sonagadu | + 876 word(s) | 876 | 2019-01-26 08:34:32 | | | |
| 2 | Ravi Summinga-Sonagadu | + 922 word(s) | 922 | 2019-01-26 09:19:40 | | | | |
| 3 | Peter Tang | -8 word(s) | 914 | 2020-10-30 09:50:38 | | |
Video Upload Options
Despite the growing amount of research in the field of high frequency financial data analysis, few studies have focused on model validation and high-frequency risk measures. This study contributes to the literature in the following ways:
- A rigorous model validation, both in terms of in-sample fit and out-sample performance for the MC-GARCH model under five error distributions is provided. Statistical and graphical tests are conducted to validate the models.
- One component of the MC-GARCH model is the daily variance forecast. For this purpose, the GARCH(1,1) and EGARCH(1,1) under the five error distributions are compared and the best model among the 10 GARCH models is used to forecast the daily variance.
- The modelling and forecasting performance of the MC-GARCH model under different distributional assumptions is assessed in this study.
- The 99% intraday VaR is forecasted and three backtesting procedures are used. This is the first study to assess the VaR predictive ability of the MC-GARCH models by using an asymmetric VaR loss function.
- This is the first study to forecast the intraday expected shortfall under different distributional assumptions for the MC-GARCH model. Again, three backtests are used including the recently proposed ES regression backtest.
Due to the high importance of risk management, the results of this study may contribute in many fields. This study is highly relevant to the banking industry since banks are required to calculate risk metrics on a daily basis for internal control purposes and for determining their capital requirements. Risk measurement is also essential to the insurance industry from the pricing of insurance contracts to determining the Solvency Capital Requirement (SCR) and therefore the results of this study might be useful. Any other organisation having an exposure to some kind of financial risk might benefit from this study.
1. Introduction
This paper [1] presents the results of the first empirical study (to the best of the authors' knowledge) in: (1) forecasting the intraday Expected Shortfall (ES) under different distributional assumptions for the MC-GARCH model; (2) assessing the MC-GARCH model under the Generalised Error Distribution (GED) innovation; (3) evaluating and ranking the VaR predictability of the MC-GARCH models using an asymmetric loss function.
A typical question which sparks a lot of interest in the high frequency trading literature concerns which GARCH model tends to be the best when it comes to forecasting the intradaily risk metrics such as Value-at-Risk (VaR) and Expected Shortfall (ES). This paper therefore focuses on the performance analysis of the MC-GARCH model in forecasting 1-min VaR and 1-min ES.
The first objective of this study was to determine which GARCH-type model gives the best in-sample fit to the daily EUR/USD returns for the daily variance forecast for the MC-GARCH model. It was found that overall the EGARCH(1,1) models were preferred over the GARCH(1,1) models. The EGARCH model under the GED innovation assumption however yielded the best results.
The second aim of the study was to analyse the effects of different distributional assumption for the innovation process of the GARCH models for both model fitting and forecasting. Overall, it was found that non-normal distributional assumptions gave better results for model fitting as well as forecasting. This is due to the fact that non-normal distributions are able to take into account features such as excess kurtosis and asymmetry of the high-frequency EUR/USD returns. Furthermore, they are able to replicate these features when forecasting volatility. The MC-GARCH(1,1) model under the GED innovation assumption actually gave the best fit to the intraday data as per the ranking procedure carried out based on AIC, BIC and log-likelihood criteria.
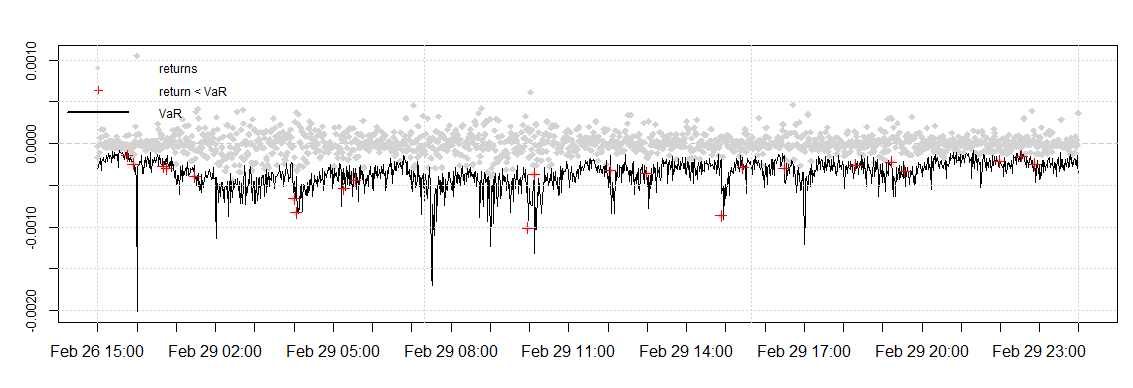
The one day ahead 99% intraday VaR values were forecasted using the MC-GARCH models. Three VaR backtesting procedures were carried out namely the Kupiec's test, the VaR duration-based backtest and a backtest based on an asymmetric VaR loss function. Based on the number of VaR violations, the MC-GARCH(1,1) model under the GED distribution gave the best results. When the asymmetric VaR loss function which is a more robust backtest procedure was implemented, the MC-GARCH(1,1) model under the skewed students-t distribution minimised the loss function with the smallest value and proved to be the best model. The graphical result is presented in Figure 1 below.
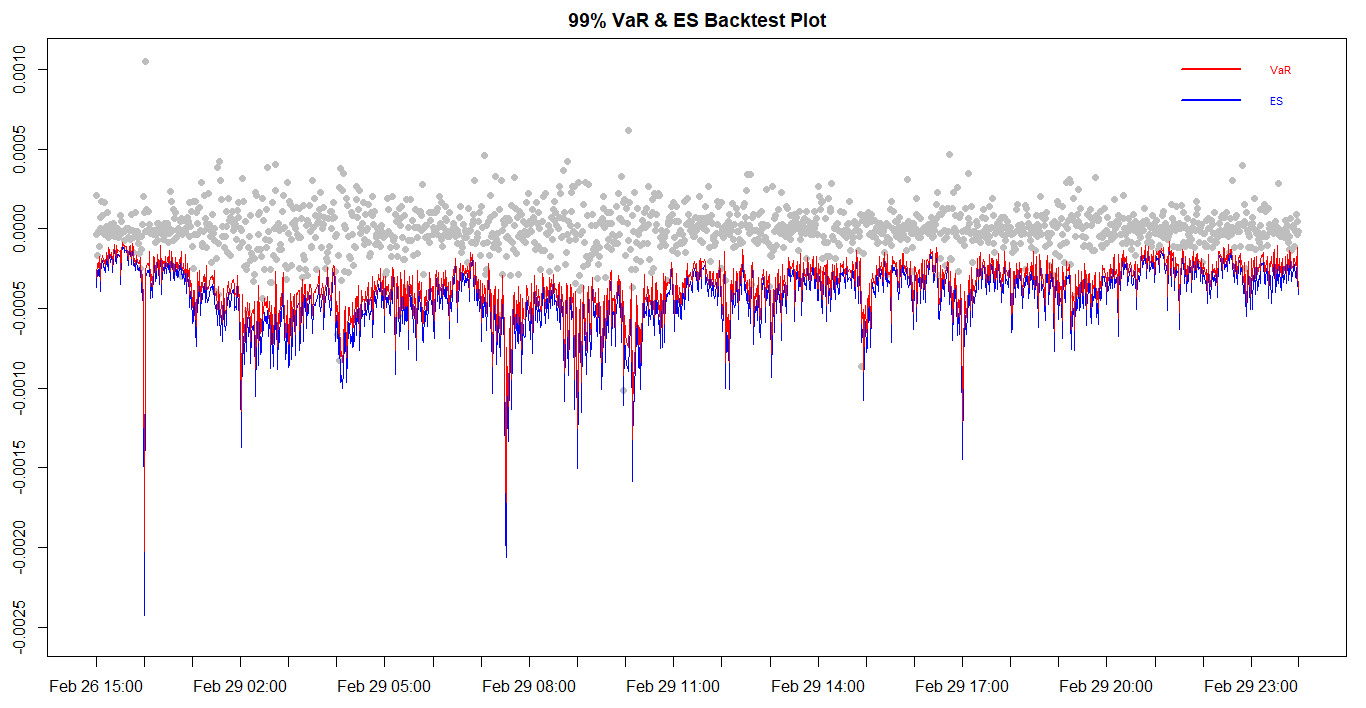
The one-day ahead 99% intraday ES was also forecasted using these models. Three backtesting procedures were employed for the ES, namely the Bivariate ES regression backtest, the Exceedance Residuals backtest and the V-tests. It was found that the MC-GARCH models under the non-normal distribution assumptions are able to produce accurate intraday ES forecasts. The MC-GARCH(1,1) model under the GED distribution however yields the best results. The graphical result is presented in Figure 2 below.
2. Graphical results:

Figure 1. Value-at-Risk backtest plot for the MC-GARCH model under the Student's-t distribution.

Figure 2. Expected Shortfall and VaR backtest plot for the MC-GARCH model under the GED distribution.
3. Recommendations for Practitioners
It is recommended to avoid the use of normal innovation distribution for MC-GARCH modelling as it significantly overestimates risk. Such risk overestimation in the insurance and banking industry may actually lead to excess of capital requirements which may be unnecessary and hence loss-making for the institution. The MC-GARCH under other innovation distributions such as Students-t, the Skewed Students-t distribution (sstd), the reparametrised Johnson SU (JSU) and the Generalized Error Distribution (GED) also overestimates the risk metrics but yield empirical sizes closer to the expected size for both the VaR and ES. It is however recommended to employ the MC-GARCH(1,1) model under the GED distribution as it yields least overestimation results, which minimise the excess of capital requirement.
References
- Ravi Summinga-Sonagadu and Jason Narsoo; Risk Model Validation: An Intraday VaR and ES Approach Using the Multiplicative Component GARCH. Risks 2019, 7, 10, https://doi.org/10.3390/risks7010010.


