1. Polar Vortex and Its Role in Atmospheric Processes
The stratospheric polar vortex is a large-scale cyclonic circulation that forms in the cold air mass over the Polar region during cold half of the year and that extends from the middle troposphere to the stratosphere. Vortex formation is due to the cooling of the air mass over an icy surface under the conditions of negative net radiation balance. The cooling and subsidence of the air results in a pressure increase near the Earth’s surface (formation of a near-surface anticyclone). Due to high density of cold air, a lowering of isobaric levels takes place, so simultaneously with an increase in surface pressure, a low-pressure area is formed at the 500 hPa level and above (e.g.,
[1]) A circular eastward motion of air arises, which isolates the polar air from the warmer air of mid-latitudes, contributing to a temperature decrease inside the vortex.
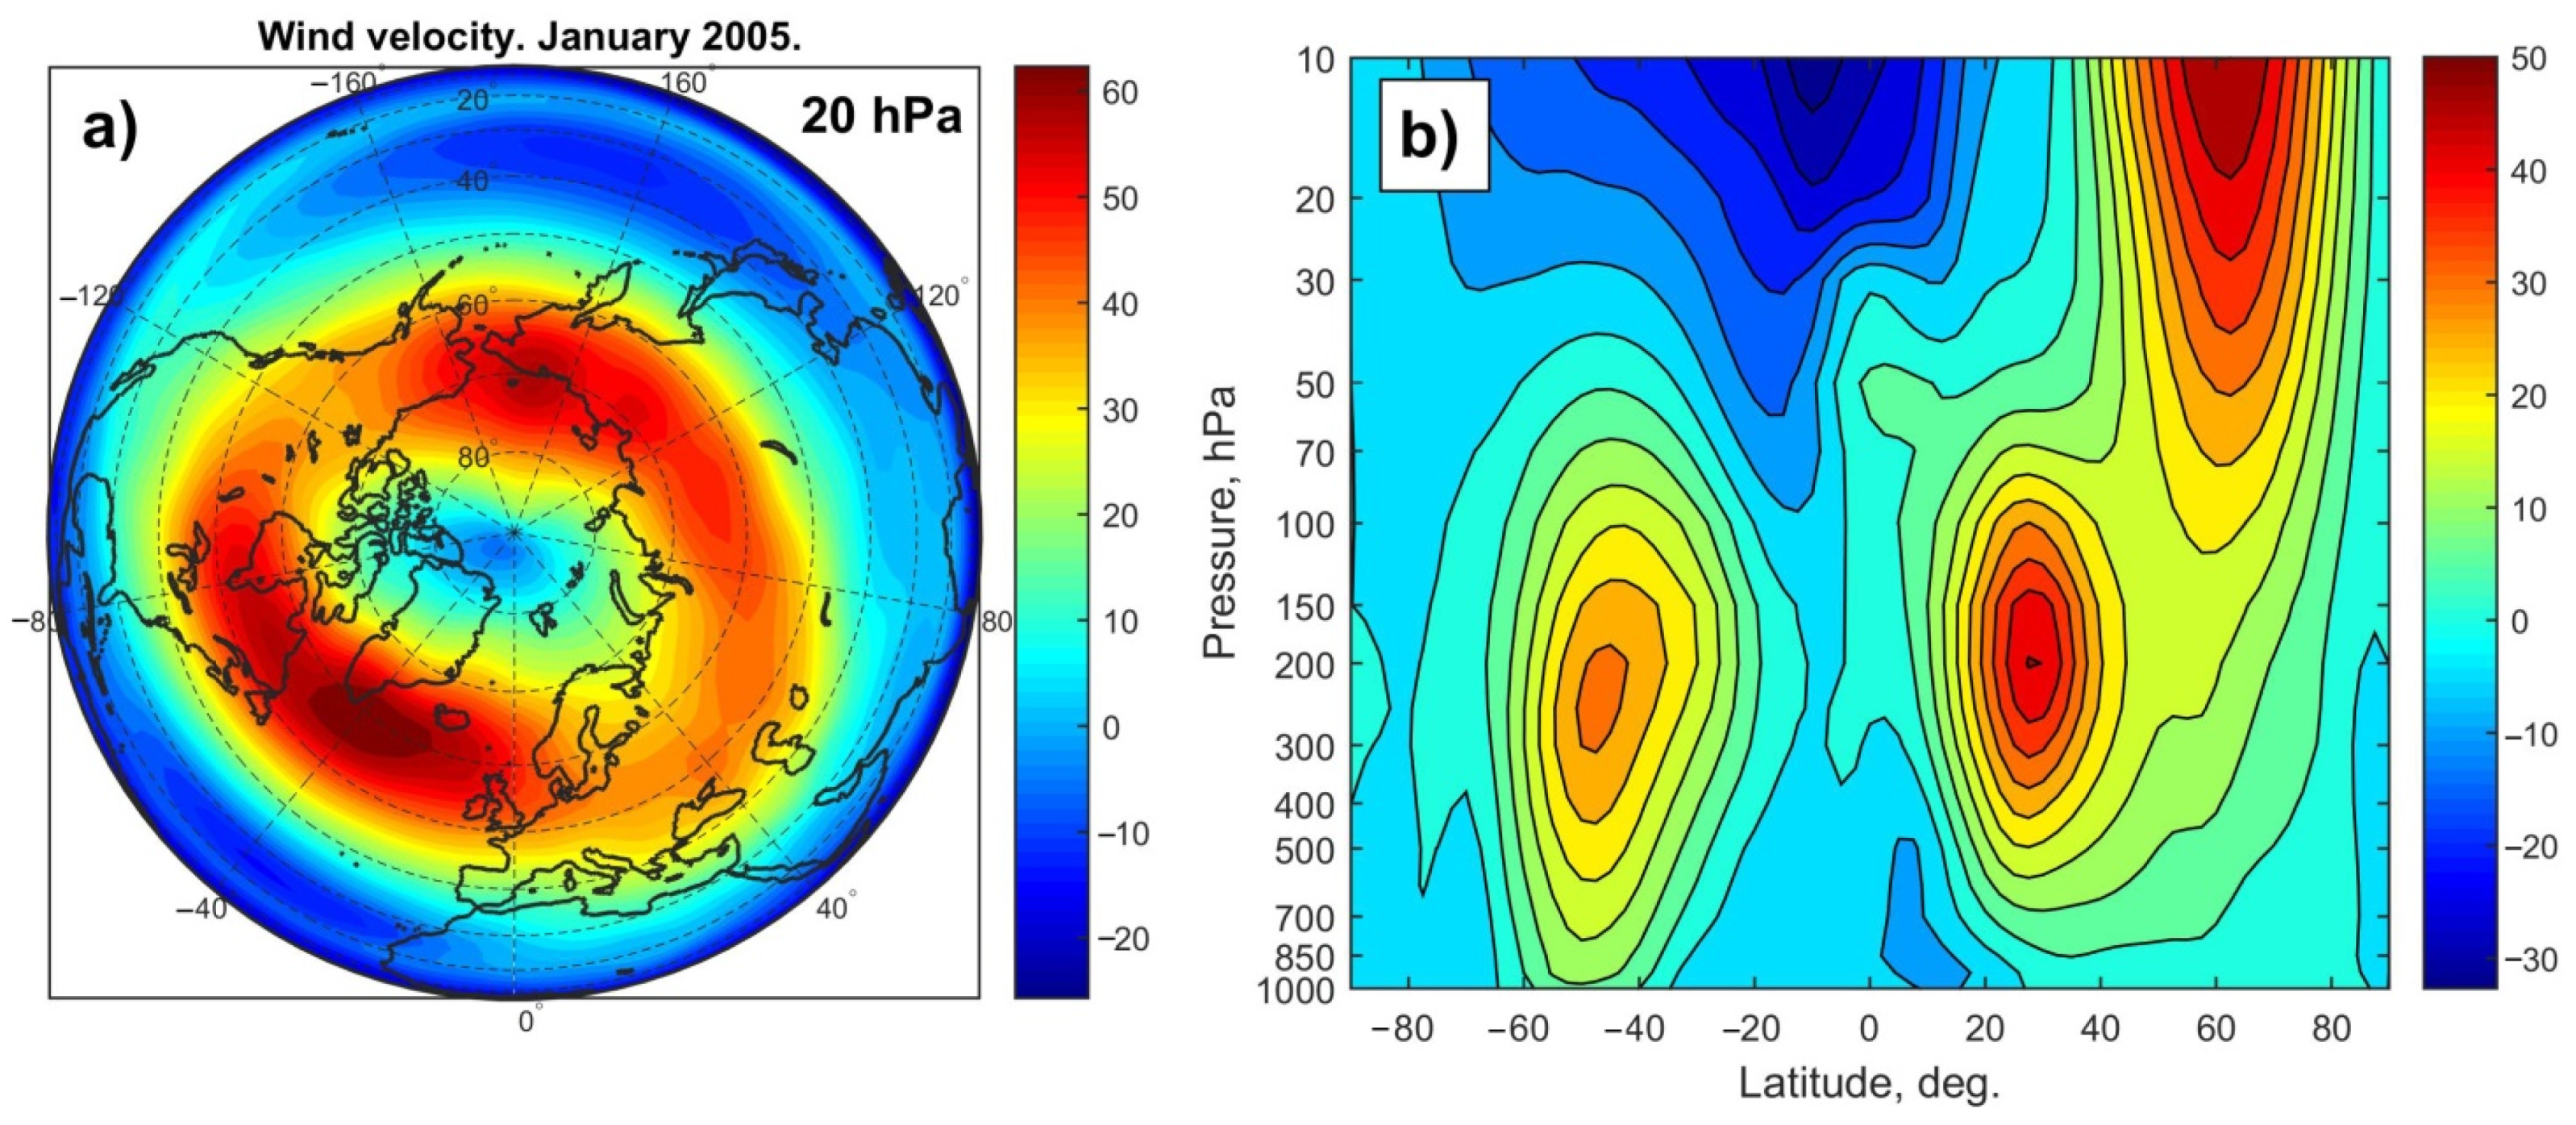
Figure 1a presents the distribution of the mean monthly velocity of zonal winds, with the positive direction being from west to east, at the stratospheric level of 20 hPa (~27 km) in January 2005 (the Northern Hemisphere) according to NCEP-DOE (National Centers for Environmental Prediction—Department of Energy) reanalysis-2 data
[2]. The vortex is seen as a belt of strong western winds at latitudes ~50–80° N. In
Figure 2b, zonally averaged (averaged over latitude circles) values of zonal wind velocity are presented for different altitudes. The data show the strengthening of stratospheric winds with altitude in the Northern (winter) Hemisphere, with the wind velocity reaching ~50–60 m·s
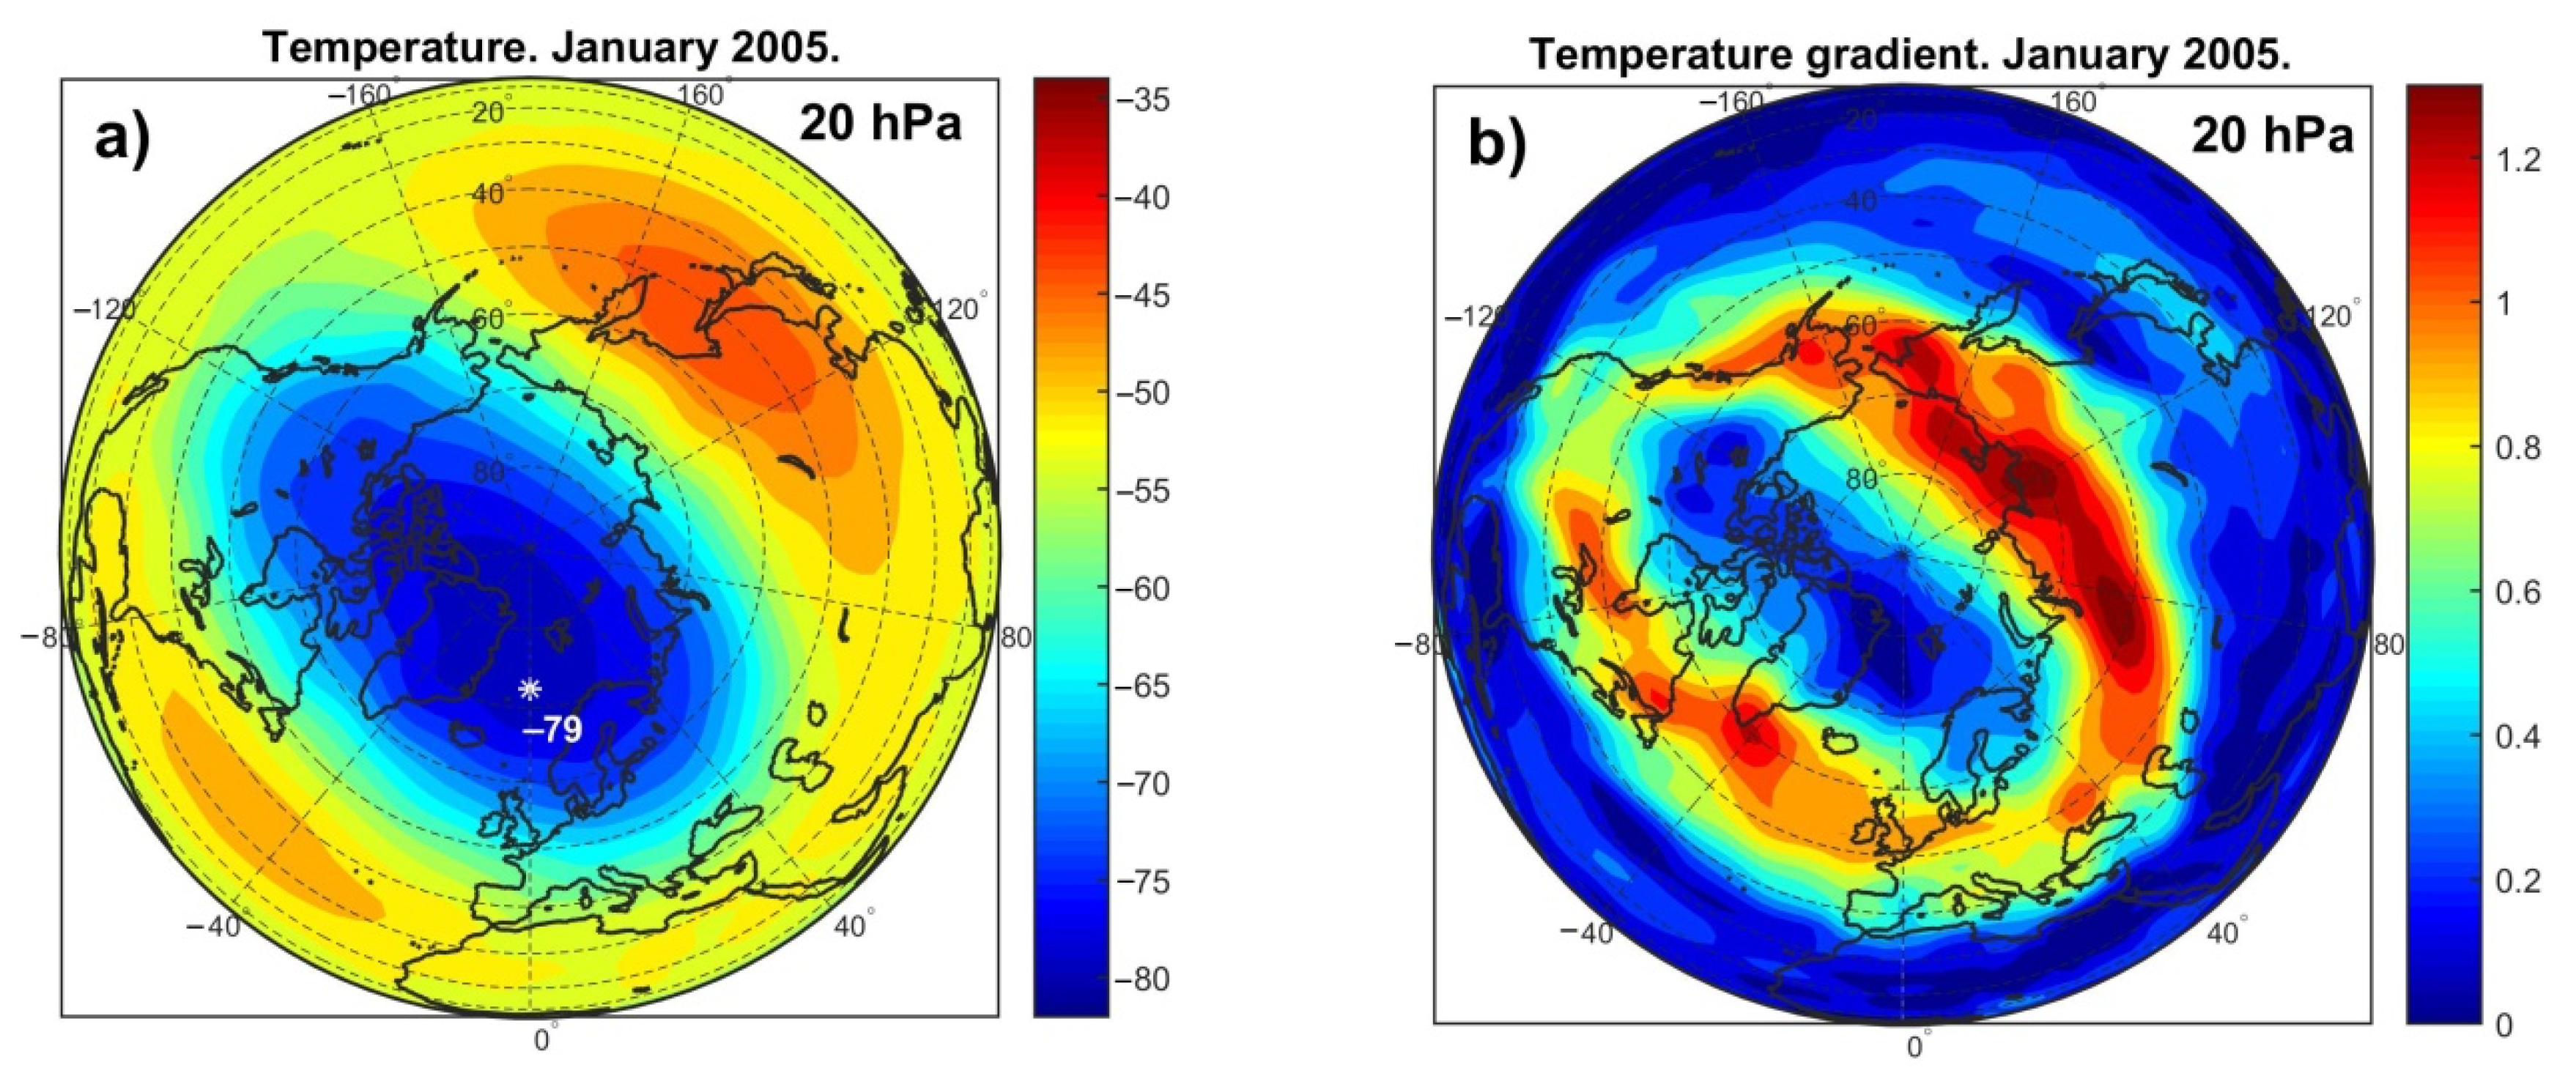
−1 at the upper levels. The distributions of the mean monthly values of the temperature and the magnitude of the horizontal temperature gradients at the level 20 hPa are presented in
Figure 2 for January 2005 and use NCEP/NCAR (National Centers for Environmental Prediction/National Center for Atmospheric Research) reanalysis data
[3]. One can see temperature lowering inside the polar vortex, with temperature gradients being enhanced at its edges.
Figure 1. (a) Distribution of mean monthly velocity of zonal wind (in m·s−1) at the 20 hPa level in the Northern Hemisphere in January 2005; (b) mean monthly values of zonally averaged velocities of zonal wind (in m·s−1) at different altitudes, January 2005.
Figure 2. (a) Distribution of mean monthly temperature (in °C) at the 20 hPa level in the Northern Hemisphere in January 2005. The white asterisk indicates the minimal temperature inside the vortex; (b) distribution of mean monthly magnitude of the horizontal gradient of temperature (in °C/100 km) at the 20 hPa level in January 2005.
The polar vortex is known to be an important element in the large-scale circulation of the atmosphere, which plays an important part in a number of atmospheric processes. In particular, air cooling inside the vortex to very low temperatures (−80 °C and below) creates conditions for the formation of Polar Stratospheric Clouds. Heterogeneous chemical reactions on the surfaces of cloud particles result in the production of chlorine, which participates in a catalytic cycle of ozone destruction contributing to the formation of ozone holes in Antarctica
[4]. The location and state of the vortex affect the development of large-scale dynamic processes in the troposphere, for example, the North Atlantic Oscillation (NAO) and Arctic Oscillation (AO). Baldwin and Dunkerton
[5] showed that under strong vortex regimes, the NAO and AO indices tend to be positive and that the tracks of extratropical cyclones shift to the north. Gudkovich and colleagues
[6] linked the alternations of cold and warm epochs in the Arctic with changes in the vortex state, warm and cold epochs being associated with strong and weak vortex regimes, respectively. Labitzke
[7] was the first to reveal that the effects of solar activity on the characteristics of the stratosphere and troposphere depend on the phase of the quasi-biennial oscillations (QBO) in the atmosphere, which is determined by the wind direction in the equatorial stratosphere. As the polar vortex tends to be stronger during the west phase of the QBO
[8], the findings by Labitzke suggest that the polar vortex strength may also influence the atmosphere response to solar variability.
2. Temporal Variability of Solar Activity Effects on the Lower Atmosphere Characteristics: Previous Data
Temporal variability in the correlation links between the lower atmosphere characteristics and solar activity phenomena is a fairly common phenomenon. This variability was first detected by W. Köppen
[9] when studying links between air temperatures in the Northern Hemisphere and solar activity. He found 11-year variations in the studied temperatures that correlated with Wolf numbers; however, the correlation sign was not constant, being positive from 1777 to 1790 and negative from 1815 to 1854.
An analysis of the data from 300 meteorological stations around the world by Sánchez Santillán and colleagues
[10] showed that the signs of correlations between meteorological variables (barometric pressure, air temperature, and precipitation) and sunspot numbers were reversed in the 1920s at nearly half of the stations. The authors linked the detected correlation reversals with secular variations in solar brightness. Changes in the correlation links between surface air temperatures and sunspot numbers in the 11-year cycles were studied by Georgieva and colleagues
[11]. According to their data, at most of the meteorological stations, the correlations were positive in the 18th and 20th centuries and negative in the 19th century. The authors related the correlation reversals to changes in the North–South asymmetry of solar activity A = (S
N − S
S)/(S
N + S
S), where S
N and S
S represent the total sunspot area in the Northern and Southern solar hemispheres, respectively. When the Northern Hemisphere dominated (A > 0), temperature was found to be higher at solar maxima and lower at sunspot minima. On the contrary, when the Southern Hemisphere was more active (A < 0), temperature was higher at solar minima than at solar maxima.
The reversal of correlation links between the North Atlantic Oscillation and the solar/geomagnetic indices were detected in a number of studies
[11][12][13][14]. Thejll and colleagues
[12] noted that the correlation between the NAO and geomagnetic aa-index was high and significant only for the winter season. From the end of the 19th century to ~1950, the correlation was negative; its sign was then reversed near 1950, and in the 1970s, the positive correlation became statistically significant. The authors suggest that in the 1970s, changes took place in the atmosphere state, and it became more sensitive to solar influence. The data by Lukianova and Alexeev
[13] confirmed the correlation reversal between the NAO and aa-index around 1950.
Long-term variations in the correlation links between the NAO and sunspot numbers were studied by Georgieva and colleagues
[11]. It was shown that the NAO index was negatively correlated with solar characteristics in the 20th and 18th centuries and positively correlated with them in the 19th and 17th centuries. The authors related the secular variations in the correlation links to long-term variations in the North–South asymmetry of solar activity. In the work by Georgieva and colleagues
[14], it was suggested that the periods of negative and positive correlation between the NAO and solar/geomagnetic activity may be caused by changes in the relative contribution of the solar agents associated with the toroidal and poloidal fields of the Sun (coronal mass ejections and high-speed solar wind streams from coronal holes, respectively) in geomagnetic activity. It was shown that until the 19th solar cycle, the main contribution was made by toroidal field-related agents, while from the 20th cycle onward, the main drivers of geomagnetic activity became poloidal field-related ones.
3. Spatial and Temporal Variability in Galactic Cosmic Ray Effects on Troposphere Pressure
It is known that solar activity can influence the atmosphere through a number of different physical agents, such as the total and ultraviolet radiation, X-rays, solar wind and interplanetary magnetic field disturbances, and energetic particles. An important part in solar–atmospheric links is played by cosmic rays, both of galactic and solar origin (GCRs and SCRs, respectively) (e.g.,
[15][16][17][18][19]). These particles can penetrate into the middle and lower atmosphere and are the major ionization sources at these heights
[20]. In addition to their high penetrating capability, fluxes of these particles are strongly influenced by solar activity. Unlike SCR bursts, which are associated with solar flare activity and occur sporadically, GCRs arrive at the Earth constantly, and their fluxes are modulated by solar activity on different time scales. In particular, they decrease by a factor of ~2 at the maxima of the 11-year solar cycle, with the correlation coefficients between the mean yearly values of GCR fluxes and sunspot numbers amounting to about −0.8. A noticeable influence of short-term variations in solar and galactic cosmic ray fluxes on the development of dynamic processes at extratropical latitudes was revealed in the studies by Veretenenko and colleagues
[21][22][23].
Let us consider the temporal variability in the correlation links between pressure in the lower troposphere and GCR intensity in the 11-year cycle. The results of the studies by Veretenenko and Ogurtsov
[24][25] showed a strong latitudinal and regional dependence of the GCR effects on pressure variations, which seems to be determined by peculiarities of the baric systems forming in different regions.
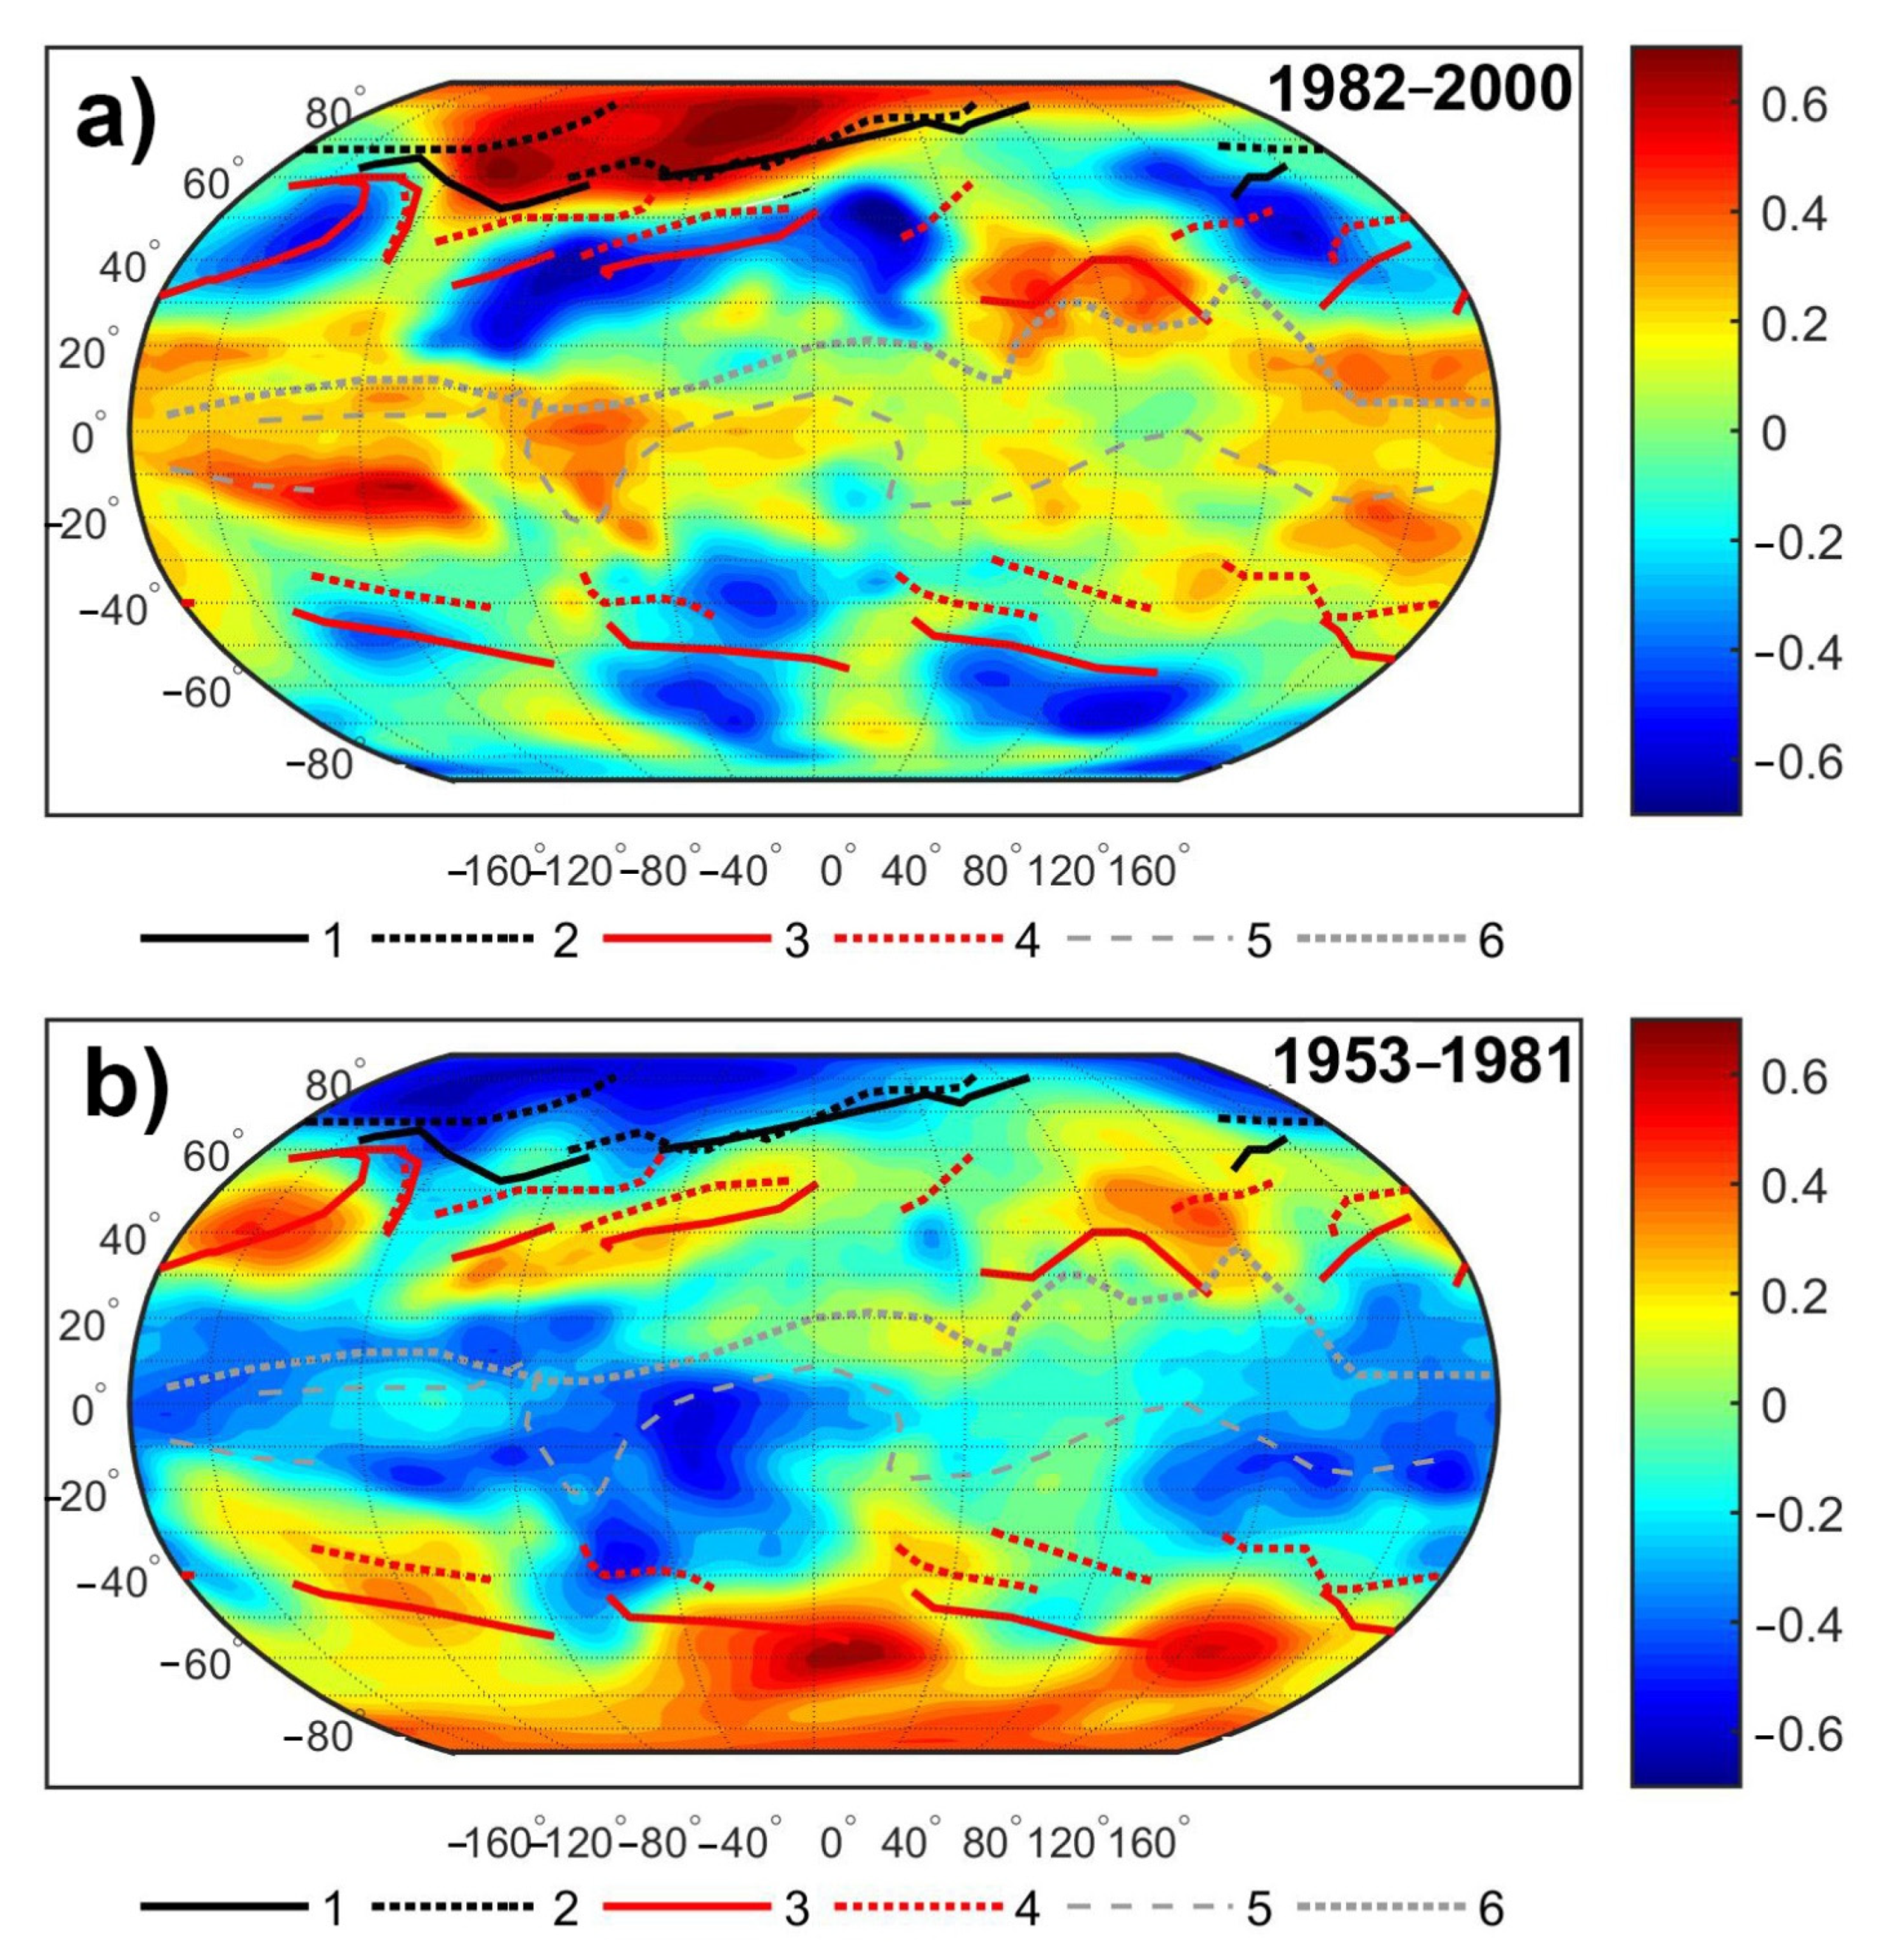
Figure 3 presents the spatial distribution of the correlation coefficients between pressure and GCR variations, with the linear trends being removed, for two different time periods: 1953–1981 and 1982–2000. Troposphere pressure was characterized by the mean yearly values of geopotential heights at the 700 hPa level (GPH700) obtained from the NCEP/NCAR reanalysis archive
[3]. To characterize GCR intensity, the mean yearly values of the neutron monitor (NM) counting rate in Climax (geographic coordinates φ = 39° N, λ = 106° W, geomagnetic cut-off rigidity 2.99 GV) were used (the Climax data are available for 1953–2005 at
ftp://ftp.ngdc.noaa.gov/STP/, accessed on 17 January 2007). To account for the autocorrelation in the studied data, the statistical significance of the correlation coefficients was estimated using the random-phase test
[26].
Figure 3. Spatial distribution of the correlation coefficients between mean yearly values of GPH700 and NM counting rate in Climax for the periods 1982–2000 (a) and 1953–1981 (b). Curves 1 and 2 show the climatic positions of Arctic fronts in January and July, respectively. Similarly, curves 3 and 4 are the same for Polar fronts; curves 5 and 6 are the same for the equatorial trough axis.
The mean long-term (climatic) positions of Arctic and Polar fronts, which are the main atmospheric fronts at extratropical latitudes, are also shown in
Figure 3 according to the data by Khromov and Petrociants
[27]. Arctic fronts separate cold air masses forming in the Arctic region from the warmer air of middle latitudes, whereas Polar fronts separate mid-latitudinal and tropical air masses. They play an important part in cyclonic activity at middle latitudes, as the formation and evolution of extratropical cyclones are closely associated with these fronts. Thus, climatic Polar fronts may be considered to be the regions of maximum occurrence of cyclone centers and indicate the main directions of their movement.
The data in Figure 3 show that the correlations between troposphere pressure and GCR fluxes are observed over the entire globe for both of the studied time intervals, i.e., disturbances associated with GCR variations cover the troposphere of the whole Earth. However, one can see a strong regional dependence of the GCR-correlated pressure variations, with several large areas of positive and negative correlation being observed. It should also be noted that the distribution of the correlations is closely related to the climatic atmospheric fronts.
In the period 1982-2000 (Fig.3a), a strong positive correlation was detected in the Polar region of the Northern hemisphere bounded by Arctic fronts, where high-pressure systems (anticyclones) are usually formed. The negative correlation was observed at Polar fronts of middle latitudes, which indicates that GCR increases in the studied period were accompanied by more intensive formation and deepening of extratropical cyclones associated with these fronts. In the previous period, 1953-1981 (Fig.3b), a distribution of the correlation coefficients between pressure and GCR fluxes was quite similar to that in 1982-2000, i.e., it can be seen the same large areas whose positions are closely related to the climatic atmospheric fronts. However, the signs of correlations in all these areas were quite opposite to those in 1982-2000.
The dependence of the spatial distribution of the correlation coefficients on the climatic front positions suggests that GCR variations influence the development of baric systems associated with these fronts. The reversal of pressure–GCR correlations near 1980 is in good agreement with the reversal detected in the correlations between air temperatures at most of the meteorological stations and sunspot numbers at the same time
[11]. The correlation reversal also suggests long-term variability in the correlation links between dynamic processes in the atmosphere and solar activity, which may be caused by changes in the atmosphere state on the multidecadal time scale.
4. Temporal Variability of Solar Activity Effects on Troposphere Pressure in the Northern Hemisphere and the Epochs of Large-Scale Circulation
Let us consider temporal variations of solar activity effects on troposphere pressure for a longer time interval. As instrumental data on the intensity of GCRs, which represent a direct input to the atmosphere, are available only from the 1950s onward, sunspot numbers SSN (according to a new version
[28]) were used. Unlike GCRs, sunspot numbers do not represent a physical agent influencing the atmosphere directly; however, they can be used as markers of the 11-year cycles that strongly modulate GCR fluxes, and the length of their time series is rather long. To characterize dynamic processes in the atmosphere, sea level pressure data were taken from the MSLP (Mean Sea Level Pressure) archives of the Climatic Research Unit, University of East Anglia (
https://crudata.uea.ac.uk/cru/data/pressure, accessed on 10 August 2004) for the period of 1873–2000 and the Earth System Research Laboratory, NOAA (
https://www.esrl.noaa.gov/psd/repository, accessed on 7 November 2017) from 1979 onward.
As shown above, the most pronounced GCR effects on the troposphere dynamics were detected at extratropical latitudes, with the correlation coefficients between pressure and GCR intensity at middle and polar latitudes in the Northern Hemisphere being in opposite phases. Thus, the correlation coefficients between sea level pressure and sunspot numbers were studied for the Polar region (60–85° N) and for the North Atlantic Polar frontal zone (zone of most intensive cyclone formation) along the eastern coasts of North America (20–30° N, 280–300° E and 30–40° N, 290–310° E) in the work by Veretenenko and Ogurtsov
[29].
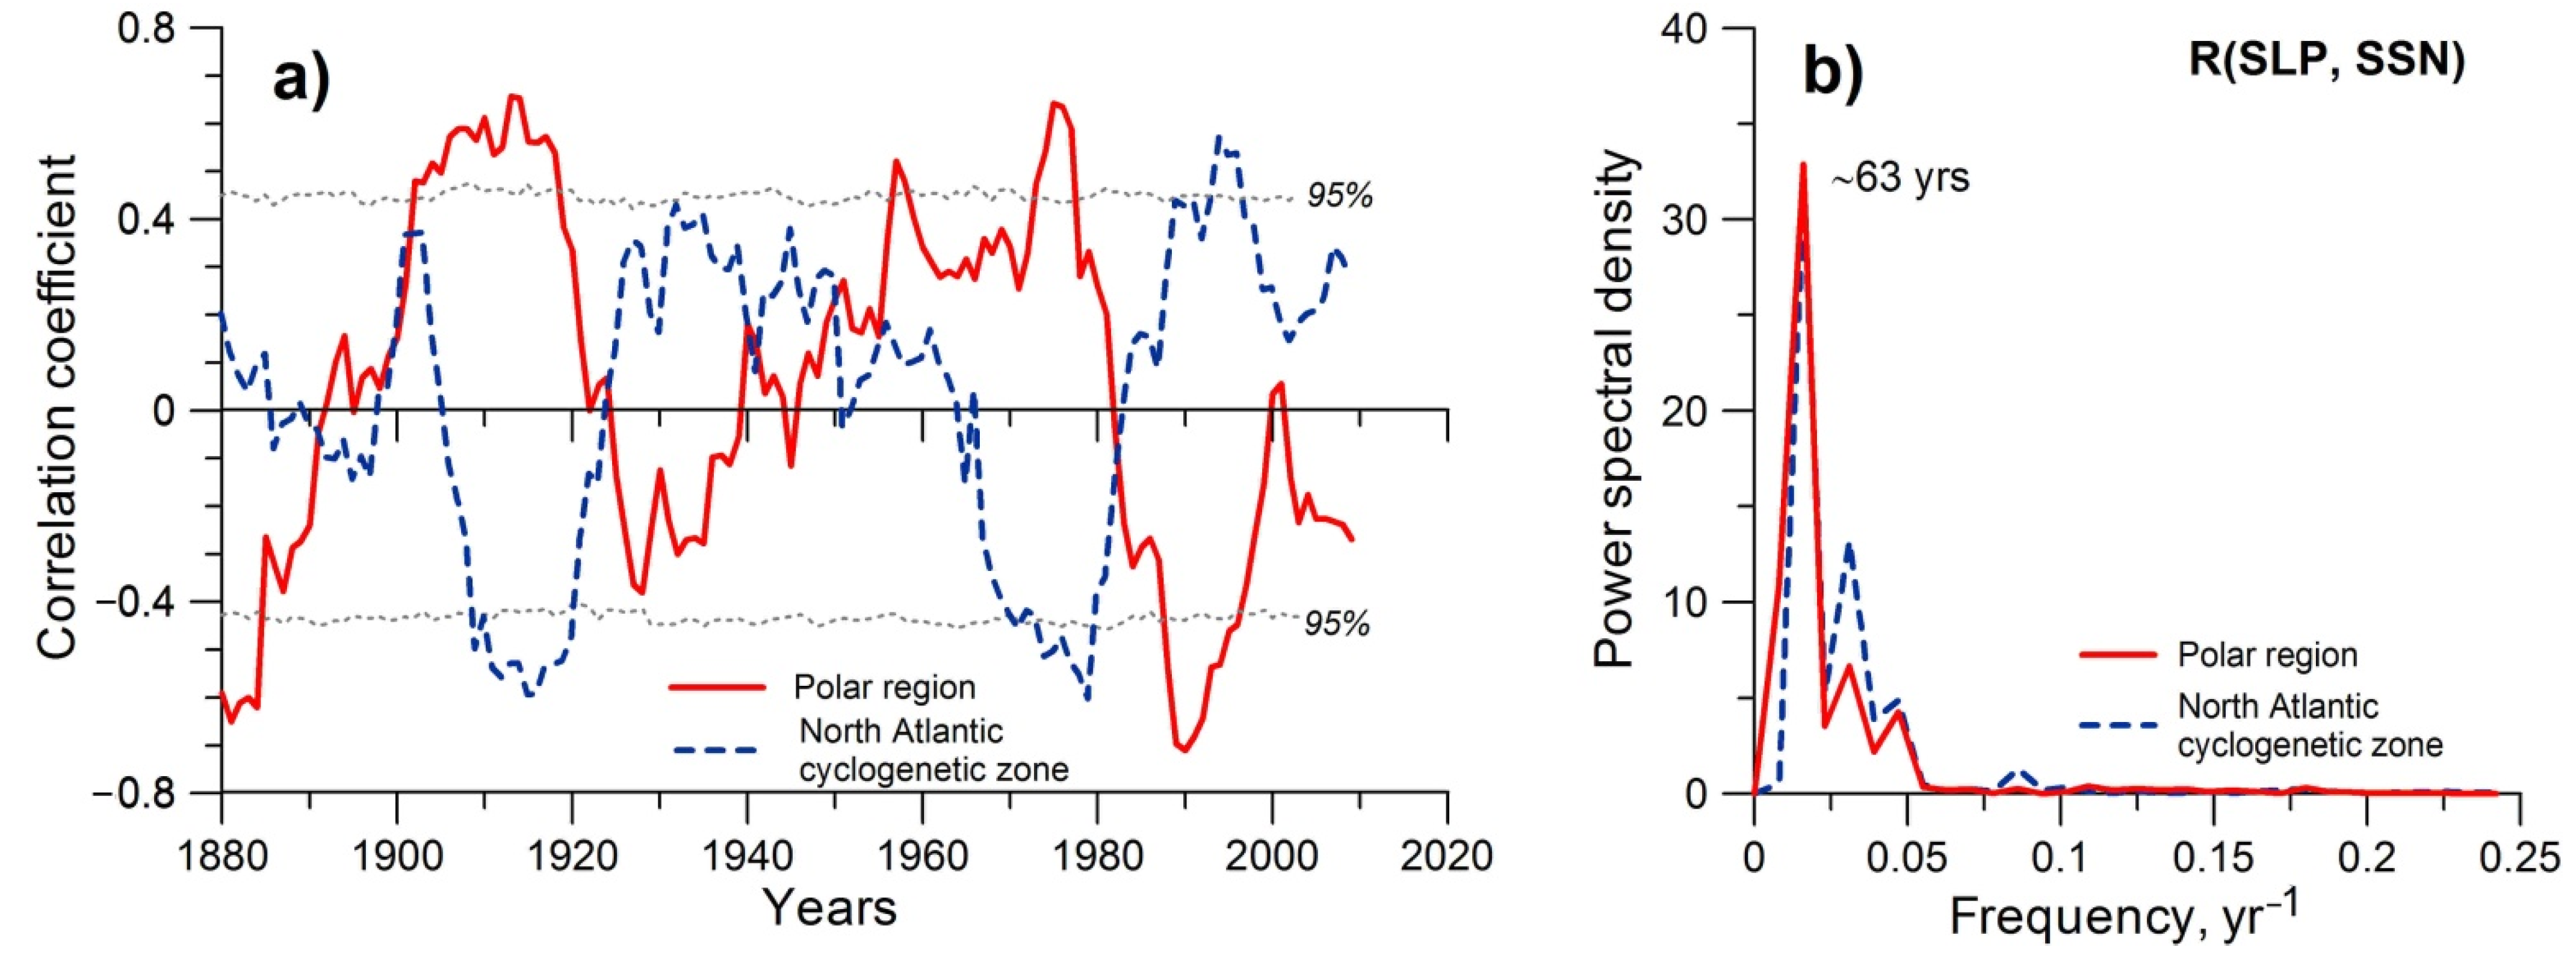
Figure 4a presents the correlation coefficients between the mean yearly values of SLP averaged with area-weighting over the indicated regions and sunspot numbers SSN for sliding 15-year intervals. The statistical significance of the coefficients was estimated using Monte Carlo simulations (N = 2000) of sliding correlation coefficients for surrogate time series obtained by randomization of the initial SLP and SSN time series. The dotted lines in
Figure 4a show the percentages of trials that obtained lower correlation coefficients (or higher in the case of negative correlations) than those for the initial time series, which allowed to estimate the probability of the detected correlations being non-random.
Figure 4. (a) Correlation coefficients between yearly values of sea level pressure and sunspot numbers R (SLP, SSN) for the Polar region (solid line) and the North Atlantic cyclogenetic zone (dashed line) for sliding 15-year intervals. Dotted lines show the 95% significance level. (b) Fourier spectra of sliding correlation coefficients R (SLP, SSN) for the Polar region (solid line) and the North Atlantic cyclogenetic zone (dashed line).
This classification was worked out by G.Ya. Vangengeim
[30] and was later supplemented by A.A. Girs
[31]. The Vangengeim–Girs classification includes three main forms of atmospheric circulation: W (zonal or westerly), C (meridional), and E (easterly) for the Atlantic–Eurasian sector of the Northern Hemisphere as well as three similar forms: Z, M1, and M2 for the Pacific–American sector. Under zonal forms W and Z, an intense westerly transport of air masses takes place at middle latitudes, with low-amplitude waves in the pressure field moving rapidly from west to east. The development of meridional processes, with slowly moving or stationary high-amplitude waves being observed in the pressure field, is characterized by meridional forms C and M1 and easterly forms E and M2. The forms C and E as well as the forms M1 and M2 differ by the opposite location of their troughs and crests in the pressure field.
Figure 5 (left panel) presents temporal variations in sliding correlation coefficients between pressure in the Polar region and sunspot numbers, which are compared to annual occurrences (a number of days during a year) of the main forms of large-scale circulation in the Atlantic–Eurasian and Pacific–American sectors of the Northern Hemisphere. The annual occurrences were calculated using the data in
[1][32] and those provided by the Arctic and Antarctic Research Institute (St. Petersburg). The data are shown after the linear trend removal and smoothing using 15-year running averages. In
Figure 5a, the correlation coefficients R (SLP, F
CR) between sea level pressure SLP in the Polar region and charged particle fluxes F
CR in the mid-latitudinal stratosphere
[33] are also presented.
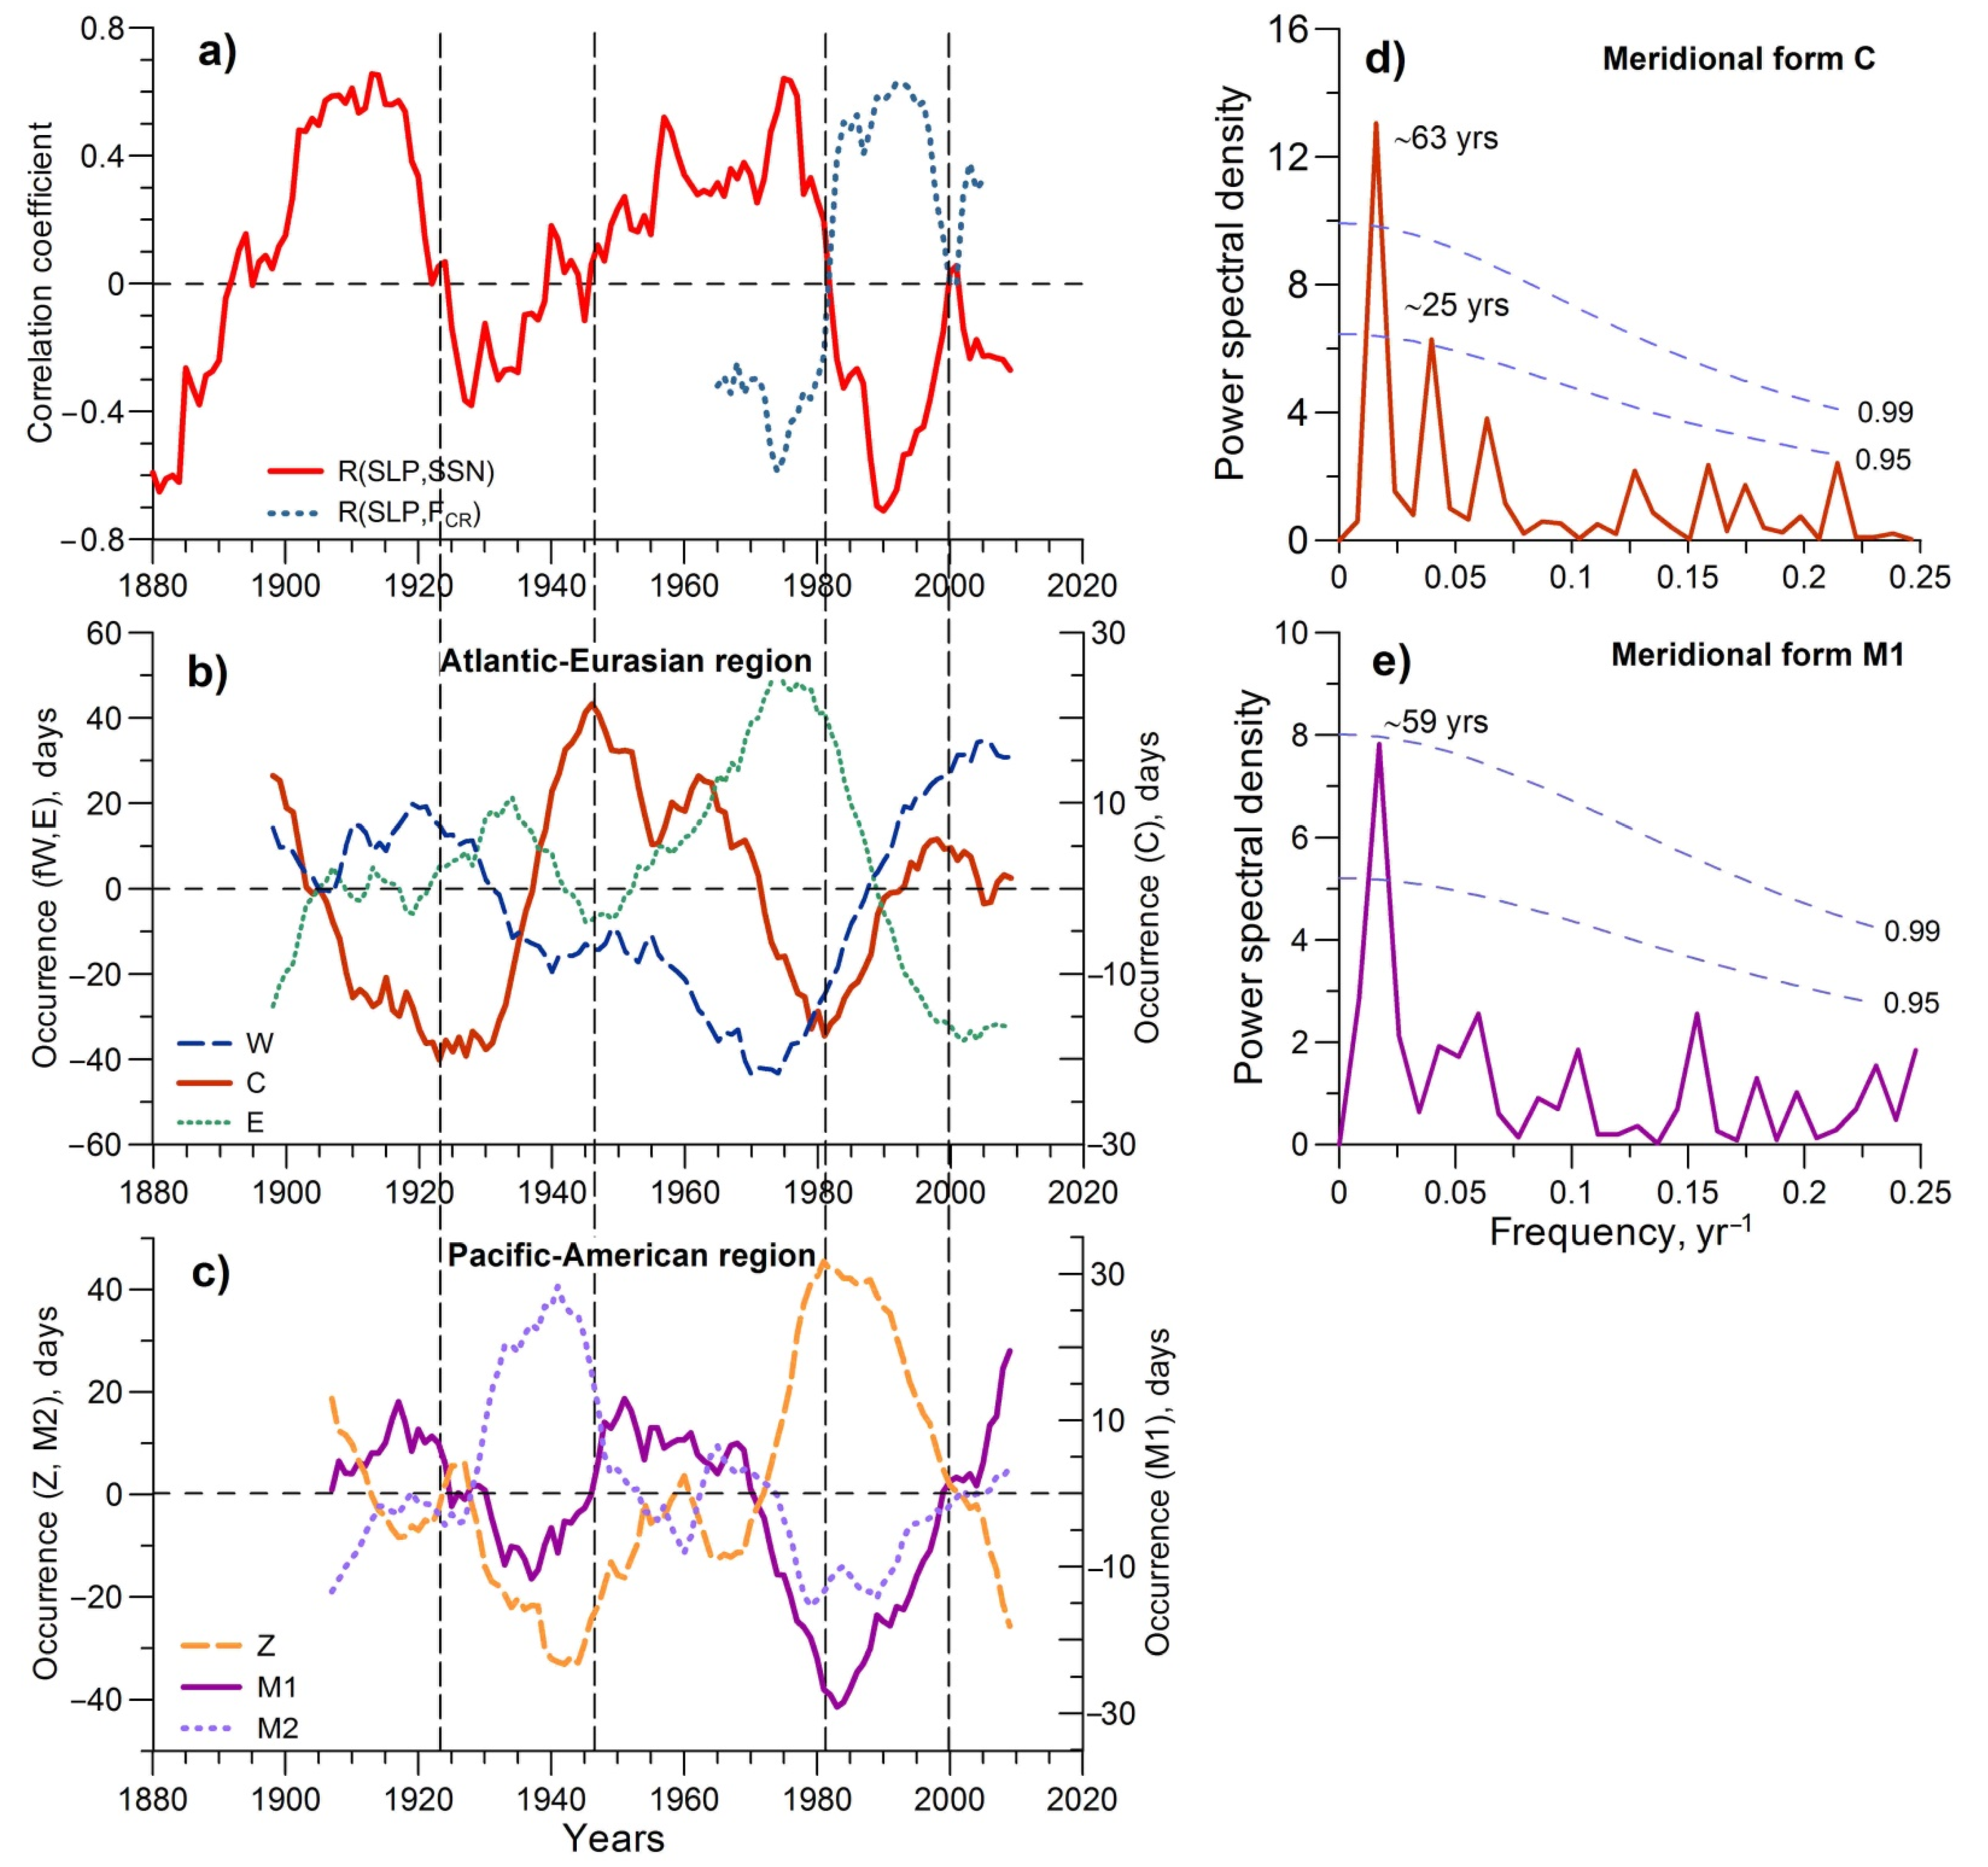
Figure 5. Left: Solar activity effects on troposphere pressure in the Polar region (60–85° N) and the evolution of large-scale atmospheric circulation: (a) correlation coefficients SSN R (SLP, SSN) between mean yearly values of SLP and sunspot numbers (solid line) and R (SLP, FCR) between SLP and GCR fluxes (dotted line) for 15-year sliding intervals; (b) annual occurrences (number of days during a year) of the main circulation forms according to the Vangengeim–Girs classification in the Atlantic–Eurasian region (15-year running averages); (c) the same in the Pacific–American region. Vertical dashed lines separate the periods of positive and negative correlations between SLP and SSN. Right: Fourier spectra of annual occurrences of the meridional circulation forms C in the Atlantic-Eurasian region (d) and M1 in the Pacific-American region (e). Dashed lines show the confidence levels calculated relative to the “red noise” with AR(1) coefficients α = 0.36 (d) and 0.27 (e).
Comparing the data presented in Fig.5 (left panel), the reversals of SLP-SSN correlation coefficients are closely related to the changes in the large-scale circulation epochs, with the signs of the correlations being determined by the evolution of the meridional circulation forms C and M1. Negative correlation coefficients of SLP-SSN in the Polar region were observed when these forms were intensifying, i.e. their annual occurrences were increasing (~1920-1950 and ~1980-2000). A negative SLP-SSN correlation implies a positive correlation between SLP and GCR intensity (Fig.5a). In these periods, at middle latitudes, and especially in the North Atlantic cyclogenetic region, the SLP-SSN correlation was positive (i.e., negative correlation with GCR intensity) (Fig.4a). Thus, under increasing occurrences of the meridional forms, GCR growth at the minima of the 11-year solar cycle contributed to more intensive formation and deepening of cyclones (pressure decrease) at the middle latitudes, and at the same time it was accompanied by the intensification of anticyclonic processes (pressure increase) at polar latitudes (see Fig.3a).
When occurrences of the meridional forms were decreasing (~1880–1920 and ~1950–1980), the sign of correlation links between troposphere pressure and sunspot numbers/GCR intensity was opposite to that detected in the periods of enhancing meridional forms. This means that GCR increases in the 11-year cycle were not accompanied by cyclone intensification at the middle latitudes and anticyclones in the Polar region. Thus, the character of solar activity and GCR effects on cyclonic processes (pressure variations) at extratropical latitudes seems to be closely related to large-scale circulation epochs and especially to the evolution of meridional circulation forms. Indeed, the results of the spectral analysis (
Figure 5, right panel) showed that annual occurrences of the meridional circulation forms C and M1 are characterized by dominant harmonics of ~60 years (the confidence level 0.99, estimated relative to the “red noise” spectrum using χ
2 statistics
[34]), which are close to those observed in the correlation coefficients R (SLP, SSN) (
Figure 4b). Thus, the obtained results allow us to suggest that the reversal of the correlation links between pressure variations (development of extratropical baric systems) and solar activity phenomena may be associated with changes in the large-scale circulation epochs.
5. Evolution of the Polar Vortex as a Possible Reason for Temporal Variability in Solar Activity Effects on the Lower Atmosphere Circulation
An important part in a large number of atmospheric processes is played by the stratospheric polar vortex, which affects the development of large-scale dynamic processes in the troposphere. A possible role of the polar vortex in the formation of the atmospheric response to solar activity phenomena was studied by Veretenenko and Ogurtsov
[25][29].
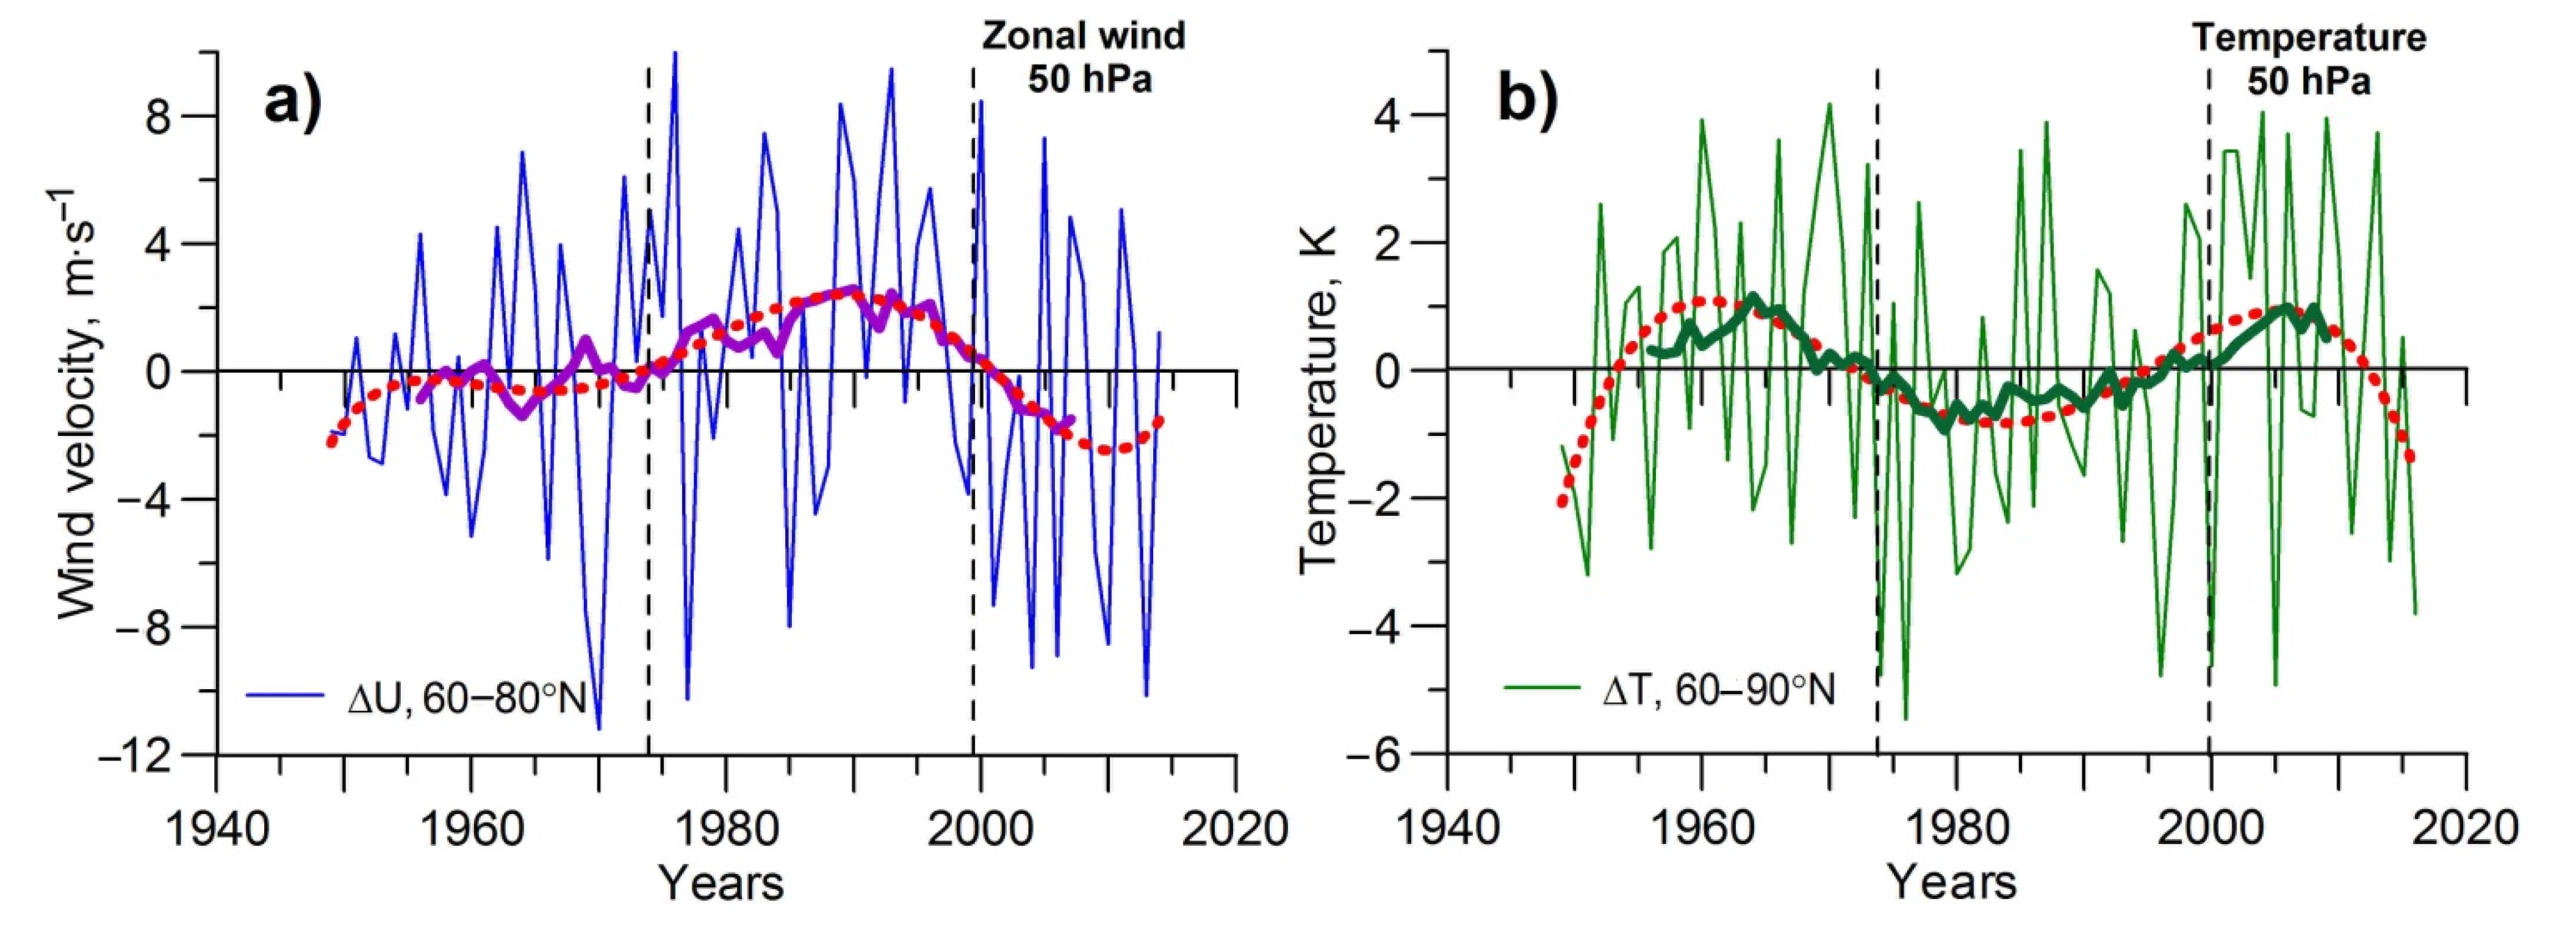
Figure 6 shows temporal variations in the vortex characteristics in the last several decades calculated on the basis of the NCEP/NCAR reanalysis data
[3], which have been available since 1948. To characterize the vortex strength, the mean values of zonal (western) wind velocity in the latitudinal belt of 60–80° N and stratospheric temperature in the area of 60–90° N at the 50 hPa level (~20 km) were used. The data were averaged over the winter months (December–February), which is when the vortex reaches its maximum development. One can see that in the period when GCRs produced the most significant effects on the evolution of mid-latitudinal cyclones (~1980–2000), the vortex was rather strong. In this period, zonal winds were noticeably enhanced, and the temperature in the vortex area was lowered due to a decrease in the heat exchange between high and middle latitudes, with the correlation coefficients between the variations in wind velocity and temperature amounting to –0.82. In the previous period from the 1950s to the end of the 1970s, the vortex was weak, with wind velocity decreasing and stratospheric temperatures increasing. Let us note the changes in the vortex strength near 1980 and near 2000.
Figure 6. Mean winter (December–February) values of zonal wind velocity in the latitudinal belt of 60–80° N (a) and stratospheric temperature in the region of 60–90° N (b) at the 50 hPa level (after the linear trend removal). Thick solid and dotted lines show 15-year running averages and polynomial fits, respectively. Vertical dashed lines separate the periods with a strong and weak polar vortex.
To estimate vortex evolution in earlier periods when no stratospheric data were available, sea level pressure and temperature oscillations in the Polar region were used. According to Baldwin and Dunkerton
[5], a strong vortex regime is characterized by a positive phase of the Arctic Oscillation, i.e., negative SLP anomalies are observed at polar latitudes and positive ones are observed at middle latitudes. Cyclone tracks are shifted to the north, so more cyclones arrive in the Polar region, which results in a warm epoch in the Arctic
[6]. Under a weak vortex regime, a negative phase of the Arctic Oscillation is observed, i.e., SLP anomalies are positive at high latitudes and negative at middle ones. Cyclone tracks are displaced farther south, and fewer cyclones arrive in the Arctic, contributing to a cold epoch in this region.
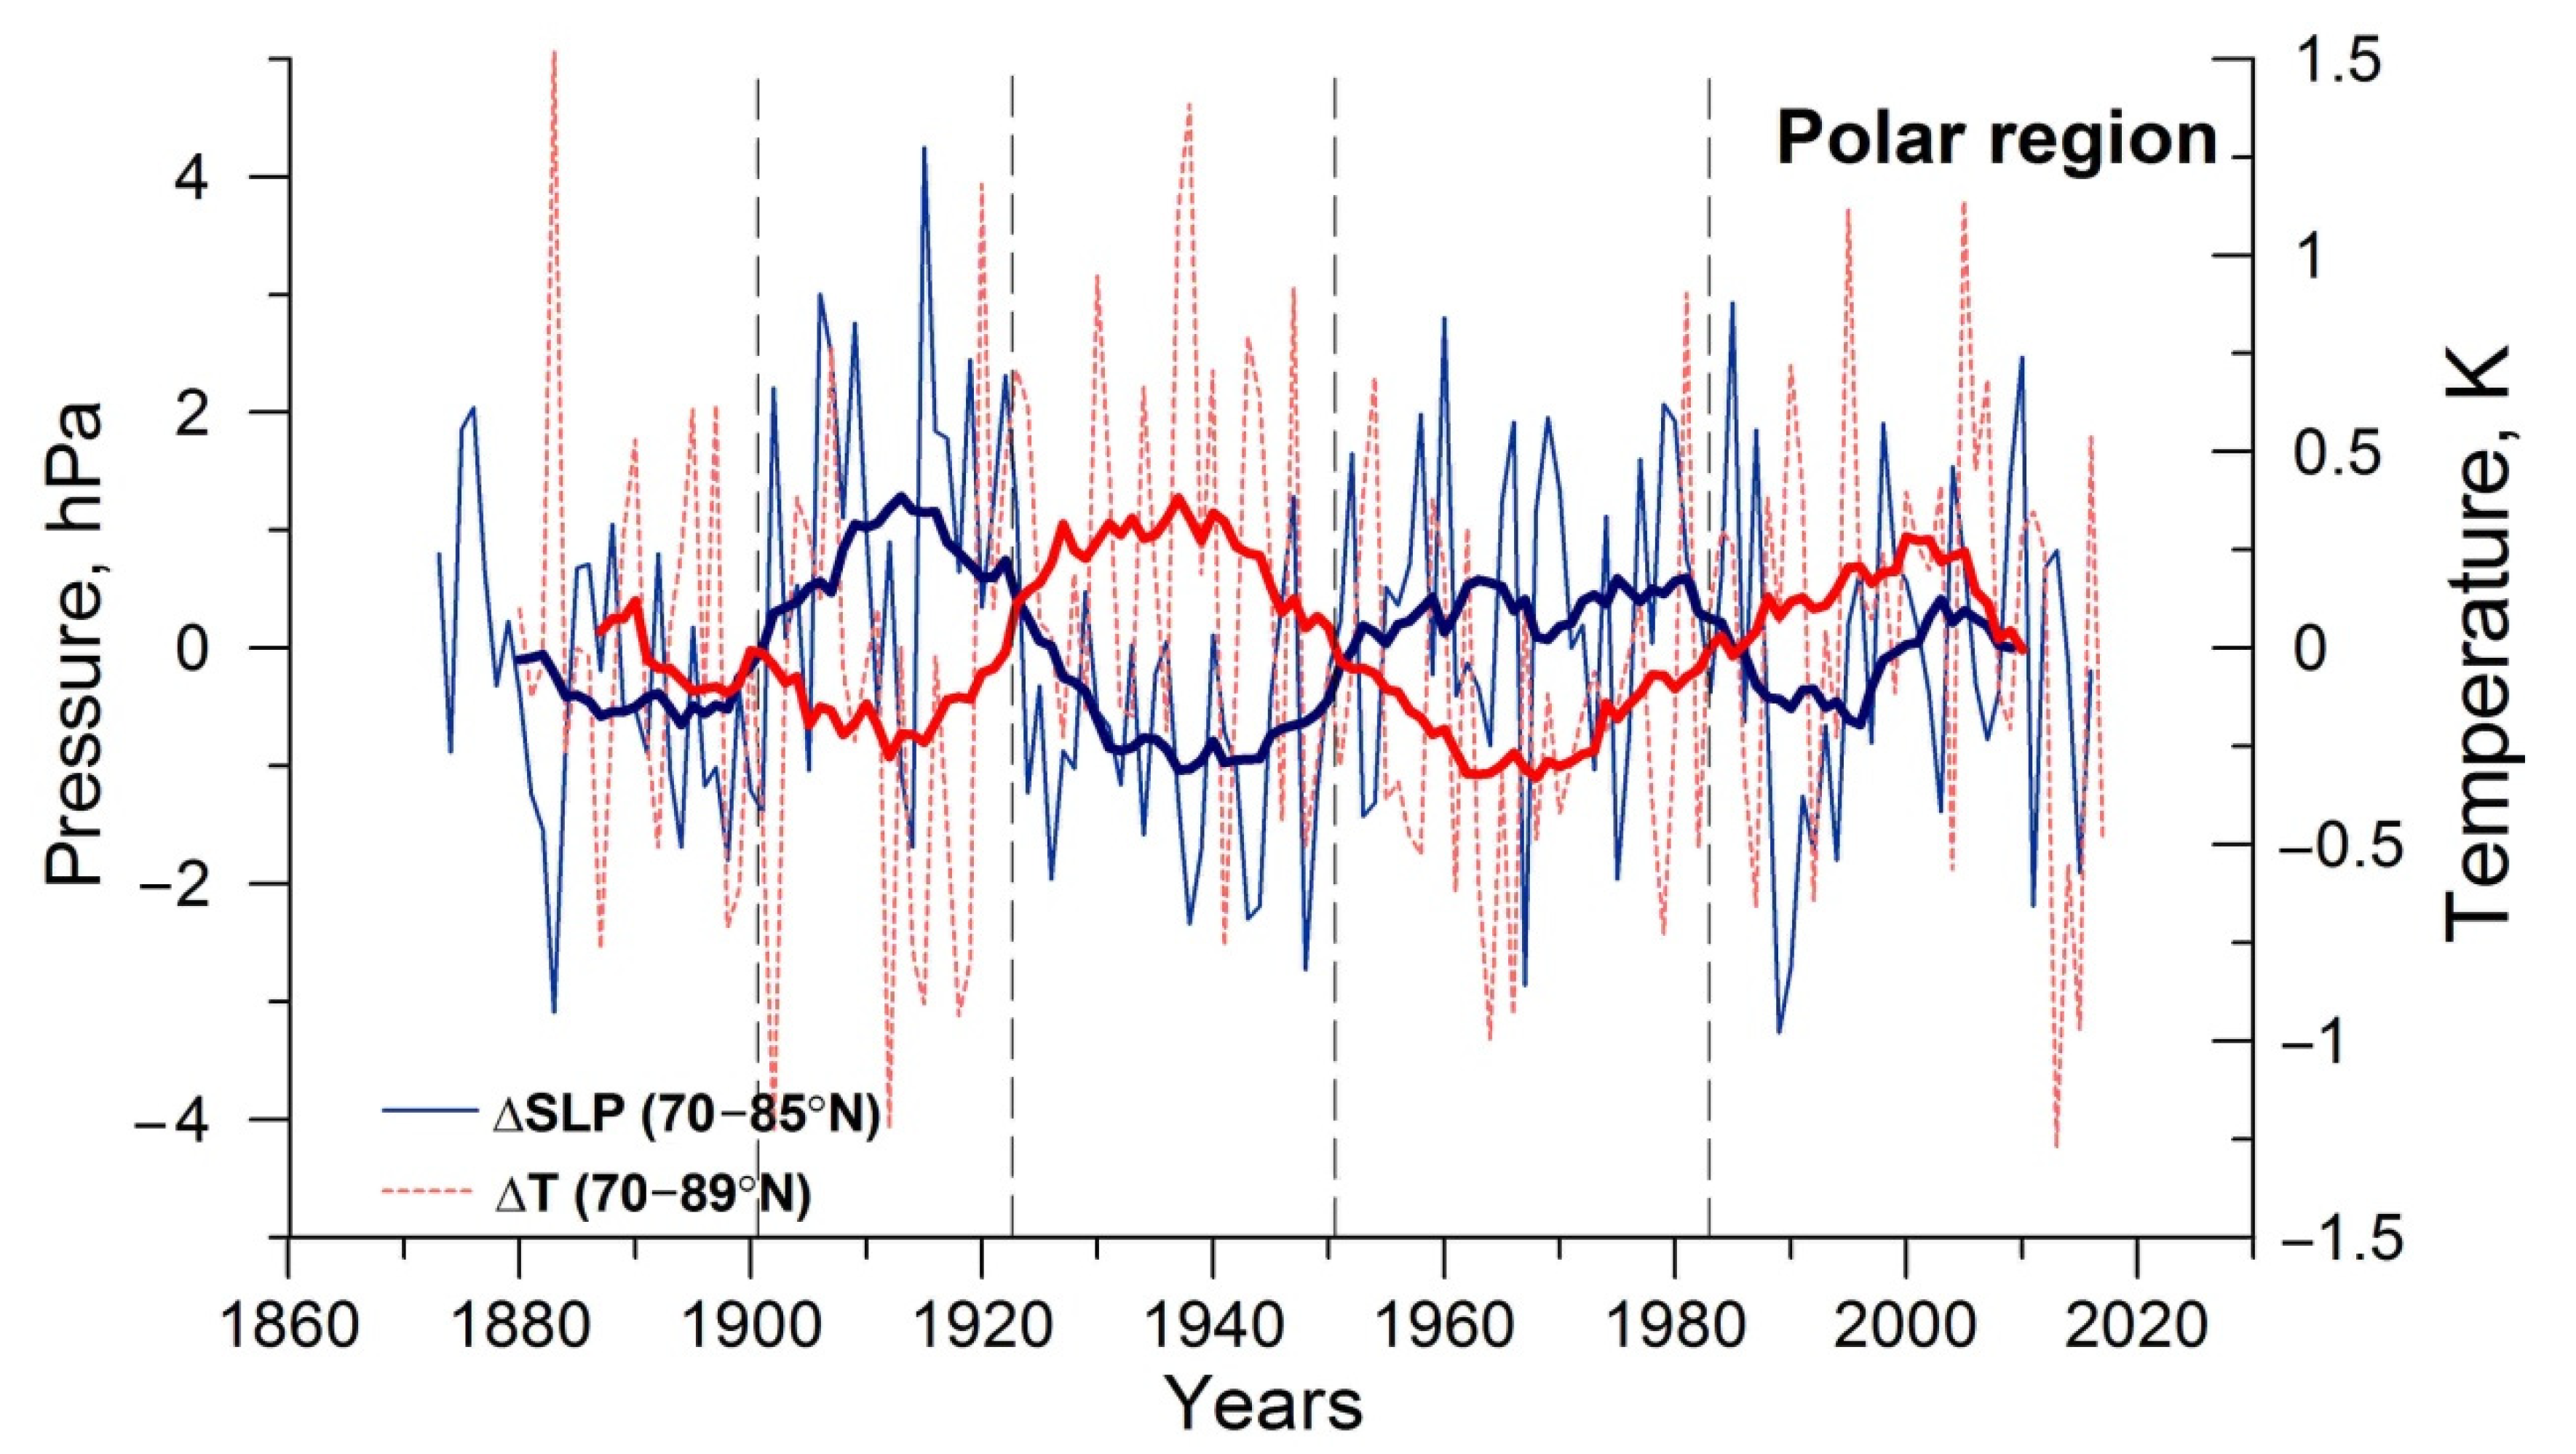
Figure 7 presents temporal variations in the mean yearly values of sea level pressure and temperature anomalies in the Arctic region (≥70° N), with the polynomial trends being removed. The data were taken from the MSLP archives described above and GISS Surface Temperature Analysis (
http://data.giss.nasa.gov/gistemp/source, accessed on 13 April 2018). One can see that the period with a strong vortex (~1980–2000), when stratospheric winds were enhanced (
Figure 7), was really accompanied by a decrease in pressure and warming in the Arctic. The previous period with a weak vortex (~1950–1980), on the contrary, was accompanied by an increase in pressure and a cold epoch in the studied region. Thus, the data in
Figure 7 suggest that the period ~1920–1950, which was characterized by an SLP decrease and temperature increase, was a period with a strong vortex similar to ~1980–2000, whereas the period ~1900–1920, when an SLP increase and temperature decrease were observed, was a period with a weak vortex. The presented data show a roughly 60-year periodicity in the pressure and temperature variations in the Arctic, which suggests a similar periodicity in the polar vortex strength. The transitions between the different states of the polar vortex seem to take place at the end of the 19th century, in the early 1920s, and near 1950 and 1980, which is in good agreement with the changes in large-scale circulation epochs (
Figure 5).
Figure 7. Temporal variations in mean yearly values of sea level pressure and temperature in the Polar region (after the polynomial trend removal). Thick lines show 15-year running averages. Vertical dashed lines separate the periods with a strong and weak polar vortex.
The obtained results allow the assumption that the oscillations of the polar vortex intensity may be a possible reason for the temporal variability in the effects of solar activity on the atmosphere state. Correlation reversals between atmospheric characteristics and solar activity-related phenomena were noted in the 1920s
[10][11][35], near 1950
[12][13], and near 1980
[11]. The data presented (
Figure 4 and
Figure 5) revealed that the correlation reversals of troposphere pressure in different regions and sunspot numbers took place near 1890, the 1920s, the 1950s, and in the early 1980s, which is consistent with the transitions between the different states of the vortex (
Figure 6 and
Figure 7). Under a strong vortex regime, growth of GCR intensity in the 11-year cycles contributes to the intensification of cyclonic processes at mid-latitudinal Polar fronts (
Figure 3a), whereas under a weak vortex, no such effects are observed (
Figure 3b). As the polar vortex state affects the dynamic interaction between the troposphere and stratosphere via planetary waves (e.g.,
[36][37]), one can suggest that changes in this interaction may influence the formation of solar activity effects on lower atmosphere circulation. Under strong vortex conditions, when the zonal wind velocity in the stratosphere exceeds a critical value, planetary waves propagating upward are reflected back to the troposphere, so the stratosphere can influence the troposphere. Under a weak vortex, planetary waves propagate to the upper levels of the atmosphere, and only the troposphere can influence the stratosphere. Hence, when the vortex is strong, the conditions for the transfer of solar signals from the stratosphere into the troposphere seem to be more favorable. A small increase in wind velocity may intensify the reflection of planetary waves back to the troposphere, resulting in pressure and temperature changes
[37]. Thus, under strong vortex conditions, the stratospheric processes caused by GCR variations and/or other solar activity agents can influence tropospheric processes to a greater extent compared to weak vortex conditions.
6. Destruction of Cloud-GCR Correlation: Possible Role of the Vortex Weakening
The correlation between cloud cover and galactic cosmic ray intensity was revealed on a daily time scale by Pudovkin and Veretenenko
[38] and on a decadal time scale by Svensmark and Friis-Christensen
[39]. Later Marsh and Svensmark
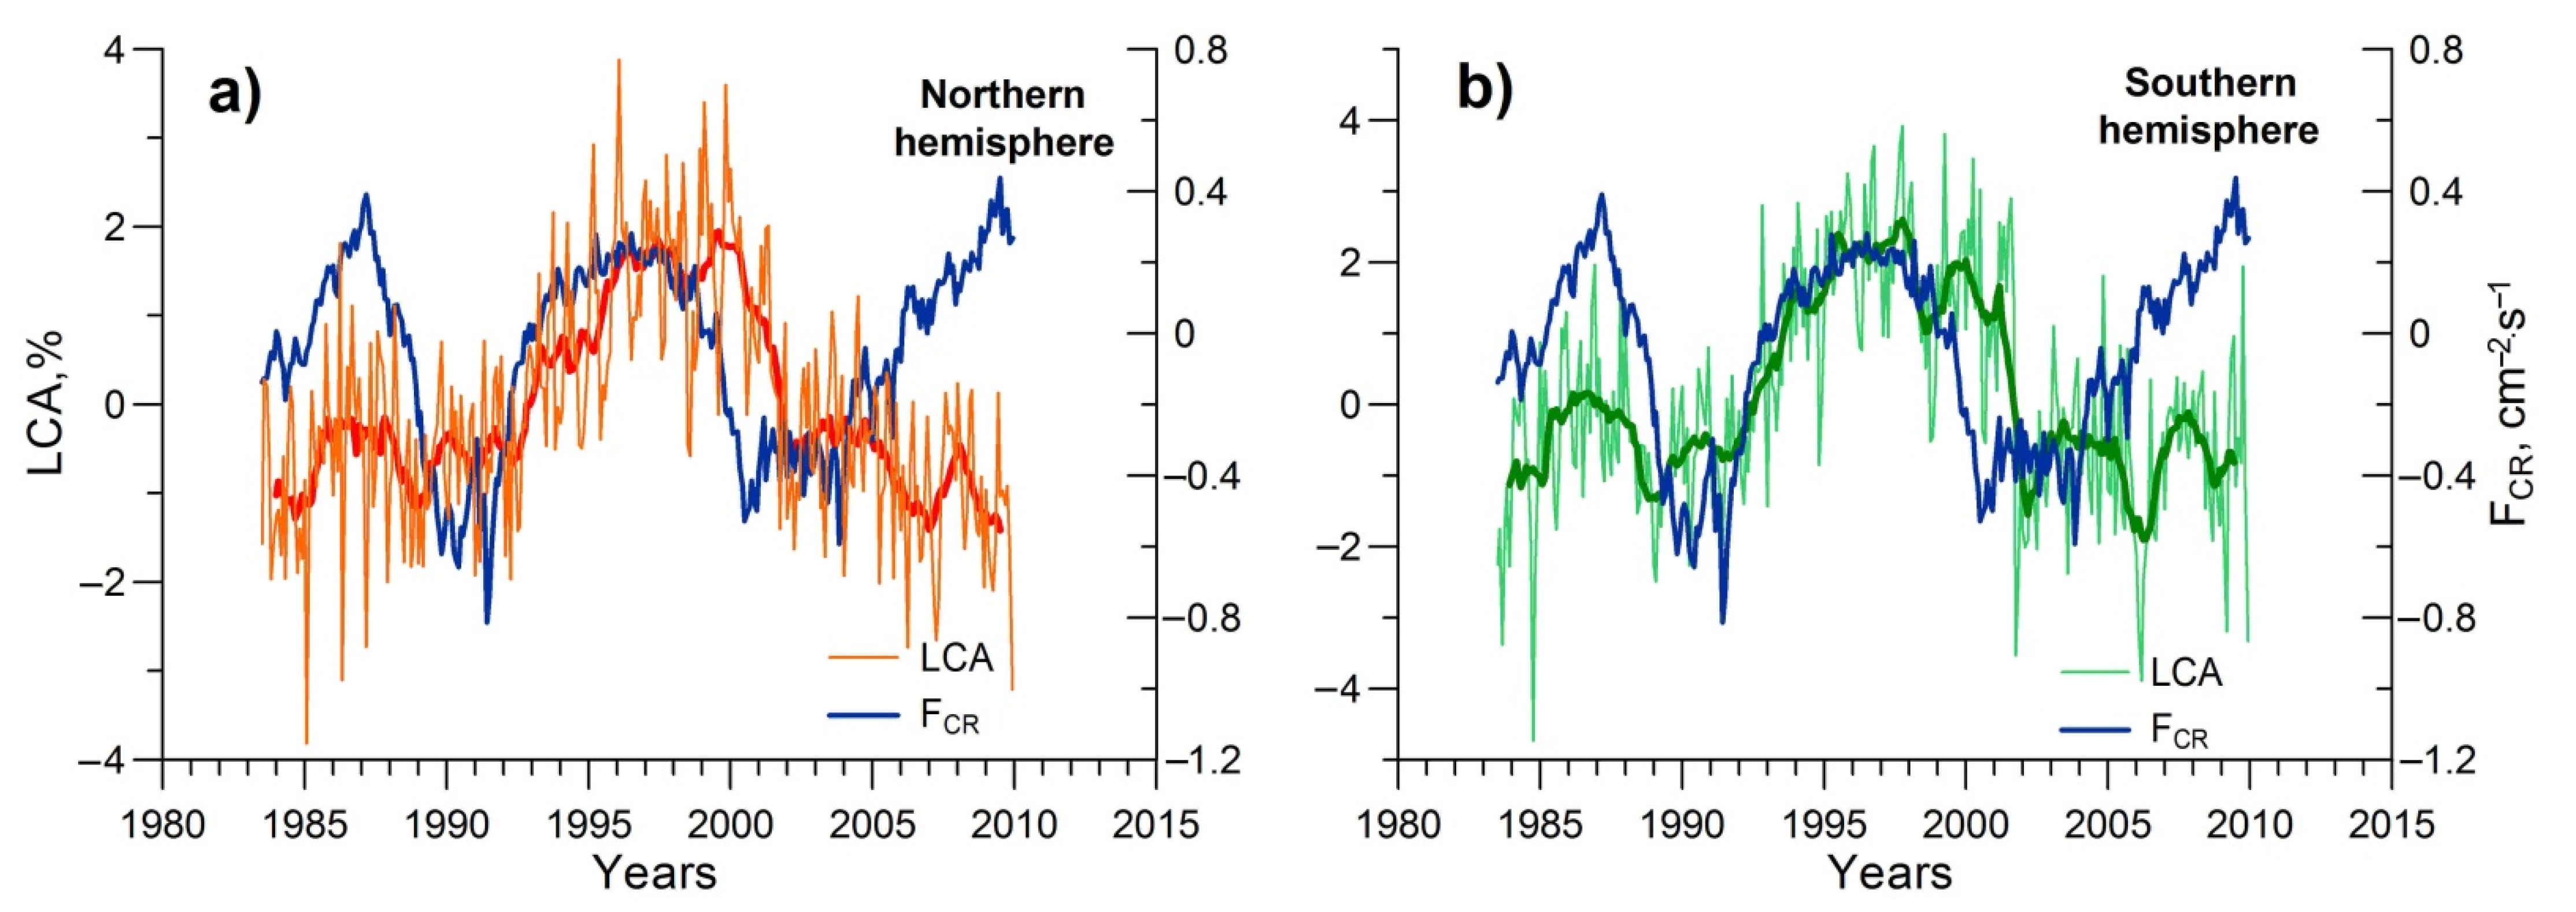
[15] showed that the cloud–GCR link is only observed for low-level clouds. The correlation coefficients between the globally averaged values of low-cloud anomalies (LCA) according to the satellite data ISCCP-D2 and GCR intensity were found to reach 0.63 (0.92 for 12-month running averages) in the period of 1983–1994. However, in the late 1990s, the LCA-GCR correlation started decreasing, and in the early 2000s, it was finally destroyed. The correlation destruction can be seen in
Figure 8, where the low-cloud anomalies (LCA) taken from (
http://isccp.giss.nasa.gov/pub/data/D2CLOUDTYPES, accessed on 4 August 2015) and GCR fluxes F
CR in the stratosphere at the mid-latitudinal station Dolgoprudny (geomagnetic cutoff rigidity 2.4 GV) according to balloon measurements
[33] are presented. The destruction of the cloud–GCR link near 2000 provided a reason to doubt a possible influence of galactic cosmic rays on cloud formation as well as their important role in the mechanism of solar-atmospheric links (e.g.,
[40]).
Figure 8. Monthly values of LCA at middle latitudes 30–60° N in the Northern (a) and Southern (b) hemispheres compared to GCR fluxes FCR at the mid-latitudinal station Dolgoprudny (after the linear trend removal). Thick lines show 12-month running averages of LCA.
As shown in the studies by Veretenenko and colleagues
[41][42], a possible reason for the indicated violation of a positive cloud–GCR link may be temporal variability in GCR effects on the extratropical cyclogenesis, the temporal variability being caused by the evolution of the stratospheric polar vortex. Indeed, the data presented in
Figure 6 provide evidence for an enhanced polar vortex in the Northern Hemisphere from the early 1980s to the late 1990s, when a high positive correlation between low-cloud amount and GCRs was observed. A similar enhancement of the stratospheric polar vortex also seems to take place in the Southern Hemisphere in the indicated period
[41]. According to the above data (
Figure 3a), under strong vortex conditions, an increase in GCR fluxes in the 11-year solar cycle contributes to the intensification of cyclonic processes at mid-latitudinal Polar fronts. In
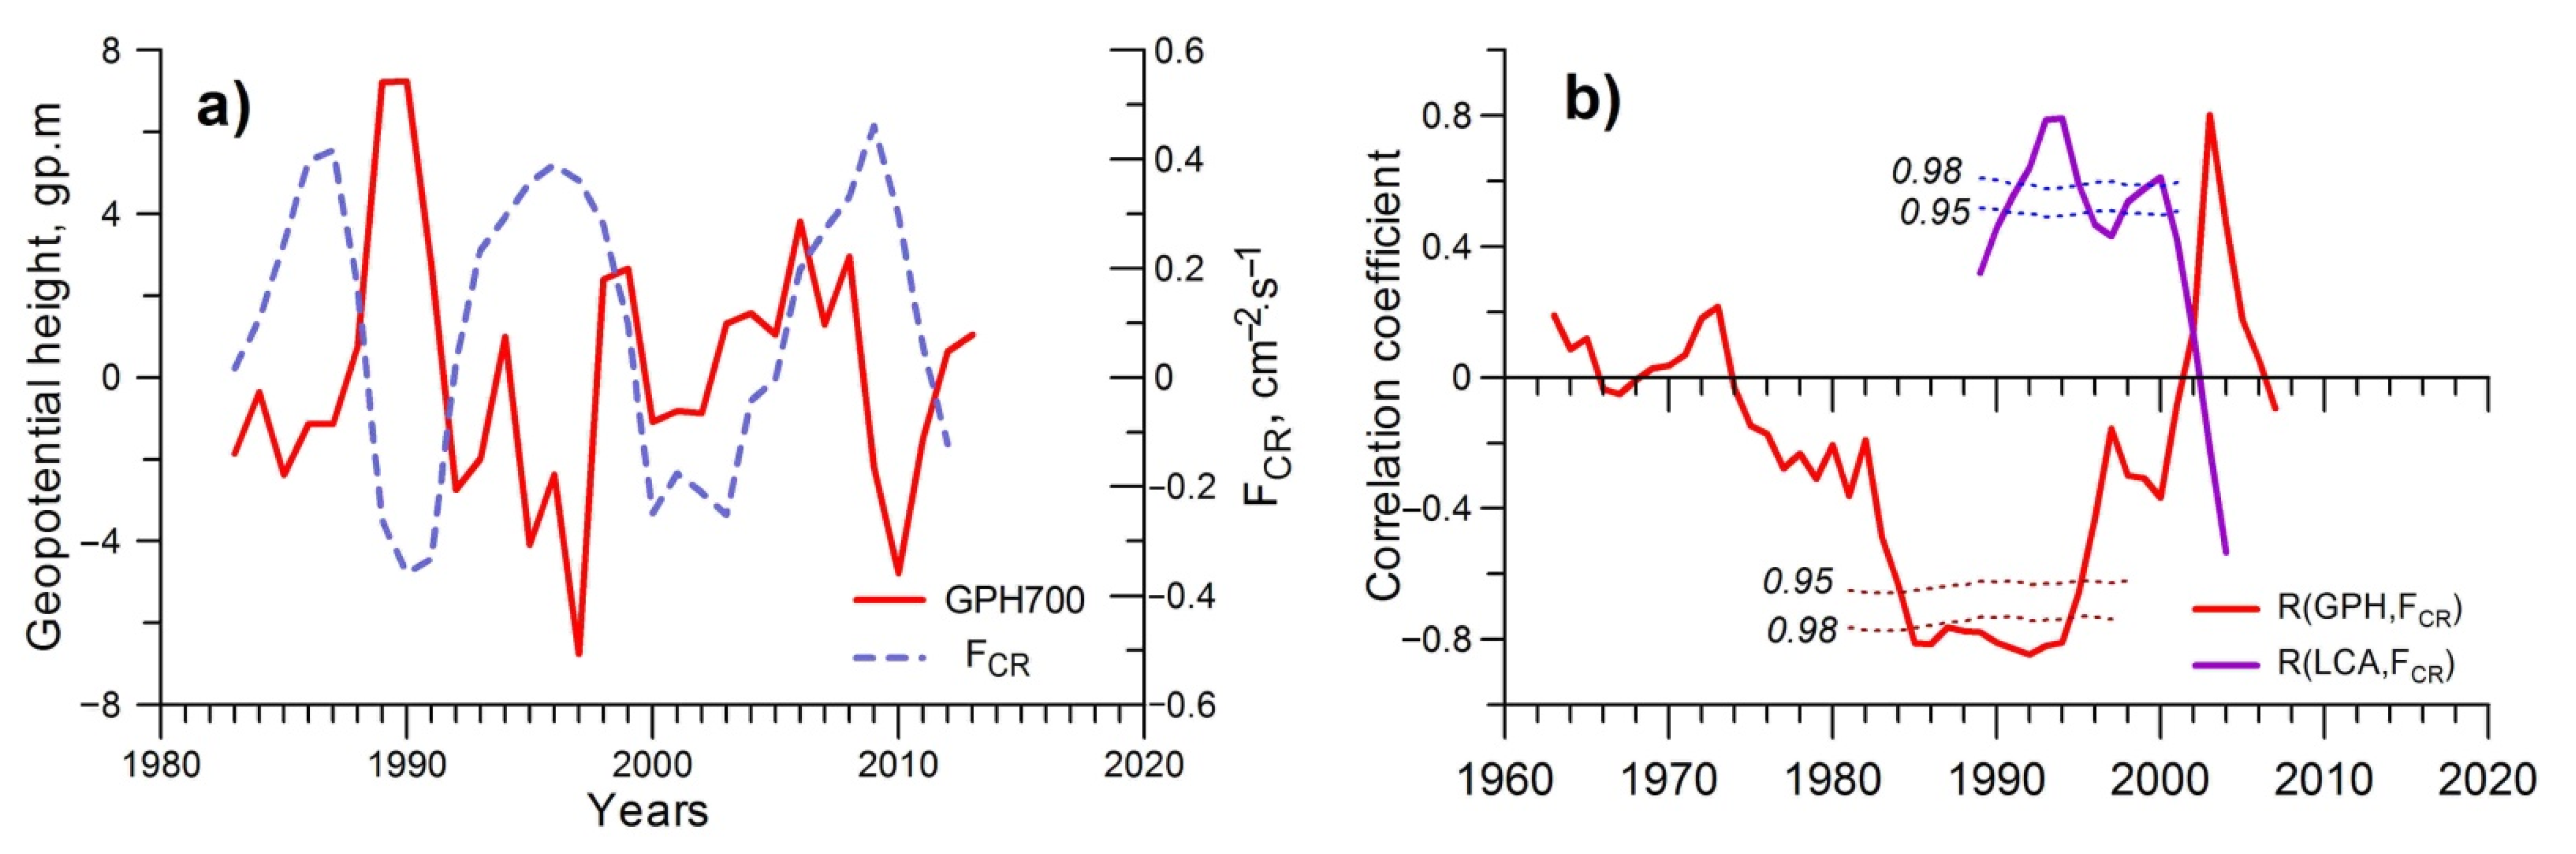
Figure 9a, the mean yearly values of troposphere pressure (geopotential heights of the 700 hPa level) at the middle latitudes (30–60° N) are compared to GCR fluxes in the mid-latitudinal stratosphere at altitudes of ~15–20 km
[33]. One can see a rather strong negative correlation between these values, which confirms an intensification of cyclogenesis with a GCR increase under a strong vortex conditions in the ~1980–1990s. However, after ~2000 the negative correlation was violated.
Figure 9. (a) Mean yearly values of GPH700 anomalies at the latitudes of 30–60° N (solid line) and GCR fluxes FCR at the mid-latitudinal station Dolgoprudny (dashed line) after the linear trend removal; (b) correlation coefficients for sliding 11-year intervals between mean yearly values of GPH700 anomalies and FCR (red line) and between LCA and FCR (purple line). Dotted lines show the confidence levels of the correlation coefficients.
Cyclonic activity, in turn, significantly influences cloud fields in the troposphere. The main cause of cloud formation is the vertical transport of water vapor that results in its cooling and condensation. The most large-scale upward air movements at extratropical latitudes are associated with low-pressure systems, i.e., cyclones and troughs. These movements arise due to a convergence of air flows near the Earth’s surface to the cyclone center or the trough axis (e.g.,
[43]). Upward air movements are also associated with atmospheric fronts (narrow transition zones separating cold and warm air masses). They contribute to the formation of strong extended systems of frontal stratiform clouds such as Ns-As-Cs (nimbostratus Ns, altostratus As, and cirrostratus Cs) at warm and slowly moving cold fronts as well as to the development of convective clouds (cumulonimbus Cb) at fast-moving cold fronts (e.g.,
[44]). As extratropical cyclones are usually frontal ones, i.e., their formation and evolution occur at atmospheric fronts, frontal cloudiness exists at all stages of cyclone evolution. This results in a rather strong connection between cloud fields and dynamic processes in the troposphere. A well-developed cyclone represents a powerful cloud vortex with a spiral structure, which can be seen from a satellite (see
Figure 1 in
[42]).
In
Figure 9b, temporal variations in the correlation coefficients between the mean yearly values of troposphere pressure (GPH700) anomalies in the latitudinal belt of 30–60° N and GCR fluxes
[33] for sliding 11-year intervals are presented. The sliding correlation coefficients are compared to similar correlation coefficients between LCA in the same latitudinal belt and GCR fluxes. The data in
Figure 9b show that a strong negative correlation, with R (GPH, F
CR) amounting ~−0.8 (the confidence level
p = 0.98 according to Monte Carlo simulations of sliding correlation coefficients for surrogate time series obtained by randomization of the initial ones), really did take place from the middle of the 1980s to the middle of the 1990s, which indicates strong GCR effects on cyclone intensification. Then, this correlation started weakening and changed the sign in the early 2000s. One can see that the correlation coefficients for pressure–GCRs and cloud–GCRs vary in opposite phases. The highest positive correlation R (LCA, F
CR) took place in the period, when the effects of GCRs on cyclone development were the most pronounced. In the late 1990s, this correlation started decreasing and changed the sign simultaneously with the reversal of the pressure–GCR correlation. Thus, the presented data provide evidence that a high positive correlation between cloud amount and galactic cosmic rays revealed on the decadal time scale was due mostly to GCR effects on the development of dynamical processes in the atmosphere under a strong polar vortex. The transition of the polar vortex from a strong state to a weaker one near 2000 (Fig.6) probably resulted in the reversal of pressure-GCR correlation which, in turn, resulted in the reversal of cloud-GCR correlation.
6. Conclusions
- Temporal variability of solar activity effects on circulation of the lower atmosphere reveals a roughly 60-year periodicity which may be associated with changes of the epochs of large-scale circulation.
- In turn, changes of the circulation epochs seem to be related to the transitions between the different states of the stratospheric polar vortex, the vortex intensity undergoing oscillations with the period close to 60 years. Under a strong vortex, increases in GCR fluxes contribute to the intensification of extratropical cyclones, which resulted in a high positive correlation between cloudiness at mid-latitudes and GCR intensity in ~1980-2000. A sharp weakening of the vortex near 2000 may be a possible reason for the destruction of this correlation.
- The obtained results show that the stratospheric polar vortex plays an important part in the mechanism of solar-atmospheric links, which seems to be due to its capability to affect the troposphere-stratosphere interaction via planetary waves.
 +1 credit