Your browser does not fully support modern features. Please upgrade for a smoother experience.
Submitted Successfully!
 +1 credit
Thank you for your contribution! You can also upload a video entry or images related to this topic.
For video creation, please contact our Academic Video Service.
Video Upload Options
We provide professional Academic Video Service to translate complex research into visually appealing presentations. Would you like to try it?
Cite
If you have any further questions, please contact Encyclopedia Editorial Office.
Kabir, M.H.; Guindo, M.L.; Chen, R.; Sanaeifar, A.; Liu, F. Laser-Induced Breakdown Spectroscopy for Food Quality Evaluation. Encyclopedia. Available online: https://encyclopedia.pub/entry/25576 (accessed on 24 June 2026).
Kabir MH, Guindo ML, Chen R, Sanaeifar A, Liu F. Laser-Induced Breakdown Spectroscopy for Food Quality Evaluation. Encyclopedia. Available at: https://encyclopedia.pub/entry/25576. Accessed June 24, 2026.
Kabir, Muhammad Hilal, Mahamed Lamine Guindo, Rongqin Chen, Alireza Sanaeifar, Fei Liu. "Laser-Induced Breakdown Spectroscopy for Food Quality Evaluation" Encyclopedia, https://encyclopedia.pub/entry/25576 (accessed June 24, 2026).
Kabir, M.H., Guindo, M.L., Chen, R., Sanaeifar, A., & Liu, F. (2022, July 27). Laser-Induced Breakdown Spectroscopy for Food Quality Evaluation. In Encyclopedia. https://encyclopedia.pub/entry/25576
Kabir, Muhammad Hilal, et al. "Laser-Induced Breakdown Spectroscopy for Food Quality Evaluation." Encyclopedia. Web. 27 July, 2022.
Copy Citation
Laser-induced Breakdown Spectroscopy (LIBS) is becoming an increasingly popular analytical technique for characterizing and identifying various products; its multi-element analysis, fast response, remote sensing, and sample preparation is minimal or nonexistent, and low running costs can significantly accelerate the analysis of foods with medicinal properties (FMPs).
laser-induced breakdown spectroscopy
plasma
spectroscopy
medicinal properties
chemometrics
quality
1. Introduction
Laser-induced Breakdown Spectroscopy (LIBS) has become increasingly popular in recent years due to its distinctive features, including its broad application, minimal or no sample preparation procedures, speed, affordability, and the ability to sense remotely in a variety of scientific fields and applications [1]. LIBS analyzes the presence of spectral emissions from laser-induced plasmas using optical emission techniques. This technology was developed in the 1960s. LIBS applications have become popular due to their advantages over conventional methods. The development of Q-switched pulse lasers in 1963 is considered the precursor to LIBS. Nd: YAG lasers are the most commonly used for LIBS applications since they produce highly focused pulses of high energy. Over the years, LIBS has gained attention for its potential in many fields.
A multi-element analytical technique is successfully employed in various disciplines, including space exploration, metallurgy, forensics, and pharmaceuticals [2]. Since then, researchers have become increasingly intrigued by LIBS technology for having great potential in many fields. It allows for both qualitative and quantitative analysis of trace elements using LIBS. Several trace elements from medicinal plants with hypoglycemic effects were studied using this technique in 2008 [3]. It consists of measuring the intensity of spectral emissions from laser-induced plasmas. Specifically, the intensity of plasma emission is directly proportional to the abundance of an element. It is an excellent method for analyzing various materials and compounds due to its relative simplicity and ability to analyze solids, liquids, or gases at the same time. However, quantitative evaluation of the elemental compositions determined using LIBS measurements is more difficult than purely numerical analysis. In recent years, this technology has been utilized in analyzing environmental and biological samples, advanced materials, such as semiconductors, analyses of online samples, remote analyses of nuclear power plants, and depth profiling [3]. Researchers are currently studying a LIBS-based methods for the non-invasive and rapid examination of foods with medicinal properties (FMPs). The system is fundamentally optical. Chemical compositions can be analyzed qualitatively and quantitatively using this technique. It provides process analytical technology (PAT) and handheld functionality [4][5][6][7][8][9][10][11]. There is, however, an increasing interest in developing new analytical instruments and approaches to increase the sensitivity of LIBS, reduce the effect of sample matrix on LIBS, and test both well-established and novel chemometric approaches [12].
2. Principles Related to LIBS
Typically, LIBS systems consist of a few components that can be configured to meet specific requirements for scientific research, or they can be compact and rugged for field measurements in the field. Generally, these can be divided into (i) short solid-state pulses, (ii) Q-switched lasers, (iii) optics, (iv) detectors and spectrometers, and (v) computer systems. This system can provide a close-up analysis and a standalone configuration (Figure 1). In LIBS, a pulsed laser is used at high power on a sample surface (1), which causes the molecules of the sample to separate into their constituent atoms. A small amount of the sample is converted into vapor as a result of rapid energy discharge (2), resulting in the formation of high-temperature micro plasma accompanied by the characteristic sound of an ultrasonic shockwave (3) [13]. The plasma loses its energy as soon as it expands into space and begins to atomize. A spectrometer can detect the light emitted by ions and atoms during the relaxing stage. The sample is subjected to a laser pulse with a high peak power to cause a spark breakdown in the test sample medium. When a laser pulse is applied, the plasma reaches temperatures of up to 4000–15,000 K [13]. Molecules and particles within the sample are dissociated due to the energetic spark. Electrons and ions thereby excite the atoms. Cooling the plasma allows the excited ions and electrons to return to their ground states. Each emits wavelengths specific to its element and its fingerprint (signature). The composition can be determined by measuring the wavelengths and intensities of specific atomic emission lines (Figure 2).
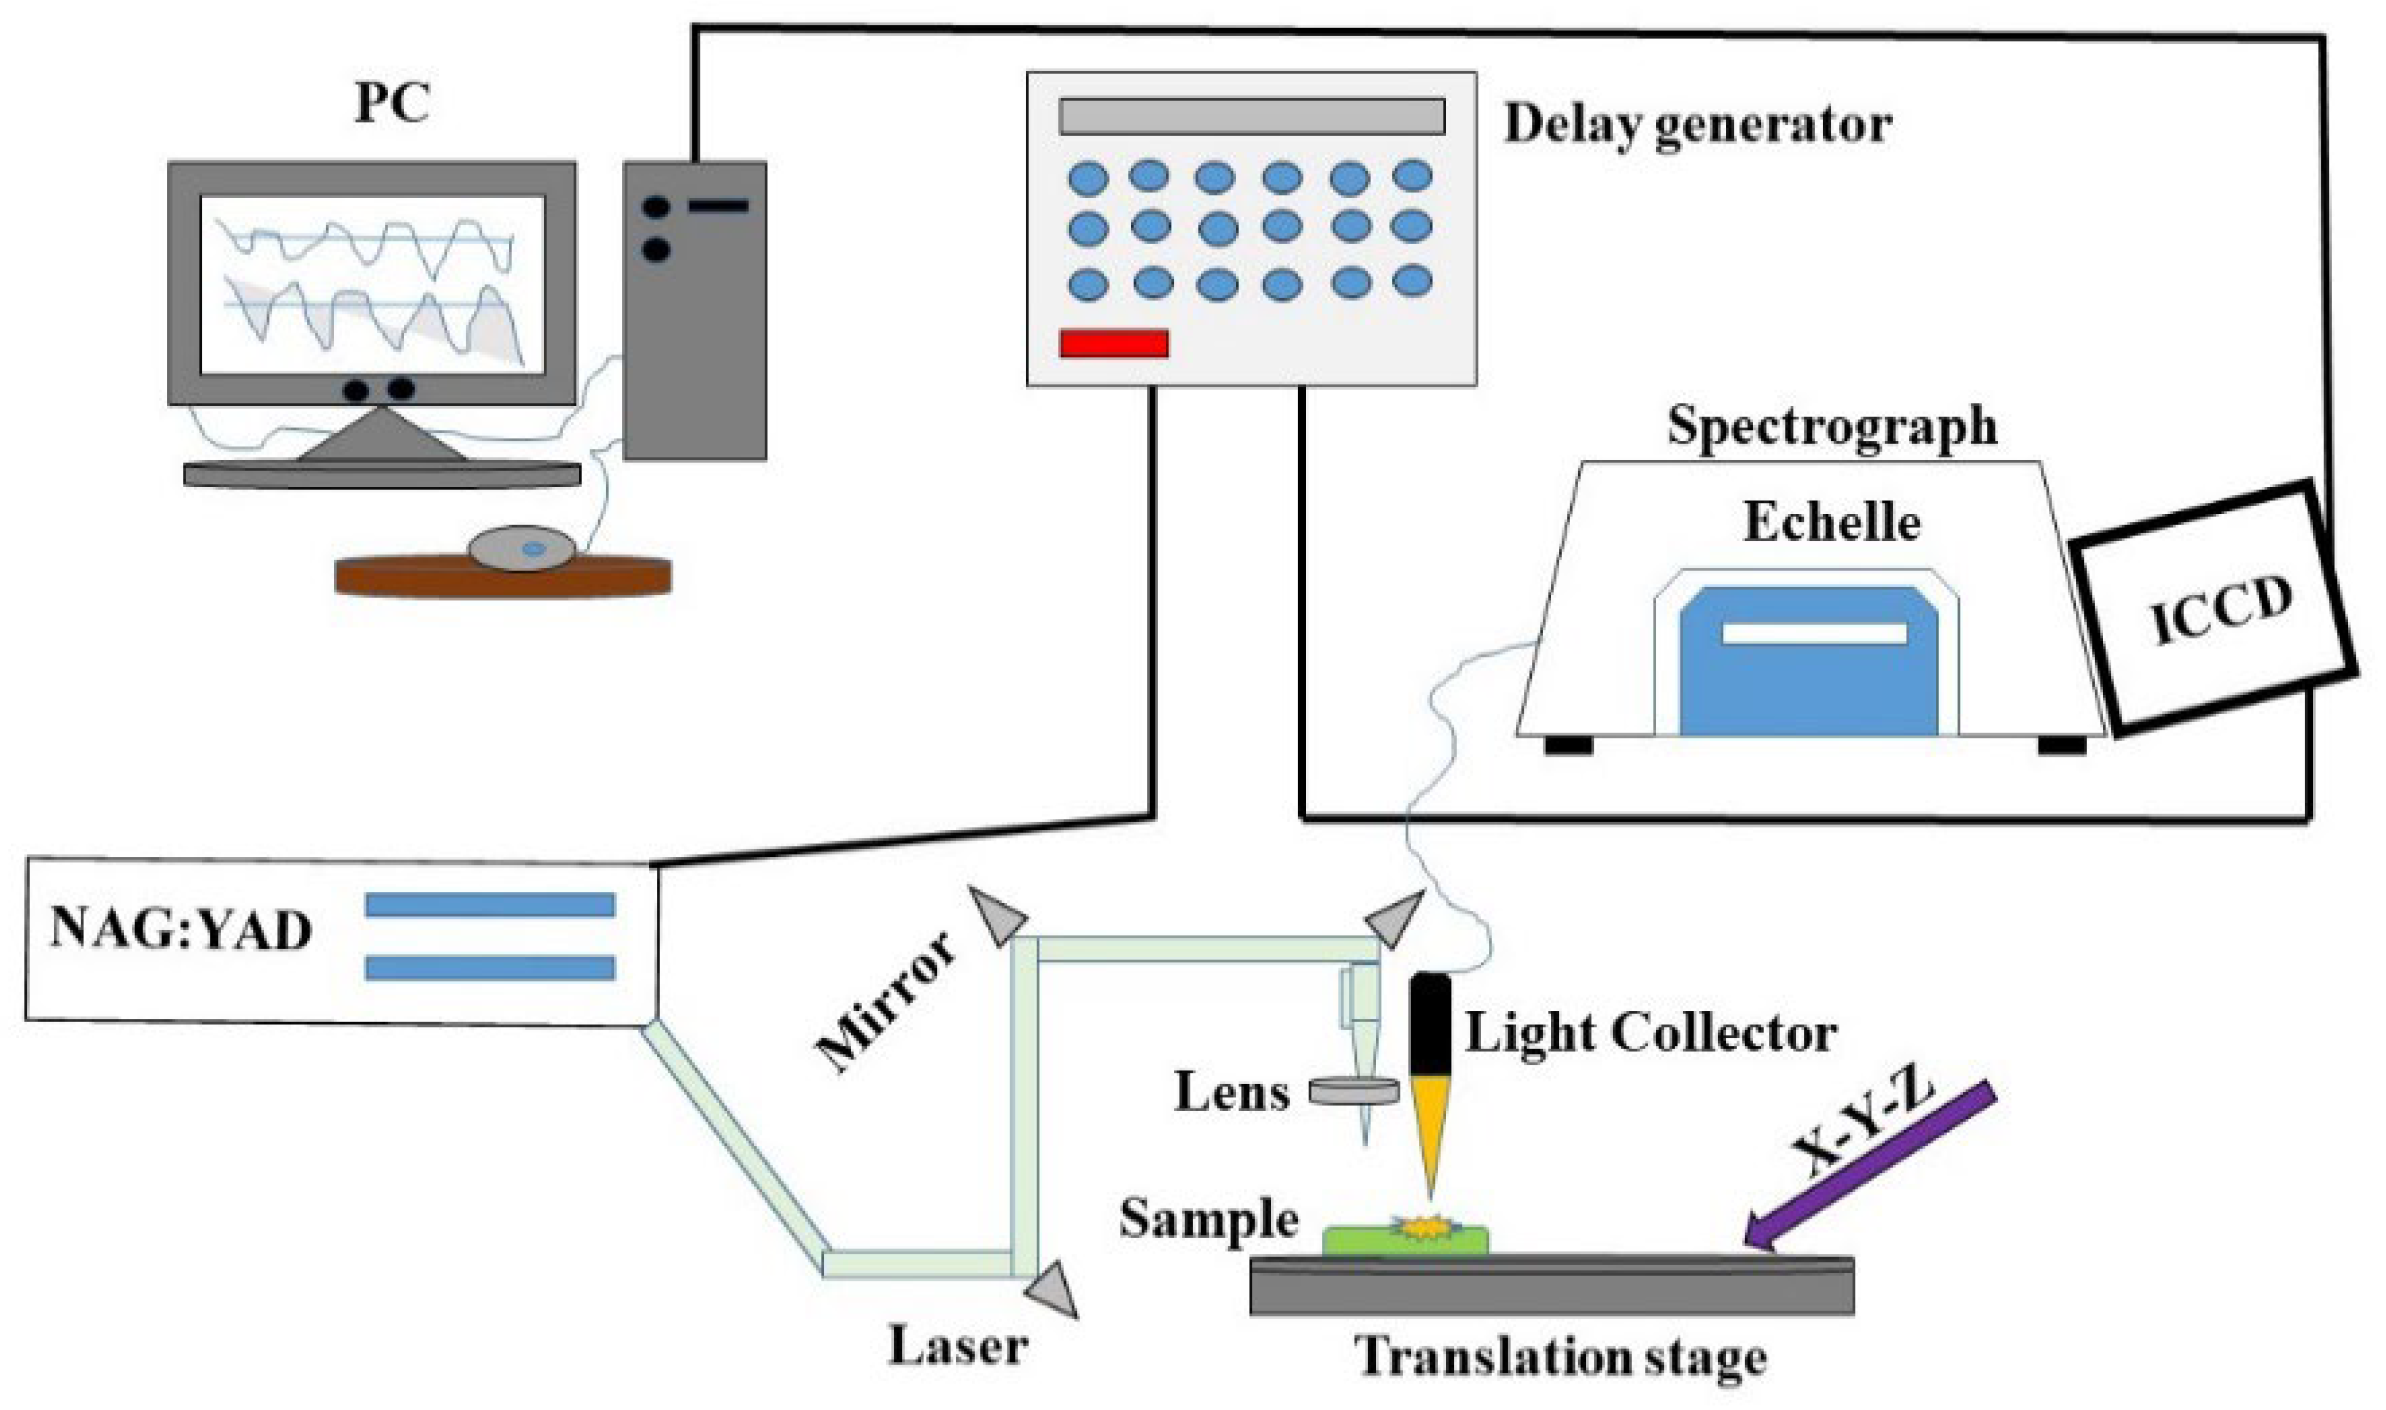
Figure 1. Schematic diagram of the LIBS setup.
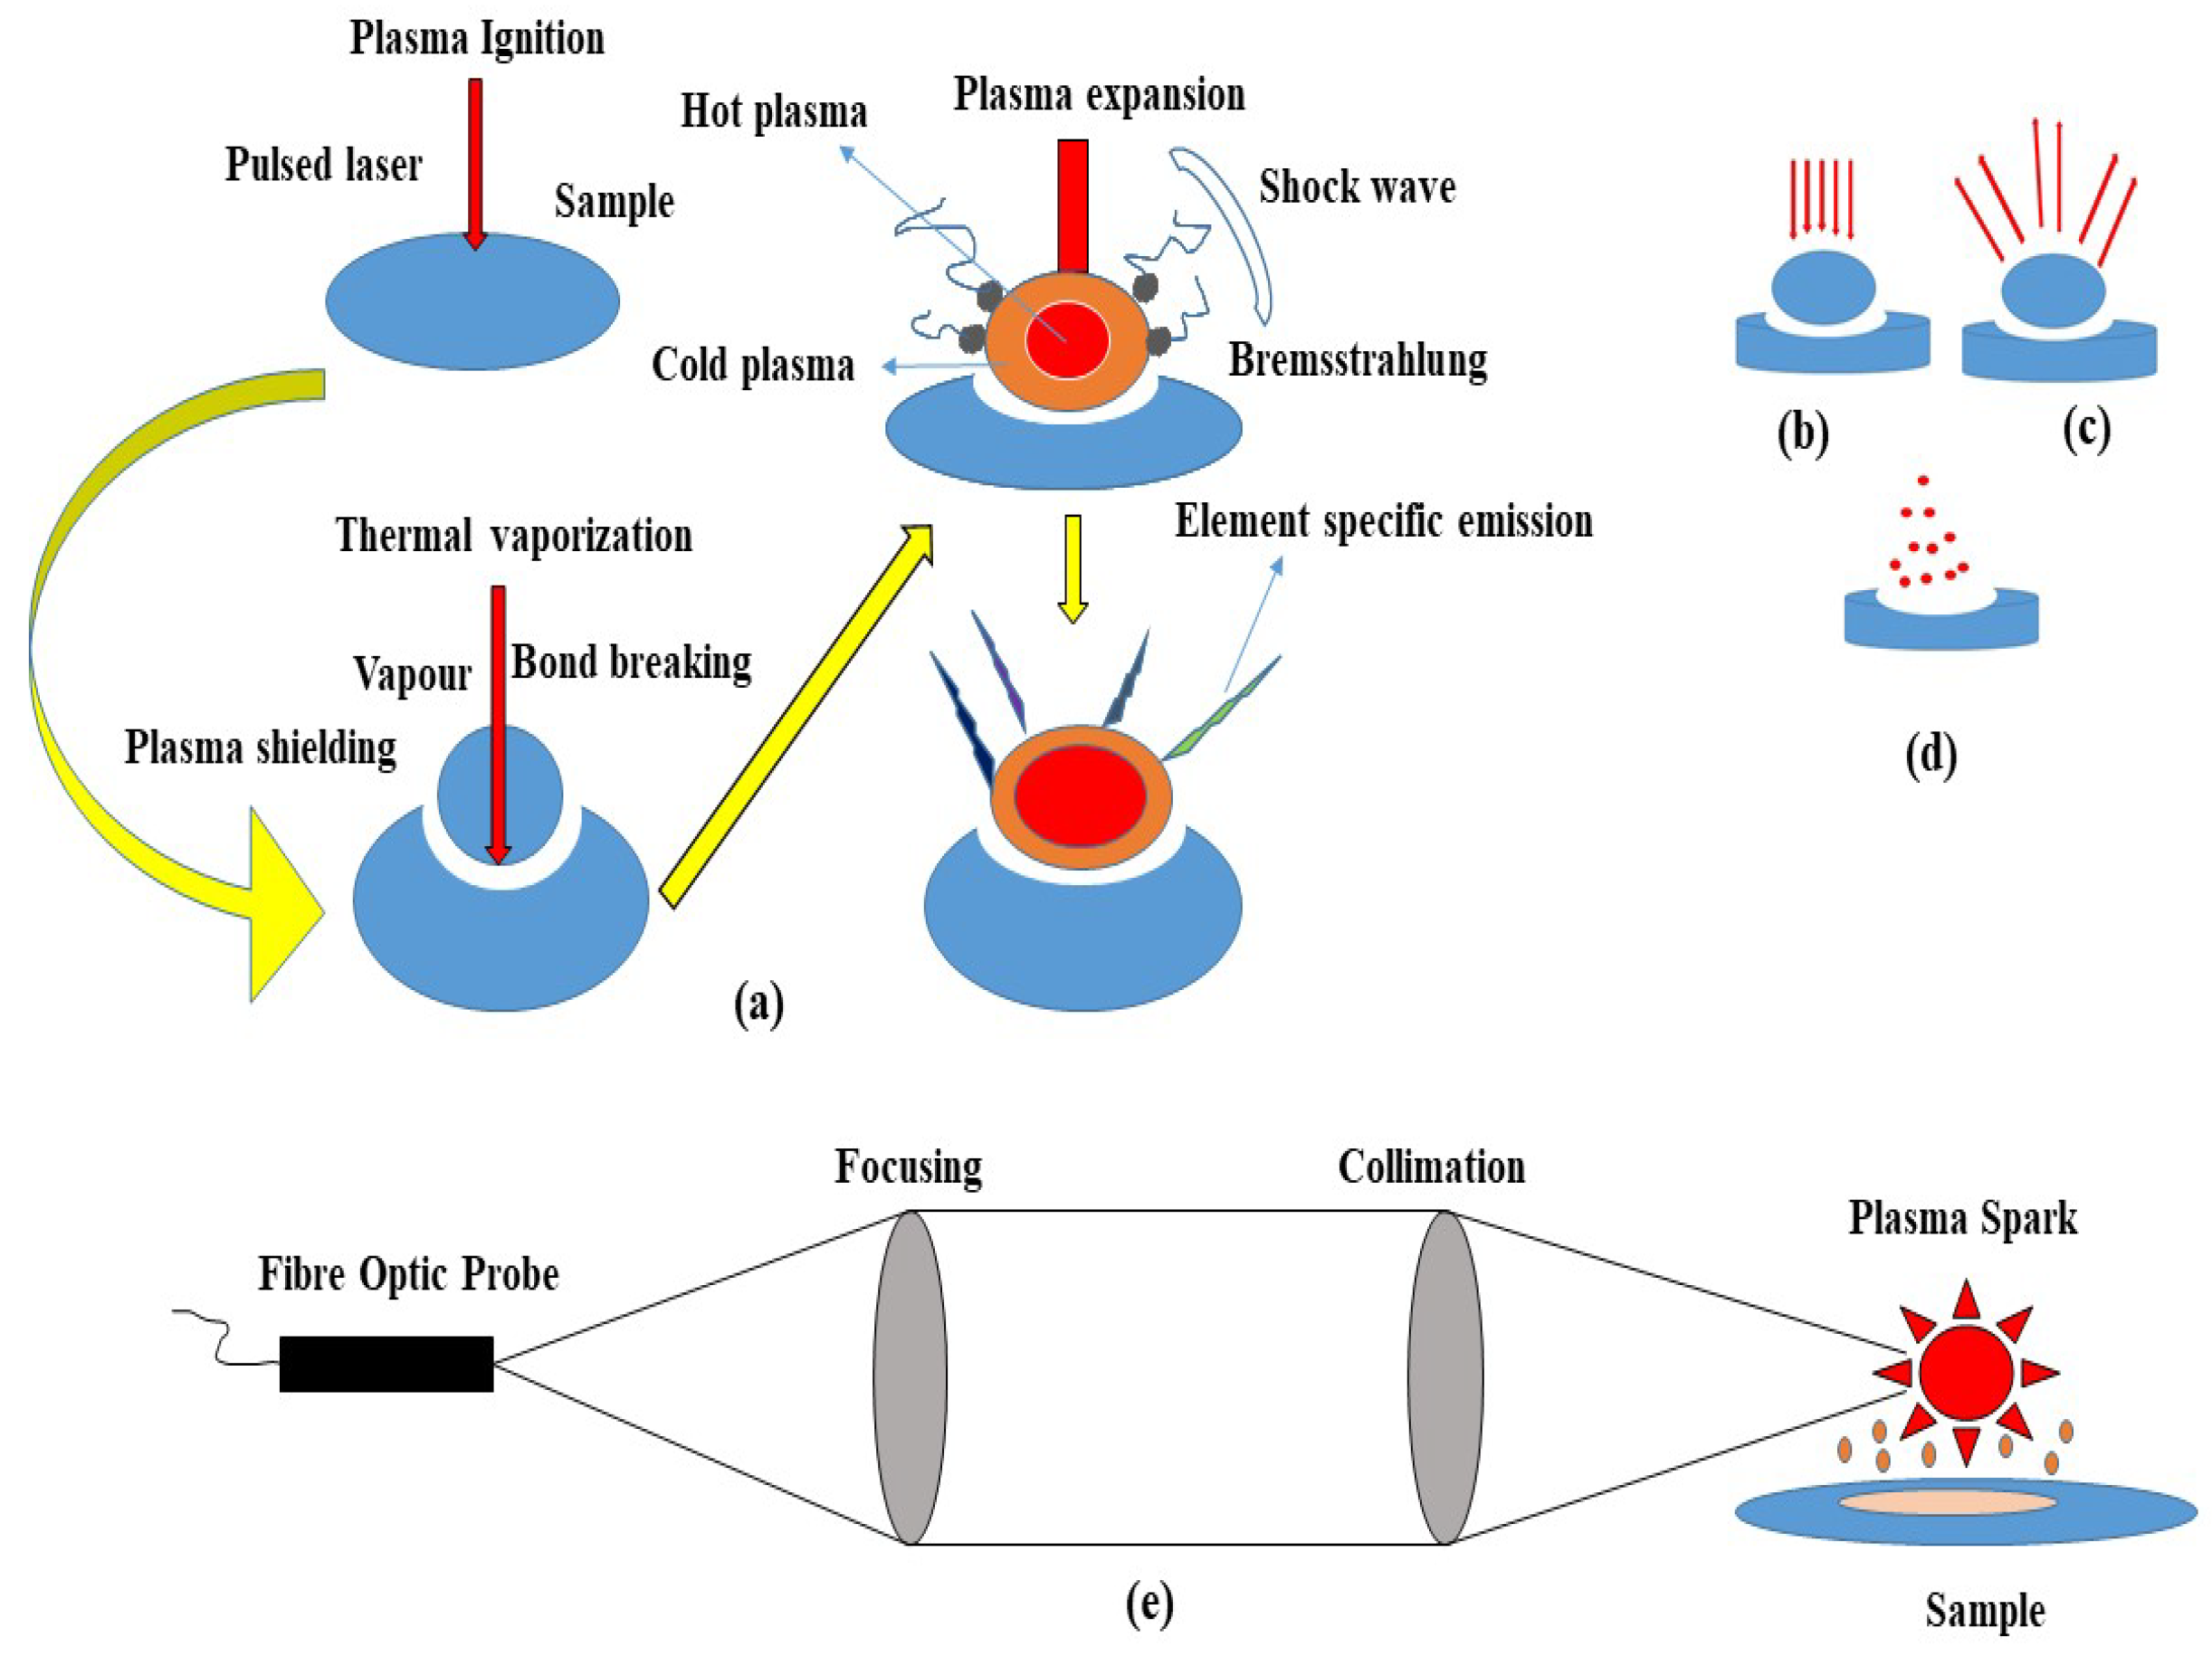
Figure 2. (a) Schematic of the Laser-Induced Breakdown Process. (b) Plasma ignition. (c) Plasma expansion and cooling. (d) Particle ejection and condensation. (e) An example of a light acquisition system.
Time-resolved LIBS measurements are the most common LIBS measurement used for improving signal-to-background ratios and minimizing the amount of continuum background generated during the initial plasma phase. Theoretically, plasma emission lines are analyzed under local thermodynamic equilibrium (LTE) conditions. The LTE can determine the plasma temperature and electron density, which can then be used to study ionization and atomization processes. Laser-induced plasma can vary significantly in size and shape depending on the ambient conditions, such as pressure, gas composition, and gas density [14]. Machine learning (ML) is considered a technique for learning from enormous amounts of data and extracting the unknown features for estimation or labeling. Typically, sample data are analyzed to determine whether there is a relationship between input and output data. It has generally been applied in emerging areas, especially in determining the authenticity of herbs. The complexity and diversity of the herb complicate LIBS spectral analysis, as well as a large number of factors. LIBS can extract the maximum amount of relevant data combined with machine learning techniques. This allows for greater accuracy in classification and quantitative analysis. Despite the volatility of sample spectra, LIBS coupled with machine learning can frequently offset this problem to a great extent. In recent years, ML has made significant advances beyond the traditional chemometric method [15]. It now provides robust and continuously updated algorithms and tools for developing spectroscopic data treatment models [16][17]. RF, for example [18], SVM [19], etc., have been utilized widely in quantitative and qualitative LIBS spectral analyses. Leo Breiman introduced RF in 2001, a regression technique based on multiple classifiers [18]. This strategy is based on the bootstrap method, which is applied continuously in creating test and training samples. RF generates several classification tree forms, and final prediction results are based on a simple majority vote of a single classification tree. In addition to being a useful technique for prediction, RF can also provide higher levels of accuracy. However, these algorithms suffer from a number of inherent shortcomings, which, in turn, has restricted their use in LIBS. Most traditional neural networks use gradient descent algorithms to update their parameters. Thus, the training process is slow, and there is a risk of falling into a local optimum. Thus, many new algorithms have been developed that are highly efficient in generalization at very fast learning rates to overcome these disadvantages. Kernel-based extreme learning machine (K-ELM) is a relatively new nonlinear method that has demonstrated excellent performance in classification and regression applications. As a result, a kernel function can replace the hidden layer of ELM and be used to eliminate the problems presented by traditional neural network training algorithms in terms of speed and over-fitting [20].
LIBS Plasma Production
In plasma production, pulsed lasers are commonly used (LIBS). Specifically, laser characteristics are crucial to plasma production in gaseous, liquid, and solid media. Short-duration laser pulses with different wavelengths can generate multi-million-watt laser pulses from the infrared to the ultraviolet spectrum. Advanced lasers can produce vibrations that contain many billions to trillions of watts. In a fraction of a second, high-power laser pulses can vaporize metallic or refractory surfaces. Powerful lasers capable of delivering their energy to specific locations are significant. More importance is placed on the power per unit area provided to the target rather than its absolute value in LIBS. Depending on the laser wavelength, a power unit is called an “irradiance.” Conventional light sources with kilowatts of power are unable to focus as well as laser radiation and, therefore, cannot produce the same effects that lasers can [21].
3. Advantages and Disadvantages of LIBS
LIBS can deliver an effective response within a short period, high-volume and real-time analytical results both in conventional laboratory settings and in the field. Compared to existing methods, many advantages improve its utility as an analytical technique for materials [22]. LIBS can detect all elements using a single laser pulse with a broadband spectrometer. Although LIBS must follow complex and time-consuming procedures, it does not require much sample preparation compared to other lab-based methods. Compared to many other currently available techniques, its instrumentation purchases and operating costs are less expensive. As it provides high lateral spatial resolution, particles can be examined individually using its real-time visualization of mineral grains or inclusions [23]. A LIBS analysis can be considered minimally destructive since each laser pulse uses only a few nanograms of material. A combination of LIBS and complementary methods enables simultaneous analysis of multiple elements in orthogonal orientation. A stand-off apparatus collected LIBS and RAMAN spectra from minerals of different types [24][25]. Techniques used in all analyses have their limitations. This holds for LIBS, and certain shortcomings should be considered when experimenting. LIBS experiments generally have lower limits of detection and precision than established methods. Despite this, they are often enough to distinguish between samples from different sources.
Due to the nanosecond laser pulses’ uneven energy distribution and differential coupling to the sample surface, the method suffers from matrix effects and shot-to-shot variability. Grain size, texture, reflectivity, and hardness may affect surface structure and physical matrix effects. Surface roughness affects the degree of laser energy coupling and LIBS signals of varying intensities [26]. In-homogeneity in a matrix can be controlled in several ways: homogenizing the sample (which negates a significant advantage of LIBS), implementing and selecting anomalous spectra by an algorithm that does not represent the entire sample interrogating it with laser pulses of hundreds or even thousands [27]. Chemical matrix issues arise when one element influences another element’s emission characteristics. If two different host materials contain the same component concentration, the LIBS emission intensity of the component will be different [28]. Thus, matrix-matched standards are difficult to find for LIBS measurements of biological samples. However, this phenomenon may impede the quantitative differentiation of a LIBS spectrum for a given instance, enhancing the qualitative differentiation of a LIBS spectrum. LIBS can perform internal or external quantitative analyses through calibration [29].
4. Prospects Related to Using LIBS in Herbal Technology
LIBS faces several challenges, primarily its acceptance in spectroscopic analysis. Although calibration-free algorithms are close to achieving this objective, the outcomes are not entirely accurate [13]. Some recent works improve the final result using spectral normalization [13] or a system that can automatically determine the elements of a sample [30]. LIBS may represent the most crucial goal, offering LIBS a place among the most popular spectrochemical techniques. For its widespread use in real applications, new advanced instruments must be developed that are cost-efficient and highly versatile. Obtaining an accurate analysis requires a cumbersome and expensive setup; the size and complexity of LIBS setups are currently being reduced. The recent development of micro LIBS and advancements in laser sources can profit LIBS research by applying the exact and concise setup in the field [13]. It was recently hyphenated with other spectrochemical techniques to combine their advantages. For instance, MSL is an excellent example of an integrated LIBS/Raman system [31][32]. LIBS analysis has recently taken on new forms following new techniques and approaches, including optical catapulting and molecular LIBS [31][32]. The laser pulse used in this procedure is below the plasma threshold energy; it creates solid aerosols that can be analyzed using LIBS. Another form of LIBS is molecular LIBS, which explores the molecules emitted from sample ablation and recombination between elements in the target solution and the surrounding atmosphere [13]. This capability can be added to LIBS to analyze organic samples [33].
Furthermore, improvements are needed in system stability, self-absorption, line broadening, and high intensity of the background continuum, as well as the strong matrix effect. The development of LIBS instrumentation progresses very rapidly, so it appears likely that these improvements will likely overcome most of the drawbacks above. Additionally, chemometrics and data evaluation will enhance the reliability of the results. LIBS has yet to be established as a valid analytical technique for herb analysis, and there are significant research needs both in the research field and at the production level.
References
- Hahn, D.W.; Omenetto, N. Laser-induced breakdown spectroscopy (LIBS), part I: Review of basic diagnostics and plasma-particle interactions: Still-challenging issues within the analytical plasma community. Appl. Spectrosc. 2010, 64, 335–366.
- Miziolek, A.W.; Palleschi, V.; Schechter, I. Laser Induced Breakdown Spectroscopy; Cambridge University Press: Cambridge, UK, 2006.
- Rai, P.K.; Srivastava, A.K.; Sharma, B.; Dhar, P.; Mishra, A.K.; Watal, G. Use of laser-induced breakdown spectroscopy for the detection of glycemic elements in Indian medicinal plants. Evid. Based Complementary Altern. Med. 2013, 2013, 406365.
- Andersen, M.-B.S.; Frydenvang, J.; Henckel, P.; Rinnan, Å. The potential of laser-induced breakdown spectroscopy for industrial at-line monitoring of calcium content in comminuted poultry meat. Food Control 2016, 64, 226–233.
- Bilge, G.; Boyacı, İ.H.; Eseller, K.E.; Tamer, U.; Çakır, S. Analysis of bakery products by laser-induced breakdown spectroscopy. Food Chem. 2015, 181, 186–190.
- Bilge, G.; Sezer, B.; Eseller, K.E.; Berberoglu, H.; Topcu, A.; Boyaci, I.H. Determination of whey adulteration in milk powder by using laser induced breakdown spectroscopy. Food Chem. 2016, 212, 183–188.
- Bilge, G.; Sezer, B.; Eseller, K.E.; Berberoglu, H.; Koksel, H.; Boyaci, I.H. Ash analysis of flour sample by using laser-induced breakdown spectroscopy. Spectrochim. Acta Part B At. Spectrosc. 2016, 124, 74–78.
- Bilge, G.; Sezer, B.; Eseller, K.E.; Berberoğlu, H.; Köksel, H.; Boyacı, İ.H. Determination of Ca addition to the wheat flour by using laser-induced breakdown spectroscopy (LIBS). Eur. Food Res. Technol. 2016, 242, 1685–1692.
- Bilge, G.; Velioglu, H.M.; Sezer, B.; Eseller, K.E.; Boyaci, I.H. Identification of meat species by using laser-induced breakdown spectroscopy. Meat Sci. 2016, 119, 118–122.
- Gondal, M.; Habibullah, Y.; Baig, U.; Oloore, L. Direct spectral analysis of tea samples using 266 nm UV pulsed laser-induced breakdown spectroscopy and cross validation of LIBS results with ICP-MS. Talanta 2016, 152, 341–352.
- Mehder, A.O.; Habibullah, Y.B.; Gondal, M.A.; Baig, U. Qualitative and quantitative spectro-chemical analysis of dates using UV-pulsed laser induced breakdown spectroscopy and inductively coupled plasma mass spectrometry. Talanta 2016, 155, 124–132.
- Hahn, D.W.; Omenetto, N. Laser-induced breakdown spectroscopy (LIBS), Part II: Review of instrumental and methodological approaches to material analysis and applications to different fields. Appl. Spectrosc. 2012, 66, 347–419.
- Brennecke, J.; Stark, A.; Russell, R.B.; Cohen, S.M. Principles of microRNA-target recognition. PLoS Biol. 2005, 3, e85.
- Ogura, Y.; Bonen, D.K.; Inohara, N.; Nicolae, D.L.; Chen, F.F.; Ramos, R.; Britton, H.; Moran, T.; Karaliuskas, R.; Duerr, R.H.; et al. A frameshift mutation in NOD2 associated with susceptibility to Crohn’s disease. Nature 2001, 411, 603–606.
- Yang, X.; Wang, Y.; Byrne, R.; Schneider, G.; Yang, S. Concepts of artificial intelligence for computer-assisted drug discovery. Chem. Rev. 2019, 119, 10520–10594.
- Wang, M.; Jiang, L.; Wang, S.; Guo, Q.; Tian, F.; Chu, Z.; Zhang, J.; Li, X.; Lu, Y. Multiscale visualization of colloidal particle lens array mediated plasma dynamics for dielectric nanoparticle enhanced femtosecond laser-induced breakdown spectroscopy. Anal. Chem. 2019, 91, 9952–9961.
- Tian, H.; Jiao, L.; Dong, D. Rapid determination of trace cadmium in drinking water using laser-induced breakdown spectroscopy coupled with chelating resin enrichment. Sci. Rep. 2019, 9, 1–8.
- Breiman, L. Random forests. Mach. Learn. 2001, 45, 5–32.
- Chen, T.; Zhang, T.; Li, H. Applications of laser-induced breakdown spectroscopy (LIBS) combined with machine learning in geochemical and environmental resources exploration. TrAC Trends Anal. Chem. 2020, 133, 116113.
- Huang, G.-B.; Zhu, Q.-Y.; Siew, C.-K. Extreme learning machine: Theory and applications. Neurocomputing 2006, 70, 489–501.
- Anabitarte, F.; Cobo, A.; Lopez-Higuera, J.M. Laser-Induced Breakdown Spectroscopy: Fundamentals, Applications, and Challenges. ISRN Spectrosc. 2012, 2012, 285240.
- Sendker, J.; Sheridan, H. Composition and Quality Control of Herbal Medicines. In Toxicology of Herbal Products; Pelkonen, O., Duez, P., Vuorela, P.M., Vuorela, H., Eds.; Springer: Cham, Switzerland, 2017; pp. 29–65.
- He, T.-T.; Ung, C.O.L.; Hu, H.; Wang, Y.-T. Good manufacturing practice (GMP) regulation of herbal medicine in comparative research: China GMP, cGMP, WHO-GMP, PIC/S and EU-GMP. Eur. J. Integr. Med. 2015, 7, 55–66.
- Goodarzi, M.; Russell, P.J.; Vander Heyden, Y. Similarity analyses of chromatographic herbal fingerprints: A review. Anal. Chim. Acta 2013, 804, 16–28.
- Bansal, A.; Chhabra, V.; Rawal, R.K.; Sharma, S. Chemometrics: A new scenario in herbal drug standardization. J. Pharm. Anal. 2014, 4, 223–233.
- Kibble, M.; Saarinen, N.; Tang, J.; Wennerberg, K.; Mäkelä, S.; Aittokallio, T. Network pharmacology applications to map the unexplored target space and therapeutic potential of natural products. Nat. Prod. Rep. 2015, 32, 1249–1266.
- Szakiel, A.; Pączkowski, C.; Henry, M. Influence of environmental abiotic factors on the content of saponins in plants. Phytochem. Rev. 2011, 10, 471–491.
- Ning, Z.; Lu, C.; Zhang, Y.; Zhao, S.; Liu, B.; Xu, X.; Liu, Y. Application of plant metabonomics in quality assessment for large-scale production of traditional Chinese medicine. Planta Med. 2013, 79, 897–908.
- Liu, C.X.; Cheng, Y.Y.; Guo, D.A.; Zhang, T.J.; Li, Y.Z.; Hou, W.B.; Huang, L.Q.; Xu, H.Y. A new concept on quality marker for quality assessment and process control of chinese medicines. Chin. Herb. Med. 2017, 9, 3–13.
- Tistaert, C.; Dejaegher, B.; Heyden, Y.V. Chromatographic separation techniques and data handling methods for herbal fingerprints: A review. Anal. Chim. Acta 2011, 690, 148–161.
- Guo, D.a. Quality Marker Concept Inspires the Quality Research of Traditional Chinese Medicines. Chin. Herb. Med. 2017, 9, 1–2.
- Li, P.; Qi, L.W.; Liu, E.H.; Zhou, J.L.; Wen, X.D. Analysis of Chinese herbal medicines with holistic approaches and integrated evaluation models. TrAC Trends Anal. Chem. 2008, 27, 66–77.
- Wu, C.; Lee, S.-L.; Taylor, C.; Li, J.; Chan, Y.-M.; Agarwal, R.; Temple, R.; Throckmorton, D.; Tyner, K. Scientific and regulatory approach to botanical drug development: A US FDA Perspective. J. Nat. Prod. 2020, 83, 552–562.
More
Information
Subjects:
Agricultural Engineering; Spectroscopy; Remote Sensing
Contributors
MDPI registered users' name will be linked to their SciProfiles pages. To register with us, please refer to https://encyclopedia.pub/register
:
View Times:
1.4K
Revisions:
2 times
(View History)
Update Date:
28 Jul 2022
Table of Contents


Notice
You are not a member of the advisory board for this topic. If you want to update advisory board member profile, please contact office@encyclopedia.pub.
OK
Confirm
Only members of the Encyclopedia advisory board for this topic are allowed to note entries. Would you like to become an advisory board member of the Encyclopedia?
Yes
No
${ textCharacter }/${ maxCharacter }
Submit
Cancel
Back
Comments
${ item }
|
${ item.createdUser.fullName }
${ item.createdAt }
${ item.vote }
${ item.reply }
Delete
${ reply.createdUser.fullName }
${ reply.createdAt }
${ reply.vote }
Delete
There is no reply to this comment~
${ item.replyTextCharacter }/${ item.replyMaxCharacter }
Submit
Cancel
More
No more~
There is no comment~
${ textCharacter }/${ maxCharacter }
Submit
Cancel
${ selectedItem.replyTextCharacter }/${ selectedItem.replyMaxCharacter }
Submit
Cancel
Confirm
Are you sure to Delete?
Yes
No