Your browser does not fully support modern features. Please upgrade for a smoother experience.
Submitted Successfully!
 +1 credit
Thank you for your contribution! You can also upload a video entry or images related to this topic.
For video creation, please contact our Academic Video Service.
| Version | Summary | Created by | Modification | Content Size | Created at | Operation |
|---|---|---|---|---|---|---|
| 1 | Zouhair Haddi | -- | 2643 | 2022-07-11 10:37:41 | | | |
| 2 | Beatrix Zheng | + 6 word(s) | 2649 | 2022-07-12 05:41:07 | | | | |
| 3 | Beatrix Zheng | Meta information modification | 2649 | 2022-07-12 05:43:15 | | | | |
| 4 | Beatrix Zheng | + 2 word(s) | 2651 | 2022-07-12 05:57:59 | | |
Video Upload Options
We provide professional Academic Video Service to translate complex research into visually appealing presentations. Would you like to try it?
Cite
If you have any further questions, please contact Encyclopedia Editorial Office.
Haddi, Z.; Ananou, B.; Alfaras, M.; Ouladsine, M.; Deharo, J.; Avellana, N.; Delliaux, S. Atrial Fibrillation Arrhythmia Detection Methods. Encyclopedia. Available online: https://encyclopedia.pub/entry/24997 (accessed on 18 July 2026).
Haddi Z, Ananou B, Alfaras M, Ouladsine M, Deharo J, Avellana N, et al. Atrial Fibrillation Arrhythmia Detection Methods. Encyclopedia. Available at: https://encyclopedia.pub/entry/24997. Accessed July 18, 2026.
Haddi, Zouhair, Bouchra Ananou, Miquel Alfaras, Mustapha Ouladsine, Jean-Claude Deharo, Narcís Avellana, Stéphane Delliaux. "Atrial Fibrillation Arrhythmia Detection Methods" Encyclopedia, https://encyclopedia.pub/entry/24997 (accessed July 18, 2026).
Haddi, Z., Ananou, B., Alfaras, M., Ouladsine, M., Deharo, J., Avellana, N., & Delliaux, S. (2022, July 11). Atrial Fibrillation Arrhythmia Detection Methods. In Encyclopedia. https://encyclopedia.pub/entry/24997
Haddi, Zouhair, et al. "Atrial Fibrillation Arrhythmia Detection Methods." Encyclopedia. Web. 11 July, 2022.
Copy Citation
Atrial fibrillation (AF) is still a major cause of disease morbidity and mortality, making its early diagnosis desirable and urging researchers to develop efficient methods devoted to automatic AF detection. Till now, the analysis of electrocardiography (Holter-ECG) recordings remains the gold-standard technique to screen AF. This is usually achieved by studying either RR interval time series analysis, P-wave detection or combinations of both morphological characteristics. After extraction and selection of meaningful features, each of the AF detection methods might be conducted through univariate and multivariate data analysis. Many of these automatic techniques have been proposed over the last years.
atrial fibrillation
arrhythmia
RR time series
diagnosis-based-data
univariate analysis
multivariate analysis
1. Introduction
In this entry, a selection of works that attempt to solve the problem of detecting atrial fibrillation (AF) are presented. Most of them use a two-step procedure after electrocardiogram (ECG) data pre-processing as shown in Figure 1: first, feature extraction from RR time series (tachogram) or P-wave or their combination is conducted and then followed by a classification building process based on the extracted parameters. The performance of the major established classification methods was evaluated on Physionet signals; a publicly accessible online database containing physiologic signals. Seven datasets are commonly used: MIT-BIH Arrhythmia Database (abbreviated MITDB or often MIT-BIH AR as well), MIT-BIH Atrial Fibrillation Database (AFDB), Long-Term AF database, Paroxysmal Atrial Fibrillation Prediction Challenge Database (ParAFDB), AF Termination Challenge Database (AFTermDB), MIT-BIH Normal Sinus Rhythm Database (NSRDB), and Normal Sinus Rhythm RR Interval Database (NSR2DB).
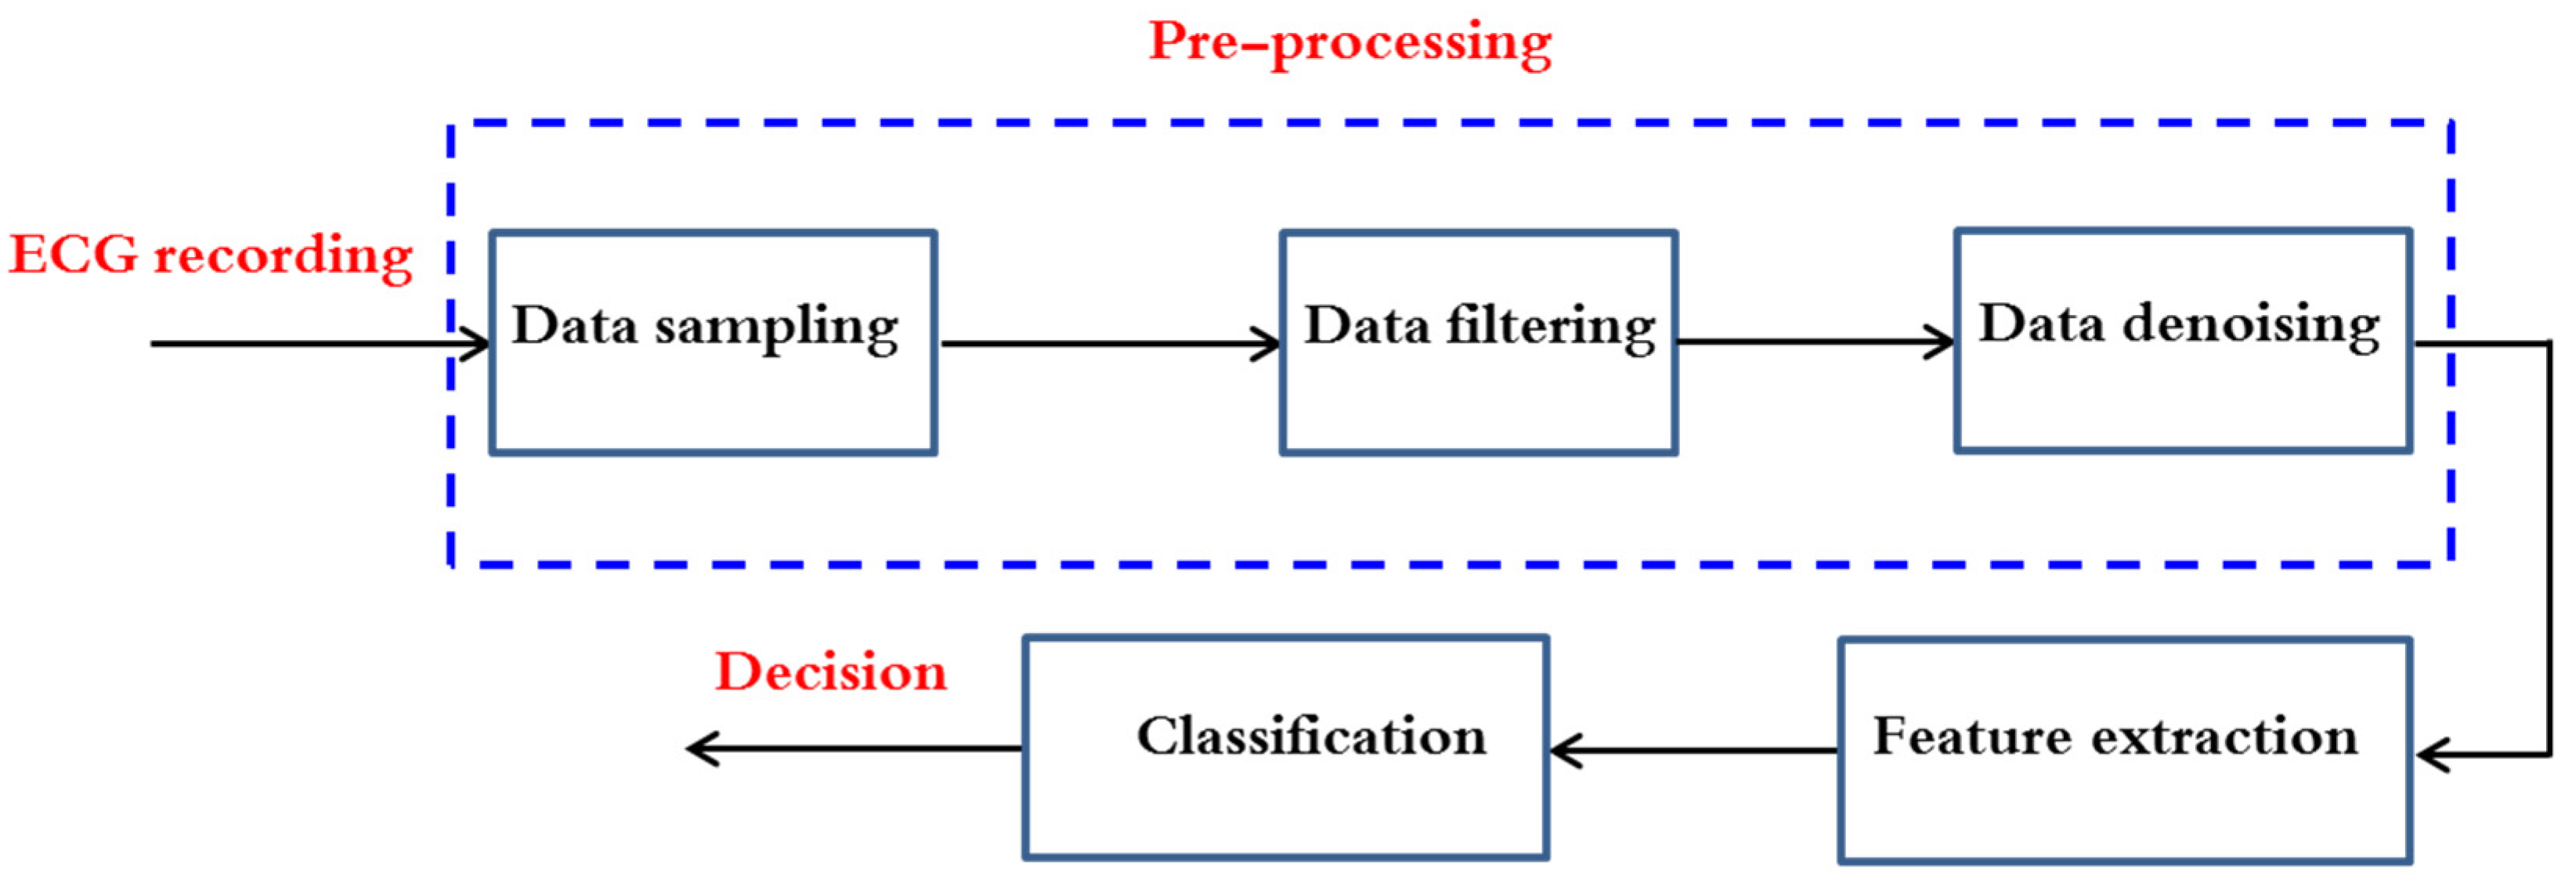
Figure 1. ECG classification flow chart analysis.
As said previously, cardiology experts inspect ECG recordings in an experienced-based manner to identify any type of heart rhythm. In an automated AF detection algorithm, this step is equated with extraction of interesting and discriminant variables from the ECG signals. These parameters help to characterize the P-wave (presence, morphology) and the RR intervals’ variability (regularity, irregularity, pattern).
After reviewing recent papers, the researchers have noticed that the published works dealing with AF detection may be categorized in six methodologies as summarized in Figure 2.
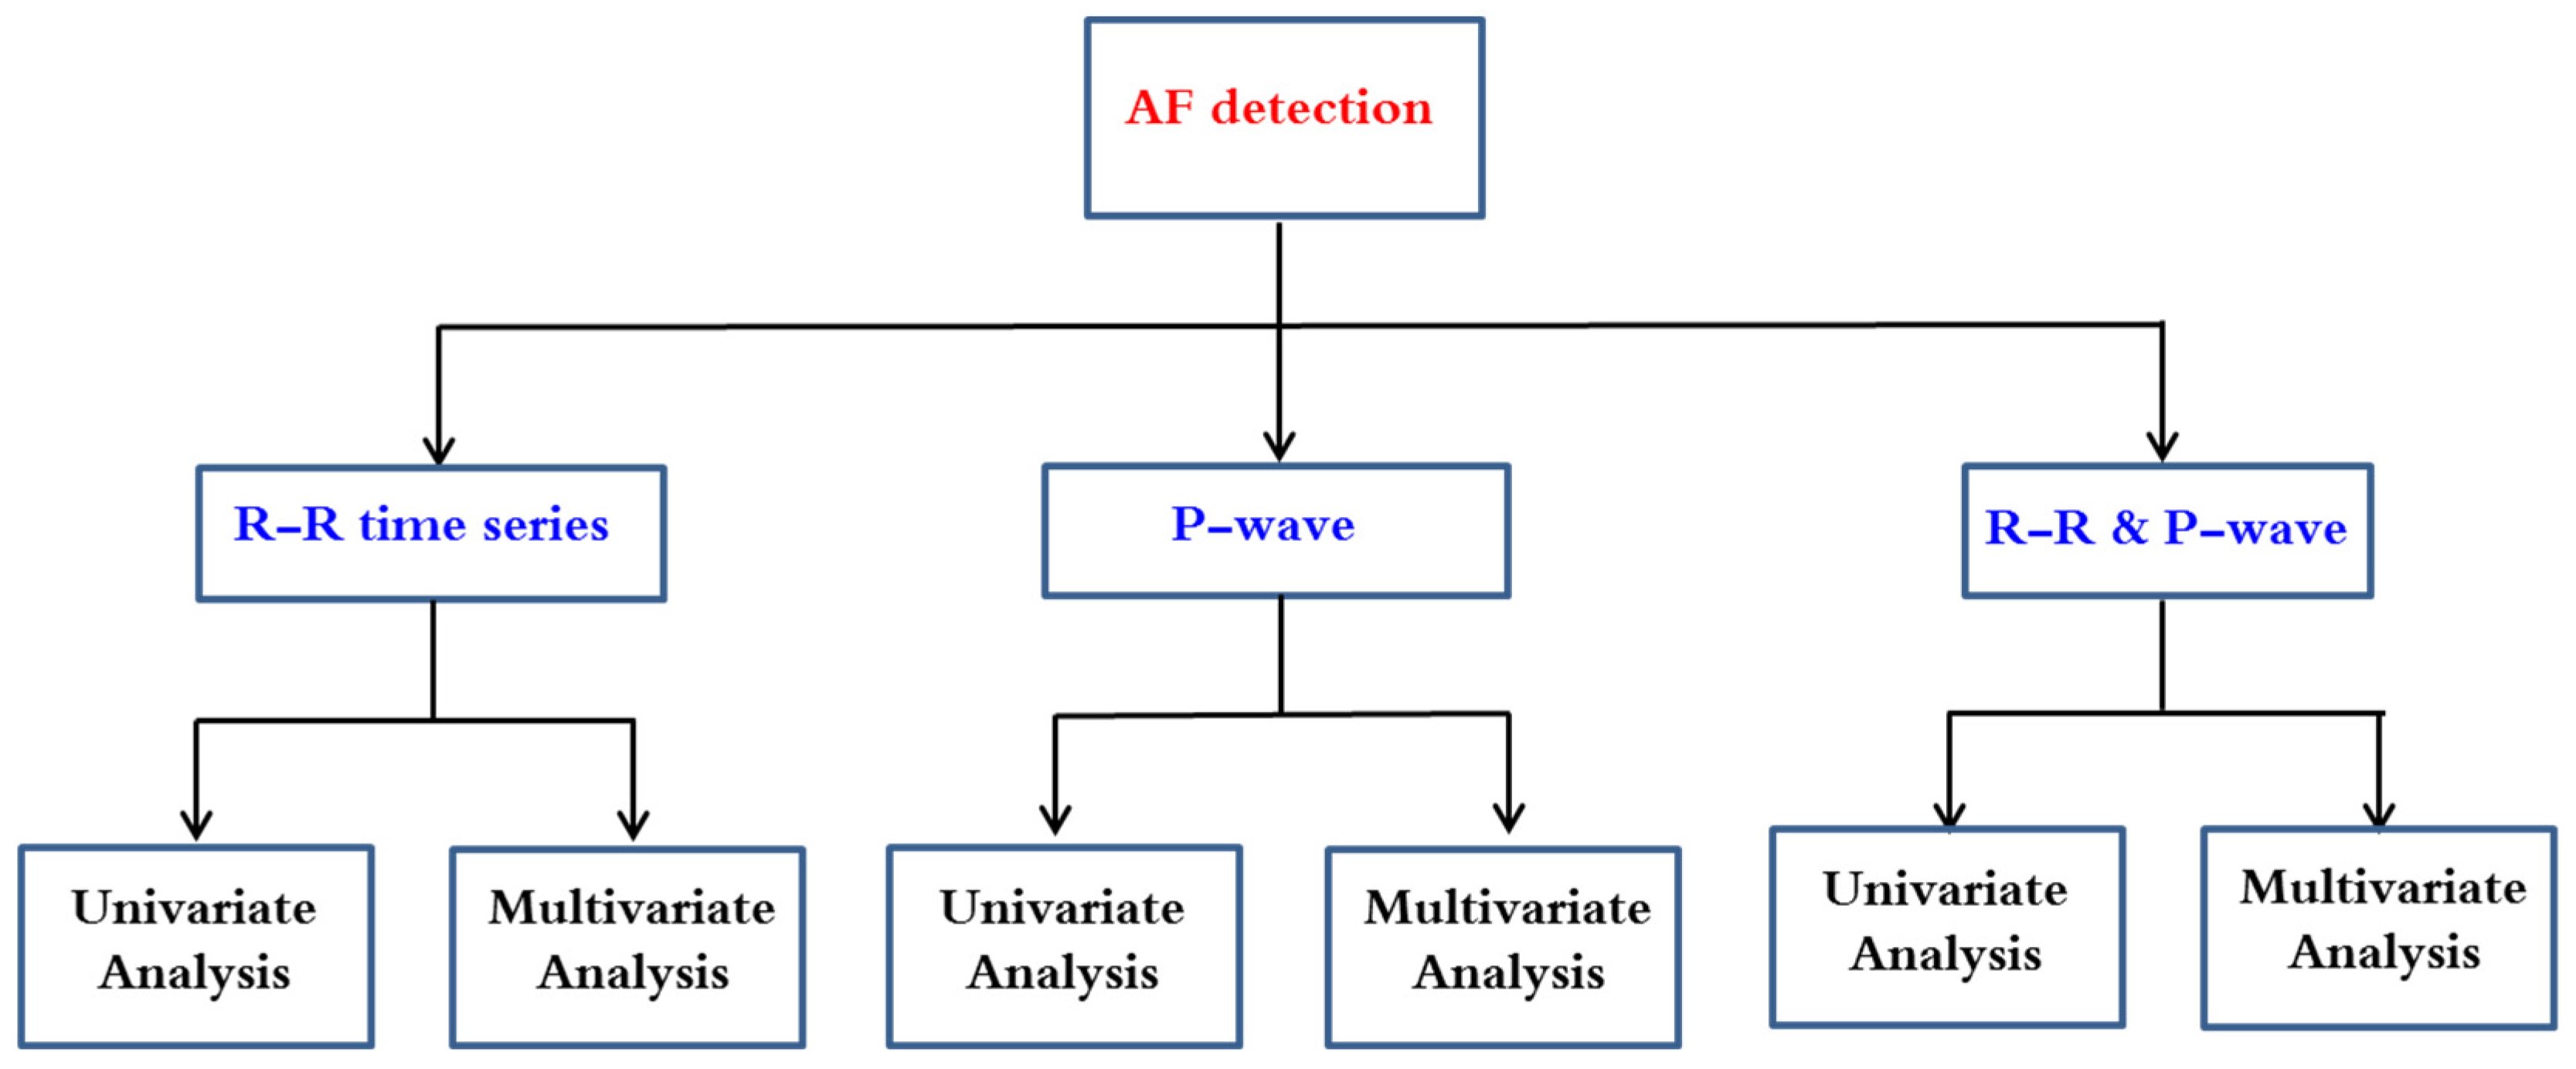
Figure 2. Automatic AF detection methodologies.
This entry highlights the advances in AF detection that followed RR time series analysis. Since P-waves are associated with significantly higher computational resources than are the RR-based classifiers, their integration in a low power demanding electronic device is not a realistic option. Furthermore, the detection of P-wave fiducial points is a very difficult task because of its low amplitude, which makes it prone to corruption by noise. This being so, some authors have demonstrated that opting for complex features by using morphologic analysis does not necessarily outperform that the results achieved by an RR-based AF classifier [1][2]. For these reasons, the analysis of RR irregularities is most studied by researchers rather than the absence of P-waves or the combination of both characteristics.
The AF detectors are evaluated by the following metrics:
Accuracy: Ac = (TP + TN)/N, Sensitivity: Se = TP/(TP + FN), Specificity: Sp = TN/(TN + FP), Precision, also known as Positive Predictive Value: Pr = PPV = TP/(TP + FP), and, less often, Negative Predictive Value: NPV = TN/(TN + FN); where TP is the number of True Positives or correctly detected AF episodes, TN is the number of True Negatives or correctly detected non-AF episodes, FP is the number of False Positives, i.e., normal rhythms misclassified as AF, and FN is the number of False Negatives or missed AF cases classified as normal. The total number of observations is denoted by N. Sensitivity-Specificity and Sensitivity-Precision metrics dyads are usually favored in comparison to Ac alone or more ambiguous success rates, as better describing the classification tradeoffs between the ability to capture existing cases and the certainty of the classification results obtained.
In terms of features, research on heart rate variability (HRV) traits has been paving the way for the work on arrhythmia classification based on RR metrics (demoted NN when dealing with normal heartbeats). The QRS complex, i.e., the most prominent characteristic among the PQRST electrocardiogram wave points (see Figure 3), is understandably at the basis of ECG assessment and has been extensively investigated. QRS detection algorithms and R-R interbeat computation are standard practice in ECG processing nowadays, with RR time series (tachogram) and subsequent HRV features currently being implemented in online paradigms [3] and seen in wearable health tracking domains. Established HRV analysis practice covers:
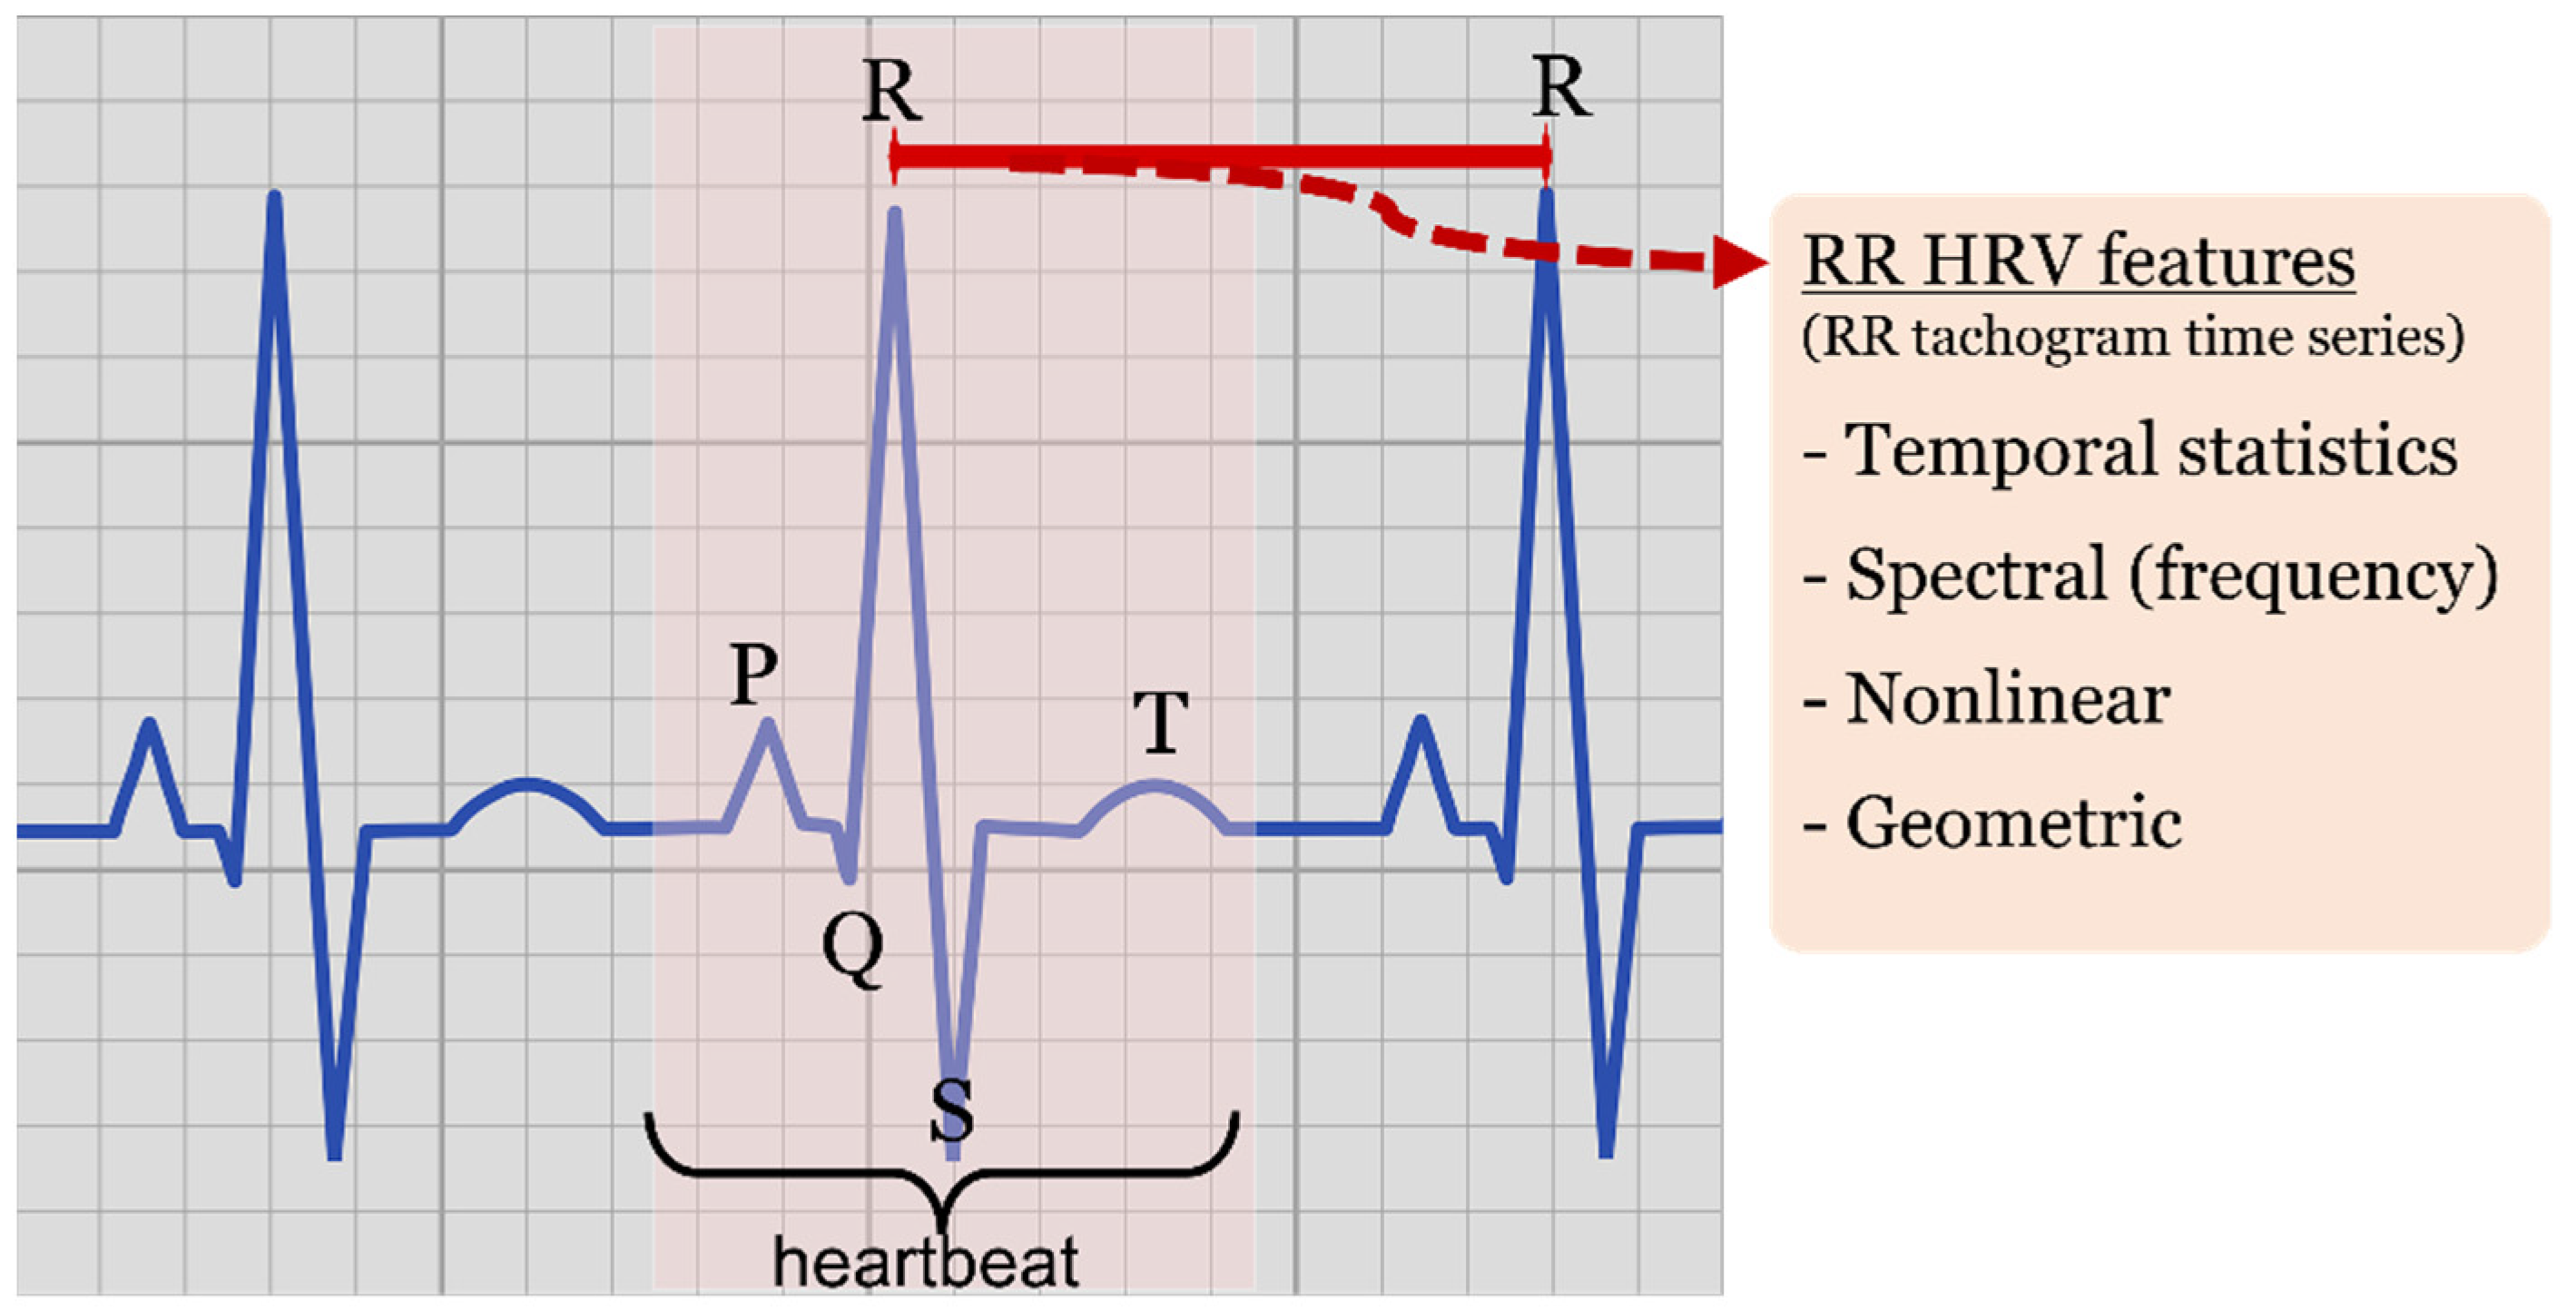
Figure 3. ECG representation. Highlighted heartbeat, PQRS wave points, RR interval (red) observed between QRS complexes and type of HRV features derived from RR time series (tachogram).
-
Statistical features of temporal nature, such as minimum RR intervals (minRR), maximum RR interval (maxRR), mean RR (<RR>), RR standard deviation (SDRR), root mean square of successive ΔRR differences (RMSSD) and standard deviation of successive differences (SDSD) working as derivative approximations, pNN20 and pNN50 ratios characterizing the amount of heartbeat intervals greater than a given value (20 or 50 milliseconds, respectively) with respect to all the intervals within the processed window.
-
Nonlinear features, such as those derived by the elliptic geometry of the recurrence plot depicting RRi-RRi+1 consecutive interval relationship (known as Poincaré recurrence plot or Lorenz plot depending on the research discipline).
-
Spectral (frequency) features of the tachogram, characterizing power spectral densities, and different spectral band ratios obtained by spectral analysis methods such as Fourier transform approximations, Lomb-Scargle estimates or wavelet transforms, among others.
-
Geometric features, derived by histogram shape analysis, such as triangular indexes and interpolation.
Other features applied to RR or directly to the ECG waveforms have often been used, such as the study of turning points, the application of different definitions of sample entropy (SampEn), Shannon entropy (ShE), and coefficient of sample entropy (COSEn), more elaborate statistics such as ANOVA analysis, statistical tests and coefficient of variation (CV) taking mean and standard deviation ratios, or different approximations to parameter derivatives. Moreover, it is well-known that the QRS complex is the least sensitive trait to muscle artefacts and/or other noises [4]. Unlike sinus rhythm, which is characterized by quite similar RR durations, AF has an irregular RR interval variability. Many researchers have developed different methods to detect AF by RR time series. Among the different AF detection methods centered on RR features, automatic techniques follow univariate or multivariate approaches.
2. Application of Univariate Data Analysis on RR Time Series
The best way to get a first impression about the complex data of the RR time series is a univariate data evaluation. Indeed, a great number of researchers has opted for this approach rather than multivariate data analysis. Simplicity, short computation times and efficiency are its main advantages. Major applications of univariate RR data analysis for AF diagnosis found in the literature are described in this subsection.
To begin with, the effectiveness of three methods for the analysis of patients suffering from AF or not are investigated by Kikillus et al. [5]. The first one is established on the basis of risk level which is calculated from a Poincaré plot (recurrence). In this case, this plot is obtained from the temporal differences of consecutive RR intervals, after normalization and standard deviation. A patient presenting higher risk levels than those specified in specific threshold is identified as a patient with AF. The second method consists of three different tests, based on integral calculation, that compare different frequencies of 45 min of RR intervals. Their third method consists of two tests that utilize 3500 adjacent RR interval differences. The AF decision is made based on histogram, difference feature and pNN200 (a modification of the standard parameter pNN50). The performance of the three methods was evaluated by using the AFDB and the NSRDB datasets. The sensitivity and specificity of the first method are 91.5% and 96.9%, respectively [6]. Method 2 results in a sensitivity of 93.3% and a specificity of 92.8% and method 3 in a sensitivity of 94.1% and a specificity of 93.4%. Since ectopic beats were removed from RR intervals, these results may change in real cases.
The effect of recording duration on AF detection has been studied by P. Langley et al. [7]. Three features have been studied: coefficient of variation (CV), mean successive difference (Δ) and coefficient of sample entropy (COSEn). The Receiver operating characteristic (ROC) analysis results show that for a recording duration of only 10 s, sensitivities and specificities reached more than 94% and around 93%, respectively. They demonstrated that recording durations of less than 5 s are possible but useless mainly for low heart rates, as the recorded beats will not be able to determine the classifier indices. On the other hand, detection performance using COSEn has shown less dependence on rhythm classification than the other features and is said to be a powerful detector against ectopic beats.
Another use of Entropy was studied by Douglas E. Lake et al. [8], analyzing short (12-beat) AF episodes. Optimal template length and the tolerance matching have been carefully checked. ROC analysis results showed a sensitivity of 91% and a specificity of 94% for the AFDB dataset.
Sándor Hargittai [9] has investigated the performance of Shannon entropy, Root Mean Square of Successive 80-RR Differences, other statistical methods (mean value, standard deviation, etc.), turning point ratio, various scatter plots and Sample Entropy features to detect AF. In this research, the scatter plot of successive RR differences (dRR Lorenz Plot) and Sample Entropy were used to yield an approximate error rate of 5% for the MIT-BIH Arrhythmia Database, AFDB and Long-Term AF datasets.
Another simple method to detect AF was proposed by J. Lian et al. [10]. Their algorithm is based on a map of RR vs. RR intervals change of RR intervals (RdR). The map was constructed by dividing a grid with 25-ms resolution in two axes and only non-empty cells are counted to distinguish between AF and non-AF episodes. Three recording durations have been studied: 32, 64, or 128 RR intervals. ROC curve analysis allowed to fix an optimal threshold for AF detection, which yields good sensitivity and specificity for episodes of 32 RR time series (94.4% and 92.6%, respectively), 64 (95.8% and 94.3%), and 128 (95.9% and 95.4%).
3. Application of Multivariate Data Analysis on RR Time Series
In RR time series analysis, it is important to quantify the randomness of the RR intervals. This is usually done by simple measures. Additionally, modeling helps in the attempt to construct a model capturing RR irregularity. AF arrhythmia’s erratic nature, though, makes it difficult to exactly model RR irregularities present in AF. However, telling apart AF RR irregularities and that of other of other cardiac arrhythmias is supported by models.
The research works on automatic AF detection using multivariate data analysis and which have been applied successfully to RR time series are discussed in the subsection. Figure 4 outlines different types of data analysis techniques. The abbreviations are listed in Table 1.
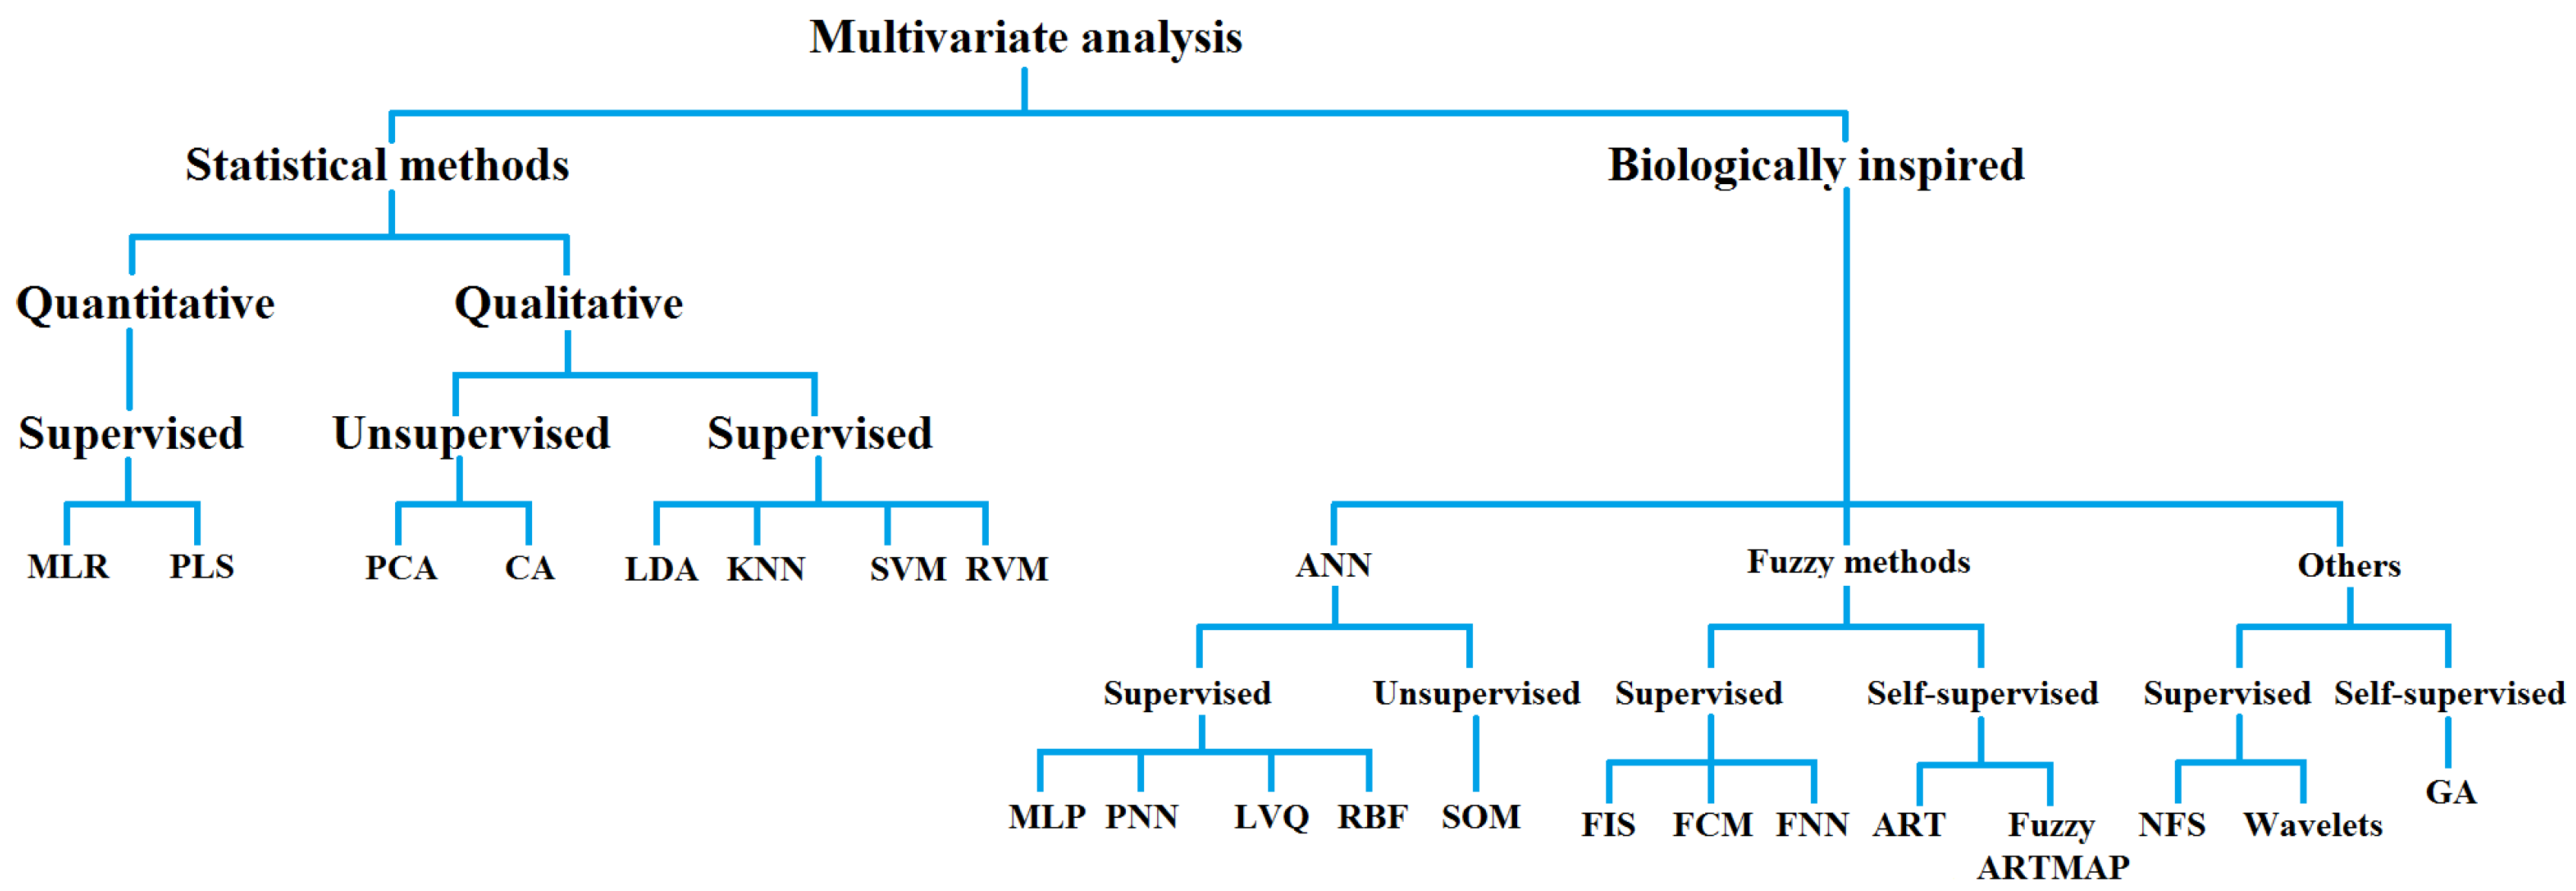
Figure 4. Multivariate data analysis methods organized as statistical or biologically inspired techniques.
Table 1. Multivariate analysis methods and abbreviations.
| Statistical Methods of Multivariate Analysis | Biologically Inspired Methods of Multivariate Analysis |
|---|---|
| MLR: Multiple linear regression | ANN: Artificial neural networks |
| PLS: Partial least square | MLP: Multi-layer perceptron |
| PCA: Principal component analysis | PNN: Probabilistic neural network |
| CA: Cluster analysis | LVQ: Learning vector quantization |
| LDA: Linear discriminant analysis | RBF: Radial basis function |
| KNN: K-nearest neighbors | SOM: Self-organizing map |
| SVM: Support vector machine | FIS: Fuzzy inference system |
| RVM: Relevance vector machine | FCM: Fuzzy c-means |
| FNN: Fuzzy neural network | |
| ART: Adaptive resonance theory | |
| NFS: Neuro fuzzy system | |
| GA: Genetic algorithm |
To illustrate this idea, Roberta Colloca et al. have compared univariate and multivariate data analysis to build a reliable AF detector [11]. Ten RR features present in approaches that had demonstrated high performance were tested. The classification performances of the selected features were evaluated via two methods, i.e., using univariate analysis and Support Vector Machine (SVM) as a robust multivariate data analysis. The chosen variables were as follows: COSEn; SampEn; OriginCount (the count of the number of {RRi; RRi-1} values in the bin containing the origin); PACEvidence (reflects the evidence of compensatory pauses); IrregularityEvidence (measured the sparseness of RR histogram distribution); AFEvidence (AFEvidence = IrregularityEvidence OriginCount − 2 × PACEvidence), as described by Sarkar et al. [12]; and the median of absolute deviation (MAD) [13], which is a RR variance-based AF feature. Median heart rate, minimum RR interval and mean RR interval were also included within the set of chosen features. In addition, window lengths (WL) varying from 12 to 300 s and minimum number of AF beats (minNbeat) within an N-beat segment were carefully quantified as a requirement to classify a given segment as an AF event. Indeed, researchers followed a 5-fold cross validation to assess the optimal WL using the minNbeat values. Excellent results have been obtained by using the SVM, built by nine out of ten features, on the AFDB for training purposes (Se = 99.07% and Ac = 98.84%) and both the NSRDB and the MIT-BIH Arrhythmia Database for testing (Se = 96.35% and Sp = 98.91% for a relatively short window length of 65 beats). These findings were enhanced for window length of 140 beats and outperformed all the features analyzed separately.
M. Mohebbi and H. Ghassemian have compared two cascade multivariate analysis methods to detect AF episodes of only 32 RR intervals [14]. The idea was to perform a dimensionality reduction of features and selection of discriminating ones by choosing between principal component analysis (PCA) and linear discriminant analysis (LDA) and then conduct a support vector machine (SVM) classification based on the resulting features. PCA and LDA have reduced the initial set of features from 9 (6 linear and 3 nonlinear features) to 4 principal components and 4 discriminant functions, respectively. To build a robust SVM classifier, radial basis function (RBF) as kernel function has been used and kernel width σ and regularization constant C were optimized (σ = 10 and C = 1). The overall sensitivity and specificity of the proposed method (LDA + SVM) have reached 99.07% and 100%, respectively, when tested on MIT-BIH Arrhythmia Database. These results outperformed those of PCA + SVM approach (99.28% of specificity) and were also better than the SVM classifier when it was directly used on the initial nine features (97.22% of sensitivity and 98.57% of specificity).
The same strategy has been attempted in a work with Mohammadzadeh Asl et al. to discriminate six different types of arrhythmia classes including NSR and AF [15]. Here, generalized discriminant analysis (GDA) feature reduction was used to yield 5 discriminant functions instead of 15 extracted from the input HRV signal (32 RR intervals) of MIT-BIH Arrhythmia Database. SVM-based radial basis function was then applied to both original and reduced features using the optimum values of σ (=0.08) and C (=30). The authors have compared the performances of two types of SVM decomposition method: the one-against-one and the one-against-all. This latter has outperformed the first one and therefore can discriminate the NSR with an overall accuracy of 98.94%, the AF with 98.53%, the premature ventricular contraction with 98.96%, the sick sinus syndrome with 98.51%, the ventricular fibrillation with 100%, and the 2° heart block with 100%.
In another study [16], they have extracted 14 features from HRV signal. These features consist of 4 spectrum features (spectral power in the low frequency (LF) and high frequency (HF) bands and their frequency peaks), 6 cross-spectrum features, and 4 nonlinear features including SD1, SD2, SD1/SD2, and sample entropy. ANOVA (analysis of variance) test of these features was applied to determine whether there were statistical differences in the features extracted from paroxysmal AF (PAF) and non-PAF episodes. For the AFDB, all the features exhibit statistically significant differences in two groups except frequency peaks in LF and HF bands, which were then eliminated from SVM classifier building. By using RBF Kernel function, the optimum values of SVM parameters are achieved as 3.6 and 10 for σ and C, respectively. The obtained sensitivity and specificity were 96.30% and 93.10%, respectively.
4. Summary of RR-Based Automated AF Detection Research Studies
By means of the state-of-the-art literature described, the researchers presented a selection of works that have kept studies on algorithms and features suited for automated atrial fibrillation detection at the forefront of research. Originally, the QRS detection and the simple RR interbeat interval estimation supporting the computation of tachogram (RR series) and HRV features gave rise to a wide set of statistical, spectral and nonlinear approaches applied to such variables. This field, however, has recently experienced a significant surge prompted by the advances seen in health monitoring device development initiatives and the opportunities brought by a set of more mature IoT and Cloud infrastructures giving way to remote processing paradigms traditionally deemed as computationally demanding.
References
- Babaeizadeh, S.; Gregg, R.E.; Helfenbein, E.D.; Lindauer, J.M.; Zhou, S.H. Improvements in atrial fibrillation detection for real-time monitoring. J. Electrocardiol. 2009, 42, 522–526.
- Carvalho, P.; Henriques, J.; Couceiro, R.; Harris, M.; Antunes, M.; Habetha, J. Model-based atrial fibrillation detection. In ECG Signal Processing, Classification and Interpretation; Gacek, A., Pedrycz, W., Eds.; Springer: London, UK, 2012; pp. 99–133.
- Ramos, G.; Alfaras, M.; Gamboa, H. Real-Time Approach to HRV Analysis. In Proceedings of the 11th International Joint Conference on Biomedical Engineering Systems and Technologies, Funchal, Portugal, 19–21 January 2018; pp. 208–215.
- Oster, J.; Clifford, G.D. Impact of the presence of noise on RR interval-based atrial fibrillation detection. J. Electrocardiol. 2015, 48, 947–951.
- Kikillus, N.; Hammer, G.; Lentz, N.; Stockwald, F.; Bolz, A. Three Different Algorithms for Identifying Patients Suffering from Atrial Fibrillation during Atrial Fibrillation Free Phases of the ECG. Comput. Cardiol. 2007, 34, 801–804.
- Kikillus, N.; Hammer, G.; Wieland, S.; Bolz, A. Algorithm for identifying patients with paroxysmal atrial fibrillation without appearance on the ECG. In Proceedings of the 29th Annual International Conference of the IEEE Engineering in Medicine and Biology Society, Lyon, France, 23–26 August 2007; Volume 1–16, pp. 275–278.
- Langley, P.; Dewhurst, M.; Di Marco, L.Y.; Adams, P.; Dewhurst, F.; Mwita, J.C.; Walker, R.; Murray, A. Accuracy of algorithms for detection of atrial fibrillation from short duration beat interval recordings. Med. Eng. Phys. 2012, 34, 1441–1447.
- Lake, D.E.; Moorman, J.R. Accurate estimation of entropy in very short physiological time series: The problem of atrial fibrillation detection in implanted ventricular devices. Am. J. Physiol. Heart Circ. Physiol. 2011, 300, H319–H325.
- Hargittai, S. Is it Possible to Detect Atrial Fibrillation by Simply using RR Intervals? Comput. Cardiol. 2014, 41, 897–900.
- Lian, J.; Wang, L.; Muessig, D. A Simple Method to Detect Atrial Fibrillation Using RR Intervals. Am. J. Cardiol. 2011, 107, 1494–1497.
- Colloca, R.; Johnson, A.E.W.; Mainardi, L.; Clifford, G.D. A Support Vector Machine Approach for Reliable Detection of Atrial Fibrillation Events. Comput. Cardiol. 2013, 40, 1047–1050.
- Sarkar, S.; Ritscher, D.; Mehra, R. A detector for a chronic implantable atrial tachyarrhythmia monitor. IEEE Trans. Biomed. Eng. 2008, 55, 1219–1224.
- Linker, D.T. Long-Term Monitoring for Detection of Atrial Fibrillation. U.S. Patent 7,630,756, 8 December 2009.
- Mohebbi, M.; Ghassemian, H. Detection of Atrial Fibrillation Episodes Using SVM. In Proceedings of the 30th Annual International Conference of the IEEE Engineering in Medicine and Biology Society, Vancouver, BC, Canada, 20–25 August 2008; Volume 30, pp. 177–180.
- Asl, B.M.; Setarehdan, S.K.; Mohebbi, M. Support vector machine-based arrhythmia classification using reduced features of heart rate variability signal. Artif. Intell. Med. 2008, 44, 51–64.
- Mohebbi, M.; Ghassemian, H. Prediction of paroxysmal atrial fibrillation based on non-linear analysis and spectrum and bispectrum features of the heart rate variability signal. Comput. Methods Programs Biomed. 2012, 105, 40–49.
More
Information
Subjects:
Engineering, Biomedical
Contributors
MDPI registered users' name will be linked to their SciProfiles pages. To register with us, please refer to https://encyclopedia.pub/register
:
View Times:
2.0K
Revisions:
4 times
(View History)
Update Date:
12 Jul 2022
Table of Contents


Notice
You are not a member of the advisory board for this topic. If you want to update advisory board member profile, please contact office@encyclopedia.pub.
OK
Confirm
Only members of the Encyclopedia advisory board for this topic are allowed to note entries. Would you like to become an advisory board member of the Encyclopedia?
Yes
No
${ textCharacter }/${ maxCharacter }
Submit
Cancel
Back
Comments
${ item }
|
${ item.createdUser.fullName }
${ item.createdAt }
${ item.vote }
${ item.reply }
Delete
${ reply.createdUser.fullName }
${ reply.createdAt }
${ reply.vote }
Delete
There is no reply to this comment~
${ item.replyTextCharacter }/${ item.replyMaxCharacter }
Submit
Cancel
More
No more~
There is no comment~
${ textCharacter }/${ maxCharacter }
Submit
Cancel
${ selectedItem.replyTextCharacter }/${ selectedItem.replyMaxCharacter }
Submit
Cancel
Confirm
Are you sure to Delete?
Yes
No