 +1 credit
| Version | Summary | Created by | Modification | Content Size | Created at | Operation |
|---|---|---|---|---|---|---|
| 1 | Sang-Kyung Lee | + 1156 word(s) | 1156 | 2020-09-27 08:01:14 | | | |
| 2 | Catherine Yang | -311 word(s) | 845 | 2020-10-09 10:51:01 | | |
Video Upload Options
To determine the conversion factors for effective dose (ED) per dose length product (DLP) for various computed tomography (CT) protocols based on the 2007 recommendations of the International Commission on Radiological Protection (ICRP). CT dose data from 369 CT scanners and 13,625 patients were collected through a nationwide survey. Data from 3,793 patients with a difference in height within 5% of computational human phantoms were selected to calculate ED and DLP. The anatomical CT scan ranges for 11 scan protocols (adult-10, pediatric-1) were determined by experts, and scan lengths were obtained by matching scan ranges to computational phantoms. ED and DLP were calculated using NCICT program. For each CT protocol, ED/DLP conversion factors were calculated from ED and DLP. Estimated ED conversion factors were 0.00172, 0.00751, 0.00858, 0.01843, 0.01103, 0.02532, 0.01794, 0.02811, 0.02815, 0.02175, 0.00626, 0.00458, 0.00308 and 0.00233 mSv∙mGy-1∙cm-1 for the adult brain, intra-cranial angiography, C-spine, L-spine, neck, chest, abdomen and pelvis, coronary angiography, calcium scoring, aortography, and CT examinations of pediatric brain of <2 years, 4-6 years, 9-11 years, and 13-15 years, respectively. We determined ED conversion factors for 11 CT protocols using CT data obtained from a nationwide survey in Korea and Monte Carlo-based dose calculations.
1. CT Examination Data Acquisition
Data required for the calculation of ED conversion factors were extracted from data collected through a nationwide survey carried out from October 2016 to August 2017 in the Republic of Korea [1]. The survey protocol was selected after conducting a large data analysis of the 2015 National Health Insurance Service Data. The adult CT protocol was the most frequent CT examination. Moreover, the pediatric brain CT protocol was included as pediatric patients are more sensitive to radiation exposure than adult patients. We selected 11 CT protocols for our study, including brain CT, intra-cranial CT angiography, cervical spine CT, lumbar spine CT, neck CT, chest CT, abdomen-pelvis CT, coronary artery CT angiography, coronary artery CT calcium score, CT aortography, and pediatric brain CT. We assumed that the physical characteristics of the patients would be similar to those of the virtual phantoms used for the dosimetry calculator and established the following conditions for extracting patient data from the survey: 1) data of adult patients with heights in the following ranges: 169–187 cm for men and 159–176 cm for women; 2) data of pediatric patients belonging to the four age groups as follows: 0–2, 4–6, 9–11, and 13–15 years. We extracted data for a total of 3793 CT examinations for this study, which included examinations of 1942 adult men, 1107 adult women, and 744 pediatric patients.
2. Calculations of DLP and ED
To calculate the ED received by a patient from a CT examination using the NCICT program, information containing CTDIvol, age, tube voltage, scan range, sex, and type of head/body filter is needed. The scan length required for dose calculations in the NCICT program was set through the anatomical scan range for each CT protocol determined by radiologists. The anatomical scan range was applied to computational human phantoms used in the NCICT program for newborns, individuals aged 0, 1, 5, 10, and 15 years, and adult male and female reference individuals whose organ mass matches the values listed in Publication 89 of the ICRP [2]. We set scan ranges required for the dose calculation. For 10 adult CT protocols, the scan ranges were marked in the computational human phantom picture of a male and a female adult (Figure 1). For pediatric patients in the four age groups, computational human phantoms for ages 1, 5, 10, and 15 years were used, respectively, and the scan lengths for each brain protocol are shown in Figure 2. Based on the scan length set, DLP and ED can be calculated for each patient through the NCICT program. Previously, Christner [3] set the scan length to 13.5, 27.5, 12.5, 26.5, and 45.5 cm for five CT scan protocols (head, chest, coronary, liver, and abdomen-pelvis, respectively) when performing dose calculations using the ImPACT calculator (Company name, Available online: website; accessed on Day Month Year) [4].
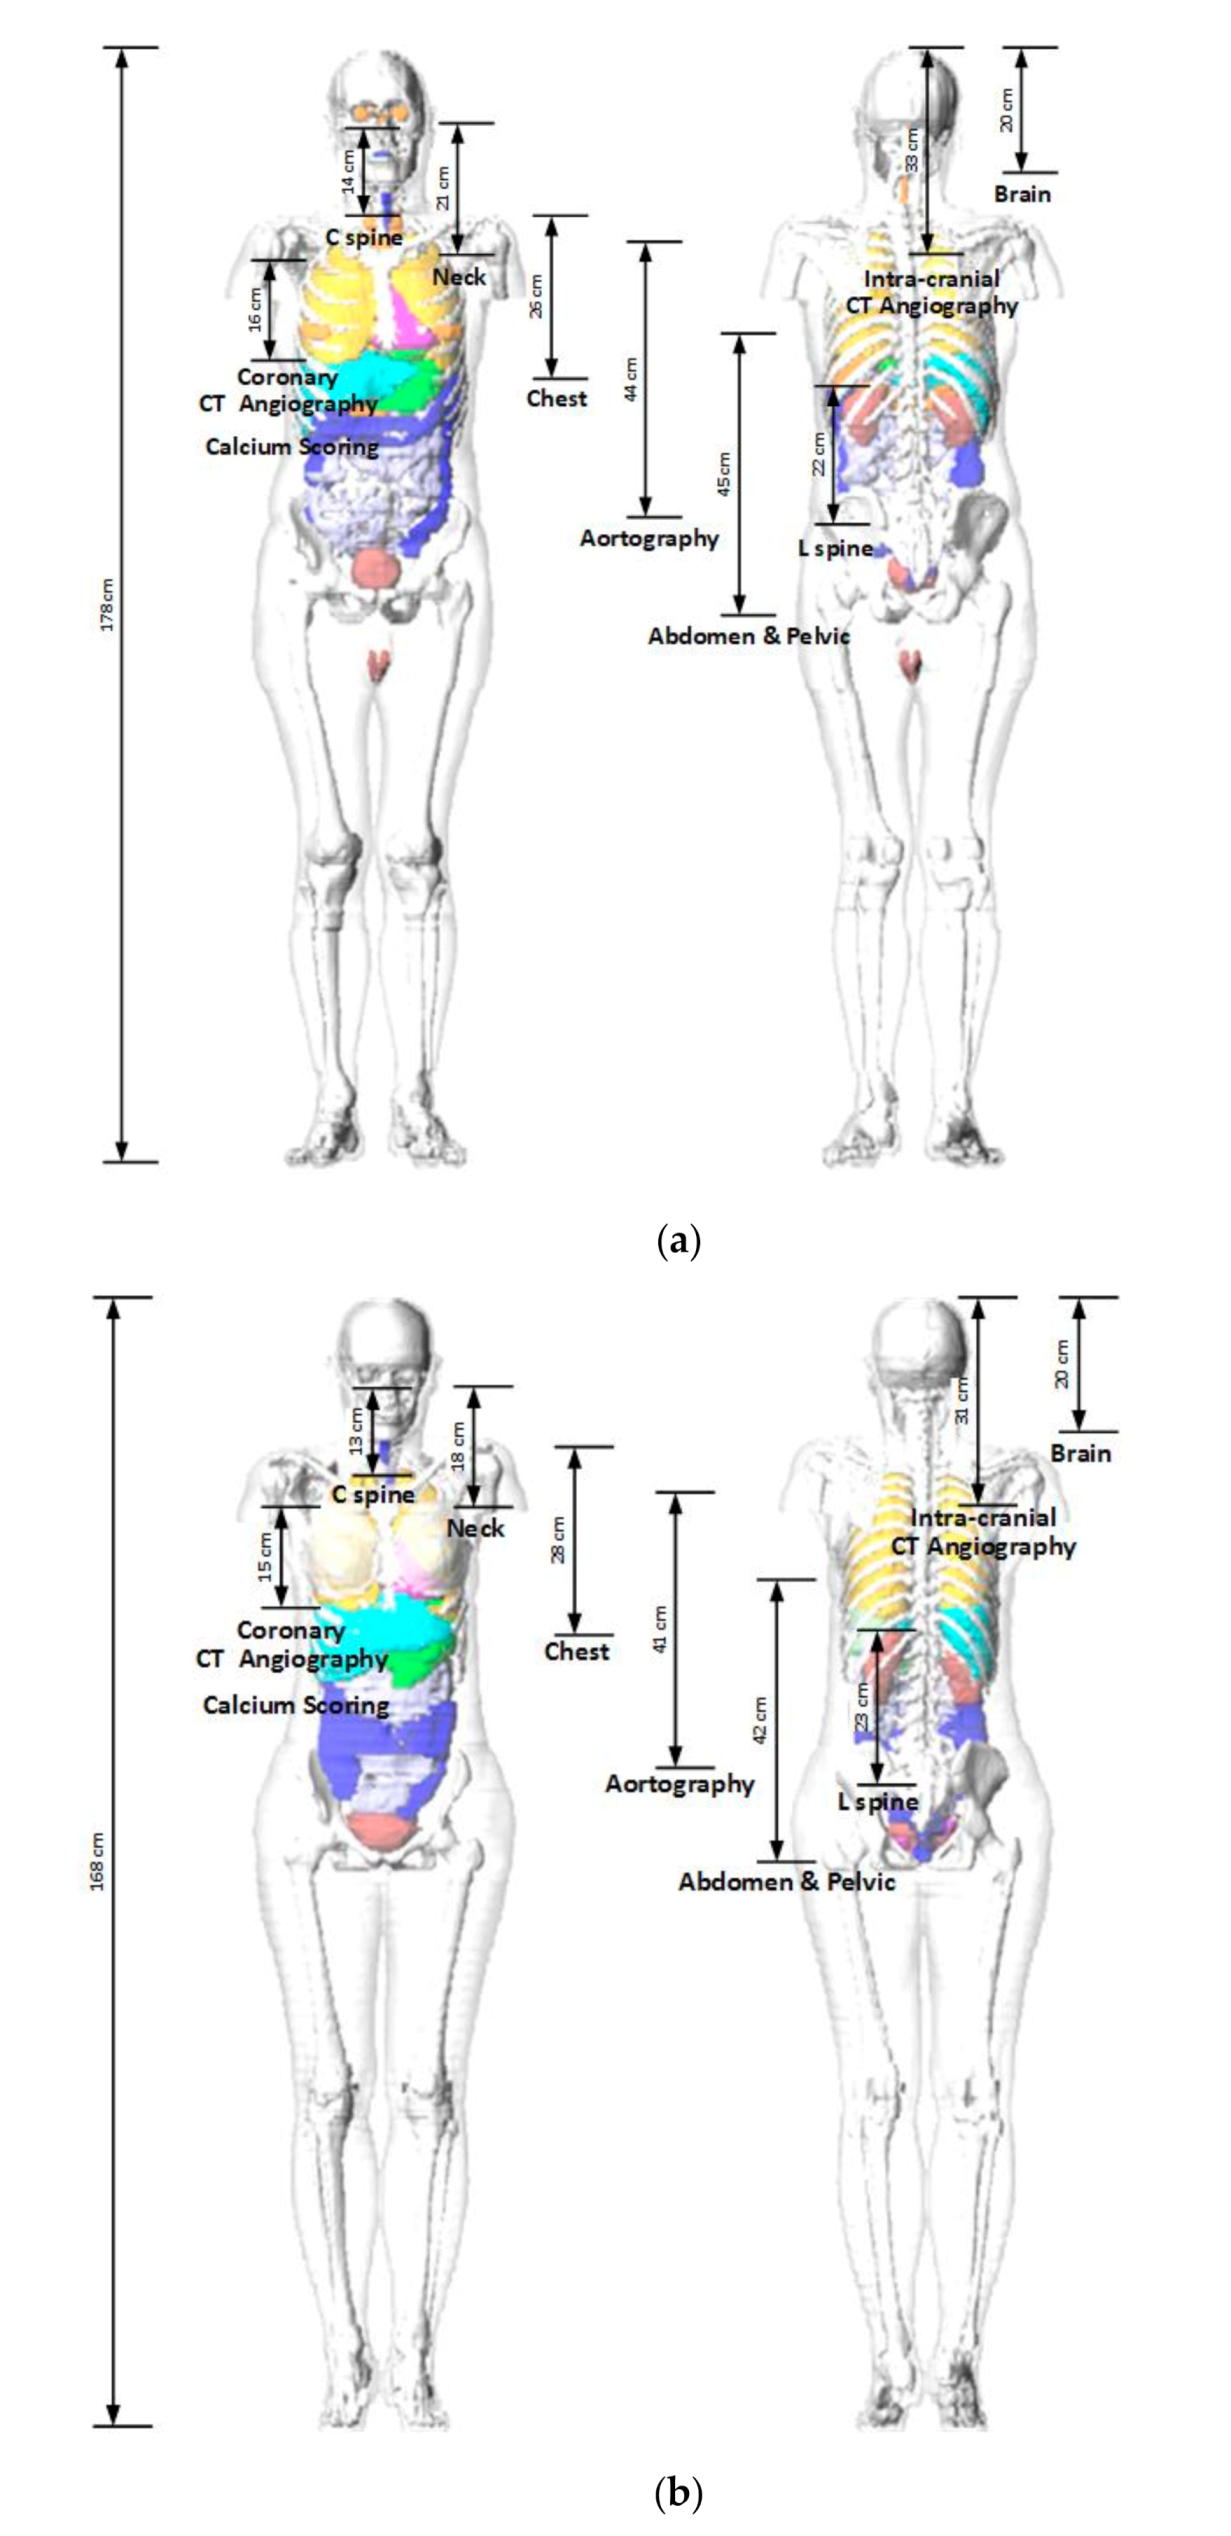
Figure 1. Adult phantoms used in the NCICT dose calculation program. The measurements show the relationship between the scanning ranges of 10 computed tomography examinations and organ positions (Figures of the phantoms were extracted from the NCICT program): (a) male; (b) female.
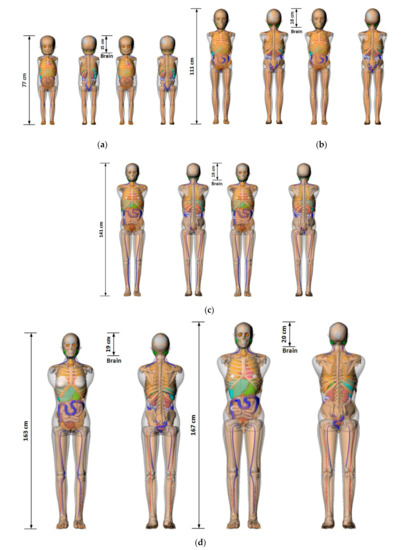
Figure 2. Pediatric phantoms used in the NCICT dose calculation program. The measurements show the relationship between the scanning ranges of 10 computed tomography examinations and organ positions (Figures of the phantoms were extracted from the NCICT program). Images of (a) 1-year-old female (left) and male (right) phantom, (b) 5-year-old female (left) and male (right) phantom, (c) 10-year-old female (left) and male (right) phantom, and (d) 15-year-old female (left) and male (right) phantoms are shown.
3. The estimated ED conversion factor
The estimated ED conversion factors are summarized in Table 1, and the sex-averaged values of the ED conversion factor are as follows: 0.00172, 0.00751, 0.00858, 0.01843, 0.01103, 0.02532, 0.01794, 0.02811, 0.02815, 0.02175, 0.00626, 0.00458, 0.00308, and 0.00233 mSv∙mGy−1∙cm−1 for adult brain, intra-cranial angiography, C-spine, L-spine, neck, chest, abdomen & pelvis, coronary angiography, calcium scoring, aortography, and CT examinations of pediatric brain of <2 years, 4–6 years, 9–11 years, and 13–15 years, respectively.
Table 1. Conversion factors (mSv∙mGy−1∙cm−1) for dose-length product to effective dose.
|
CT Protocols |
Male |
Female |
||
|
Average |
SD |
Average |
SD |
|
|
Brain |
0.0016 |
0.000026 |
0.0020 |
0.000029 |
|
Intra-cranial angiography |
0.0067 |
0.000086 |
0.0084 |
0.000102 |
|
C spine |
0.0073 |
0.000032 |
0.0118 |
0.000028 |
|
L spine |
0.0169 |
0.000082 |
0.0216 |
0.000001 |
|
Neck |
0.0096 |
0.000075 |
0.0133 |
0.000052 |
|
Chest |
0.0243 |
0.000164 |
0.0271 |
0.000143 |
|
Abdomen & pelvis |
0.0155 |
0.000279 |
0.0201 |
0.000275 |
|
Coronary angiography |
0.0267 |
0.000416 |
0.0325 |
0.000369 |
|
Calcium scoring |
0.0268 |
0.000365 |
0.0327 |
0.000287 |
|
Aortography |
0.0209 |
0.000279 |
0.0252 |
0.000283 |
|
Pediatric brain (<2 years) |
0.0062 |
0.000199 |
0.0063 |
0.000229 |
|
Pediatric brain (4–6 years) |
0.0046 |
0.000271 |
0.0045 |
0.000254 |
|
Pediatric brain (9–11 years) |
0.0031 |
0.000151 |
0.0030 |
0.000199 |
|
Pediatric brain (13–15 years) |
0.0024 |
0.000194 |
0.0023 |
0.000185 |
References
- The Korea Center for Disease Control and Prevention. Diagnostic Reference Levels of Computed Tomography: 2nd National Survey; KCDCP: Cheongju, Korea, 2017.
- ICRP Publication 89—Basic Anatomical and Physiological Data for Use in Radiological Protection; Pergamon Press: Oxford, UK, 1991.
- Christner, J.A.; Kofler, J.M.; McCollough, C.H. Estimating effective dose for CT using dose–length product compared with using organ doses: Consequences of adopting International Commission on Radiological Protection Publication 103 or Dual-Energy Scanning. J. Roentgenol. 2010, 194, 881–889.
- ImPACT Group Website. Available online: http://www.impactscan.org (accessed on 20 January 2020).

