Within cell nuclei, several biophysical processes occur in order to allow the correct activities of the genome such as transcription and gene regulation. To quantitatively investigate such processes, polymer physics models have been developed to unveil the molecular mechanisms underlying genome functions. Among these, phase-separation plays a key role since it controls gene activity and shapes chromatin spatial structure. By considering more complex polymer models, it is possible to reproduce the folding of real genomic regions, having specific, intricate contact patterns as seen, e.g., in Hi-C or GAM experiments. To this aim, it is necessary to specialize the polymer model, i.e., the attractive interaction between the polymer and binding molecules, by introducing different types of the polymer sites, each interacting with their specific cognate binders.
1. The α-Globin Locus: Structural Reorganization upon Differentiation
Here, the researchers briefly show a recent application of the SBS model to reconstruct the three-dimensional structure of real genomic loci. The researchers focus on a region centered around the α-globin genes in mouse ESCs and primary erythroid cells
[1], where high-resolution Capture-C data have been employed
[2] to study its 3D organization. These data, which refer to a 300 kb-sized genomic region, highlight drastic architectural rearrangements in the transition from ESCs to erythroid (
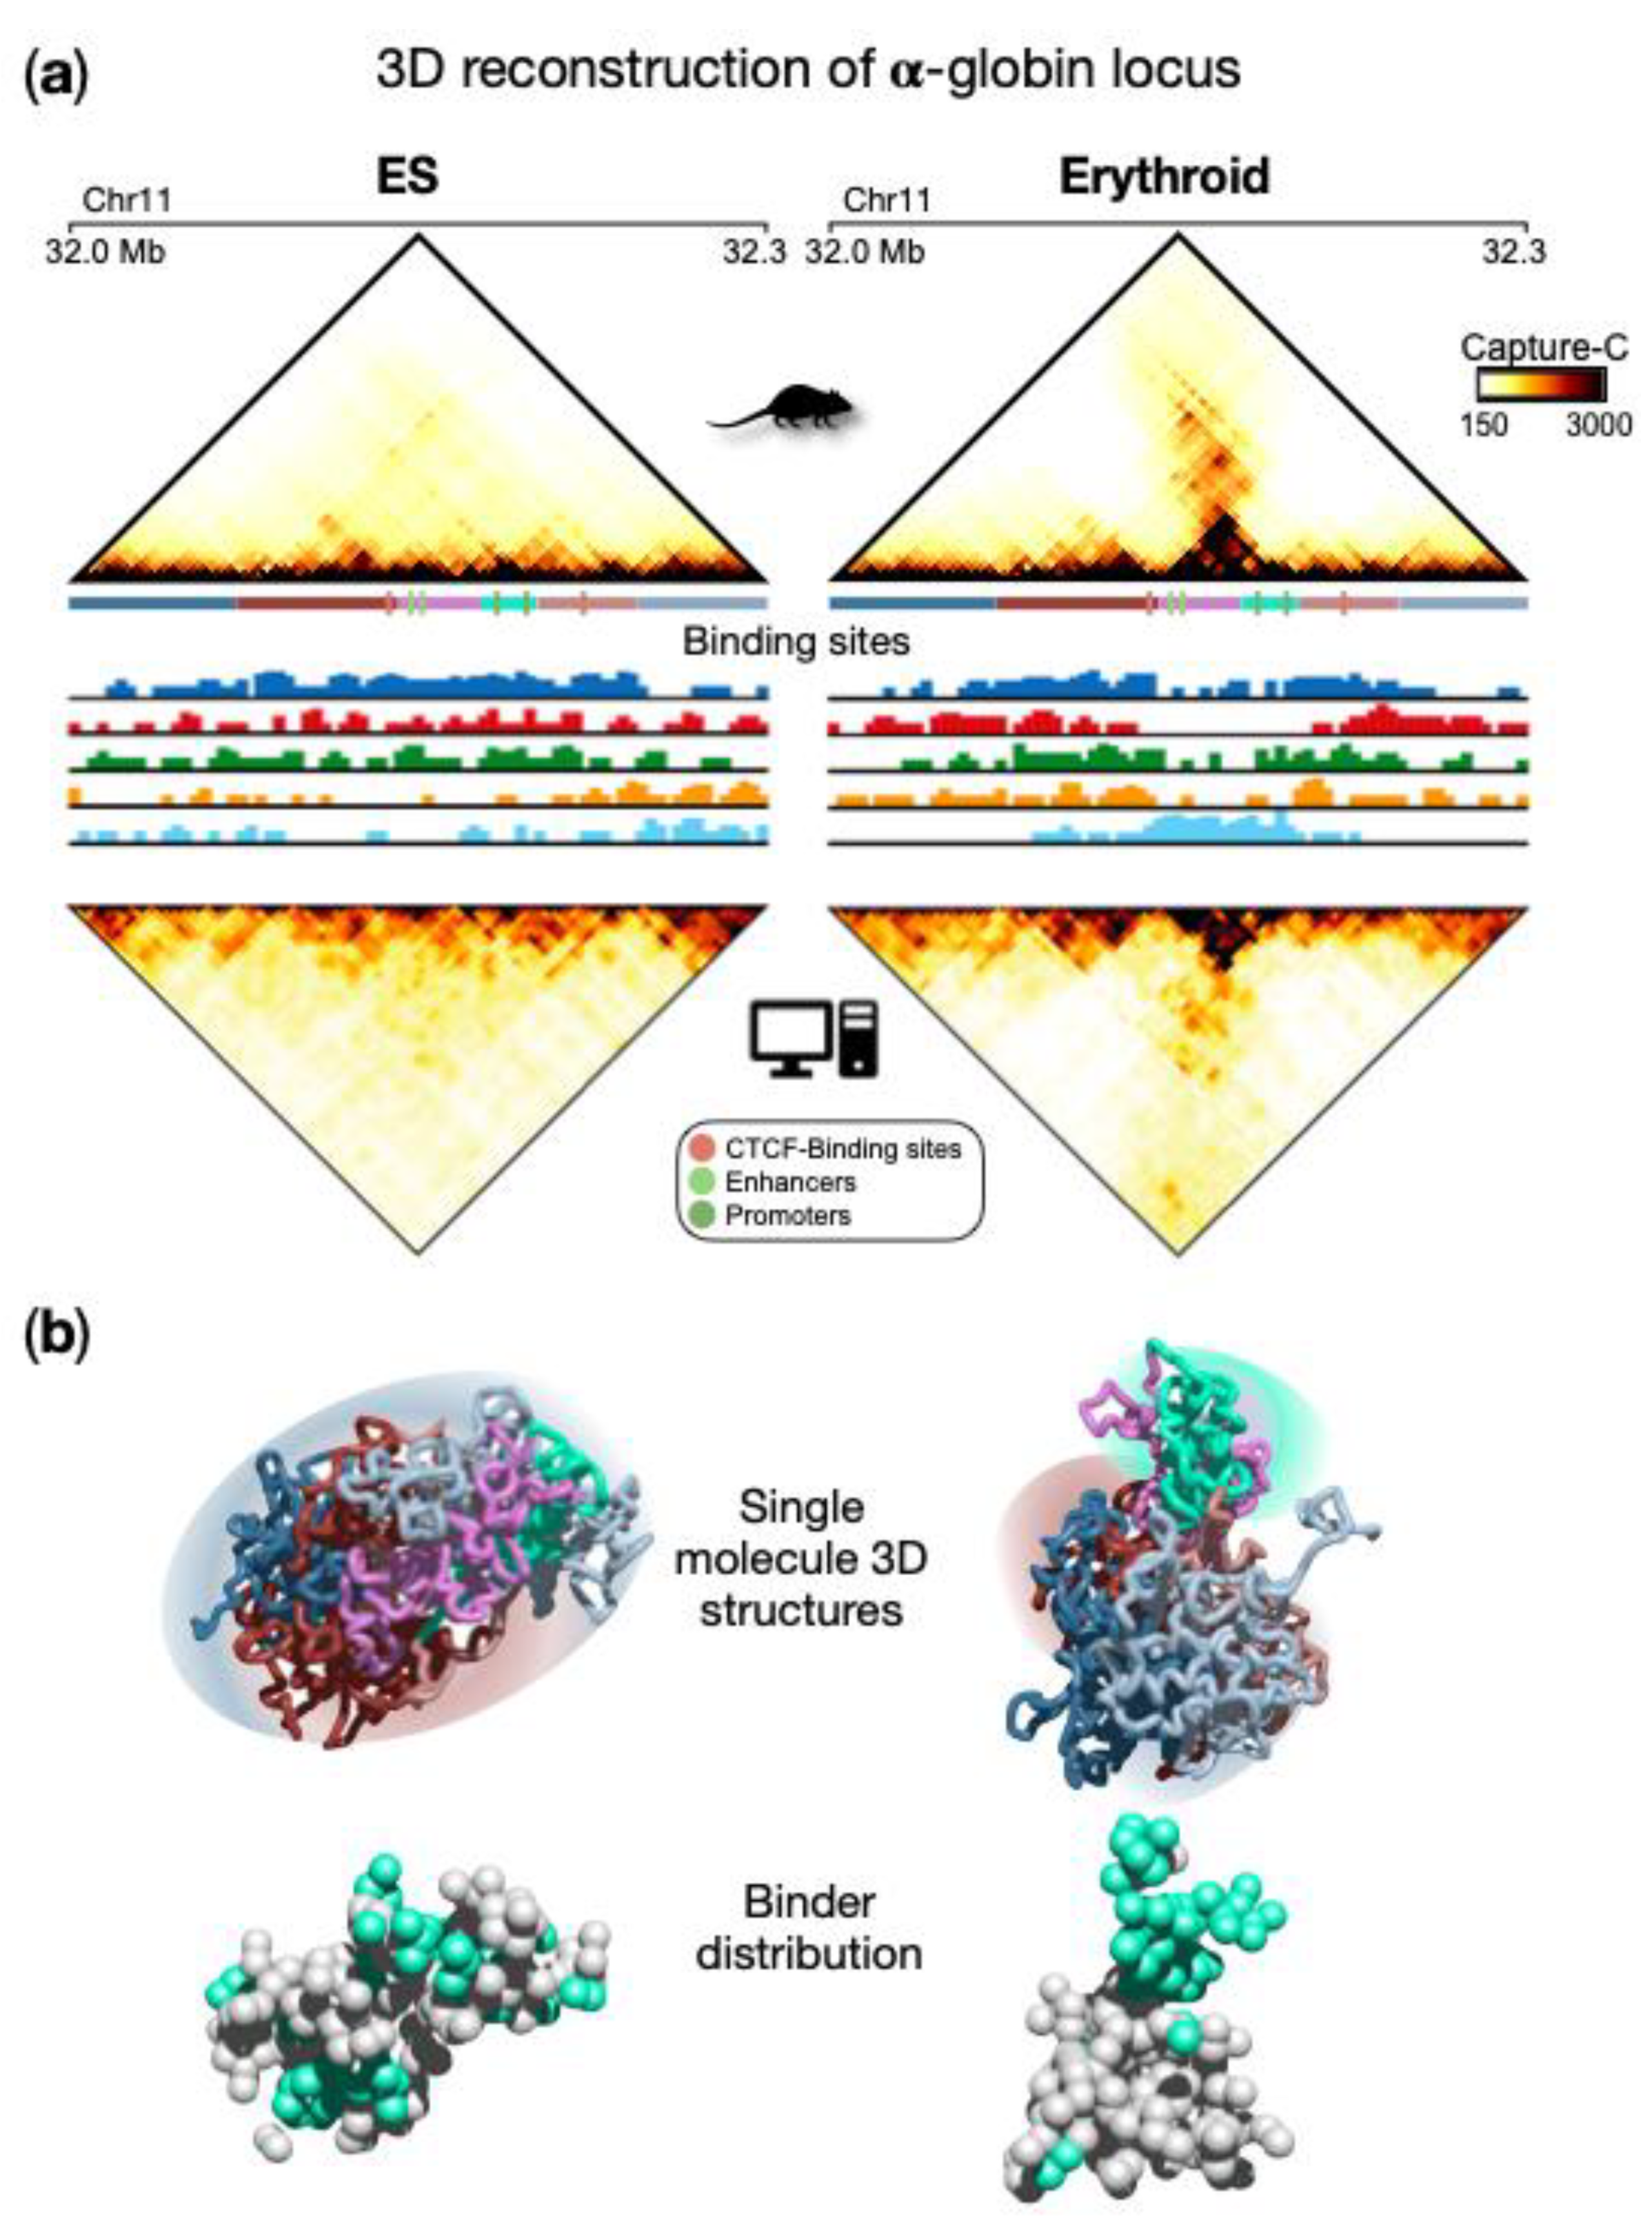
Figure 1a, upper panels). Specifically, in ESCs, contacts are rather homogeneously distributed within the locus in a uniform pattern, and the globin genes are silent. In erythroid cells, a prominent self-interacting domain, containing genes and enhancers, is visible and extends in the matrix along the opposite diagonal. This structure is functional to the activation of the globin genes in erythroid cells
[1][2]. By applying the PRISMR procedure to the Capture-C data, SBS polymer models were inferred for both ESCs and erythroid cells (
Figure 1a). Interestingly, the inferred different types of binding sites were found to correlate with specific combinations rather than single chromatin marks
[1]. By running MD simulations of the obtained polymer models (see
[1] for technical details), a set of 3D single-molecule conformations were produced and accurately recapitulate the contact data of this locus in both cell types (
Figure 1a lower panels). The comparison between Capture-C and simulated contact maps (
Figure 1a) shows that most of the experimental patterns were well reproduced by the SBS model, as also highlighted by high Pearson correlation coefficients (Pearson r = 0.96 in both ESCs and erythroid). This is an indication that the model 3D structures could represent the real architecture of the region to a good extent and support a principled interpretation of the observed contact patterns based on polymer physics. For example, TADs can be interpreted as regions enriched for contacts between specific types of binding sites, which biologically correspond to specific combinations of chromatin marks. More specifically, from a quantitative analysis of the obtained conformations
[1], two different types of topologies emerge for ESC and erythroid cells, as also highlighted by single molecule snapshots (
Figure 1b). In ESCs, a rather uniform structure is visible with high intermingling among different parts of the locus, while in erythroid structures, more discrete interaction domains appear and are poorly intermingled, consistent with Capture-C data. It is important to note that such structural properties predicted by the model emerge from the interactions between the binding sites of the polymer and the binders, whose distribution is shown in
Figure 1b. This eventually leads to the micro-phase separated clusters of binders associated with the interaction domain observed in erythroid cells, but not in ESCs (
Figure 1b). Beyond the interactions producing the pairwise contacts observed in this locus, such a mechanism allows the formation of high-multiplicity regulatory contacts between genes and enhancers, as discussed in the next section.
Figure 1. Polymer physics highlights regulatory linked conformations driven by micro-phase separation in α-globin locus. (
a) Upper panels: Capture-C contact data of the genomic region centered on the α-globin genes show a drastic change in the 3D organization of the locus in ESCs with respect to erythroid cells, where a strong stripe of interaction emerges. Bottom panels: contact data obtained from the ensemble of 3D conformations from Molecular Dynamics simulations of the SBS model; (
b) Examples of single-molecule 3D structures in the two cell types highlight chromatin conformational tissue-specificity: in ESCs, a large uniform domain with no preferential contact is observed, while in erythroid, evident domains form, one containing the globin genes and enhancers. Binder distributions are shown below the polymer structure, binders associated with genes and enhancer are colored in cyan. Image adapted from
[1].
2. Micro Phase-Separation Leads to High-Multiplicity Regulatory Contacts at the α-Globin Locus
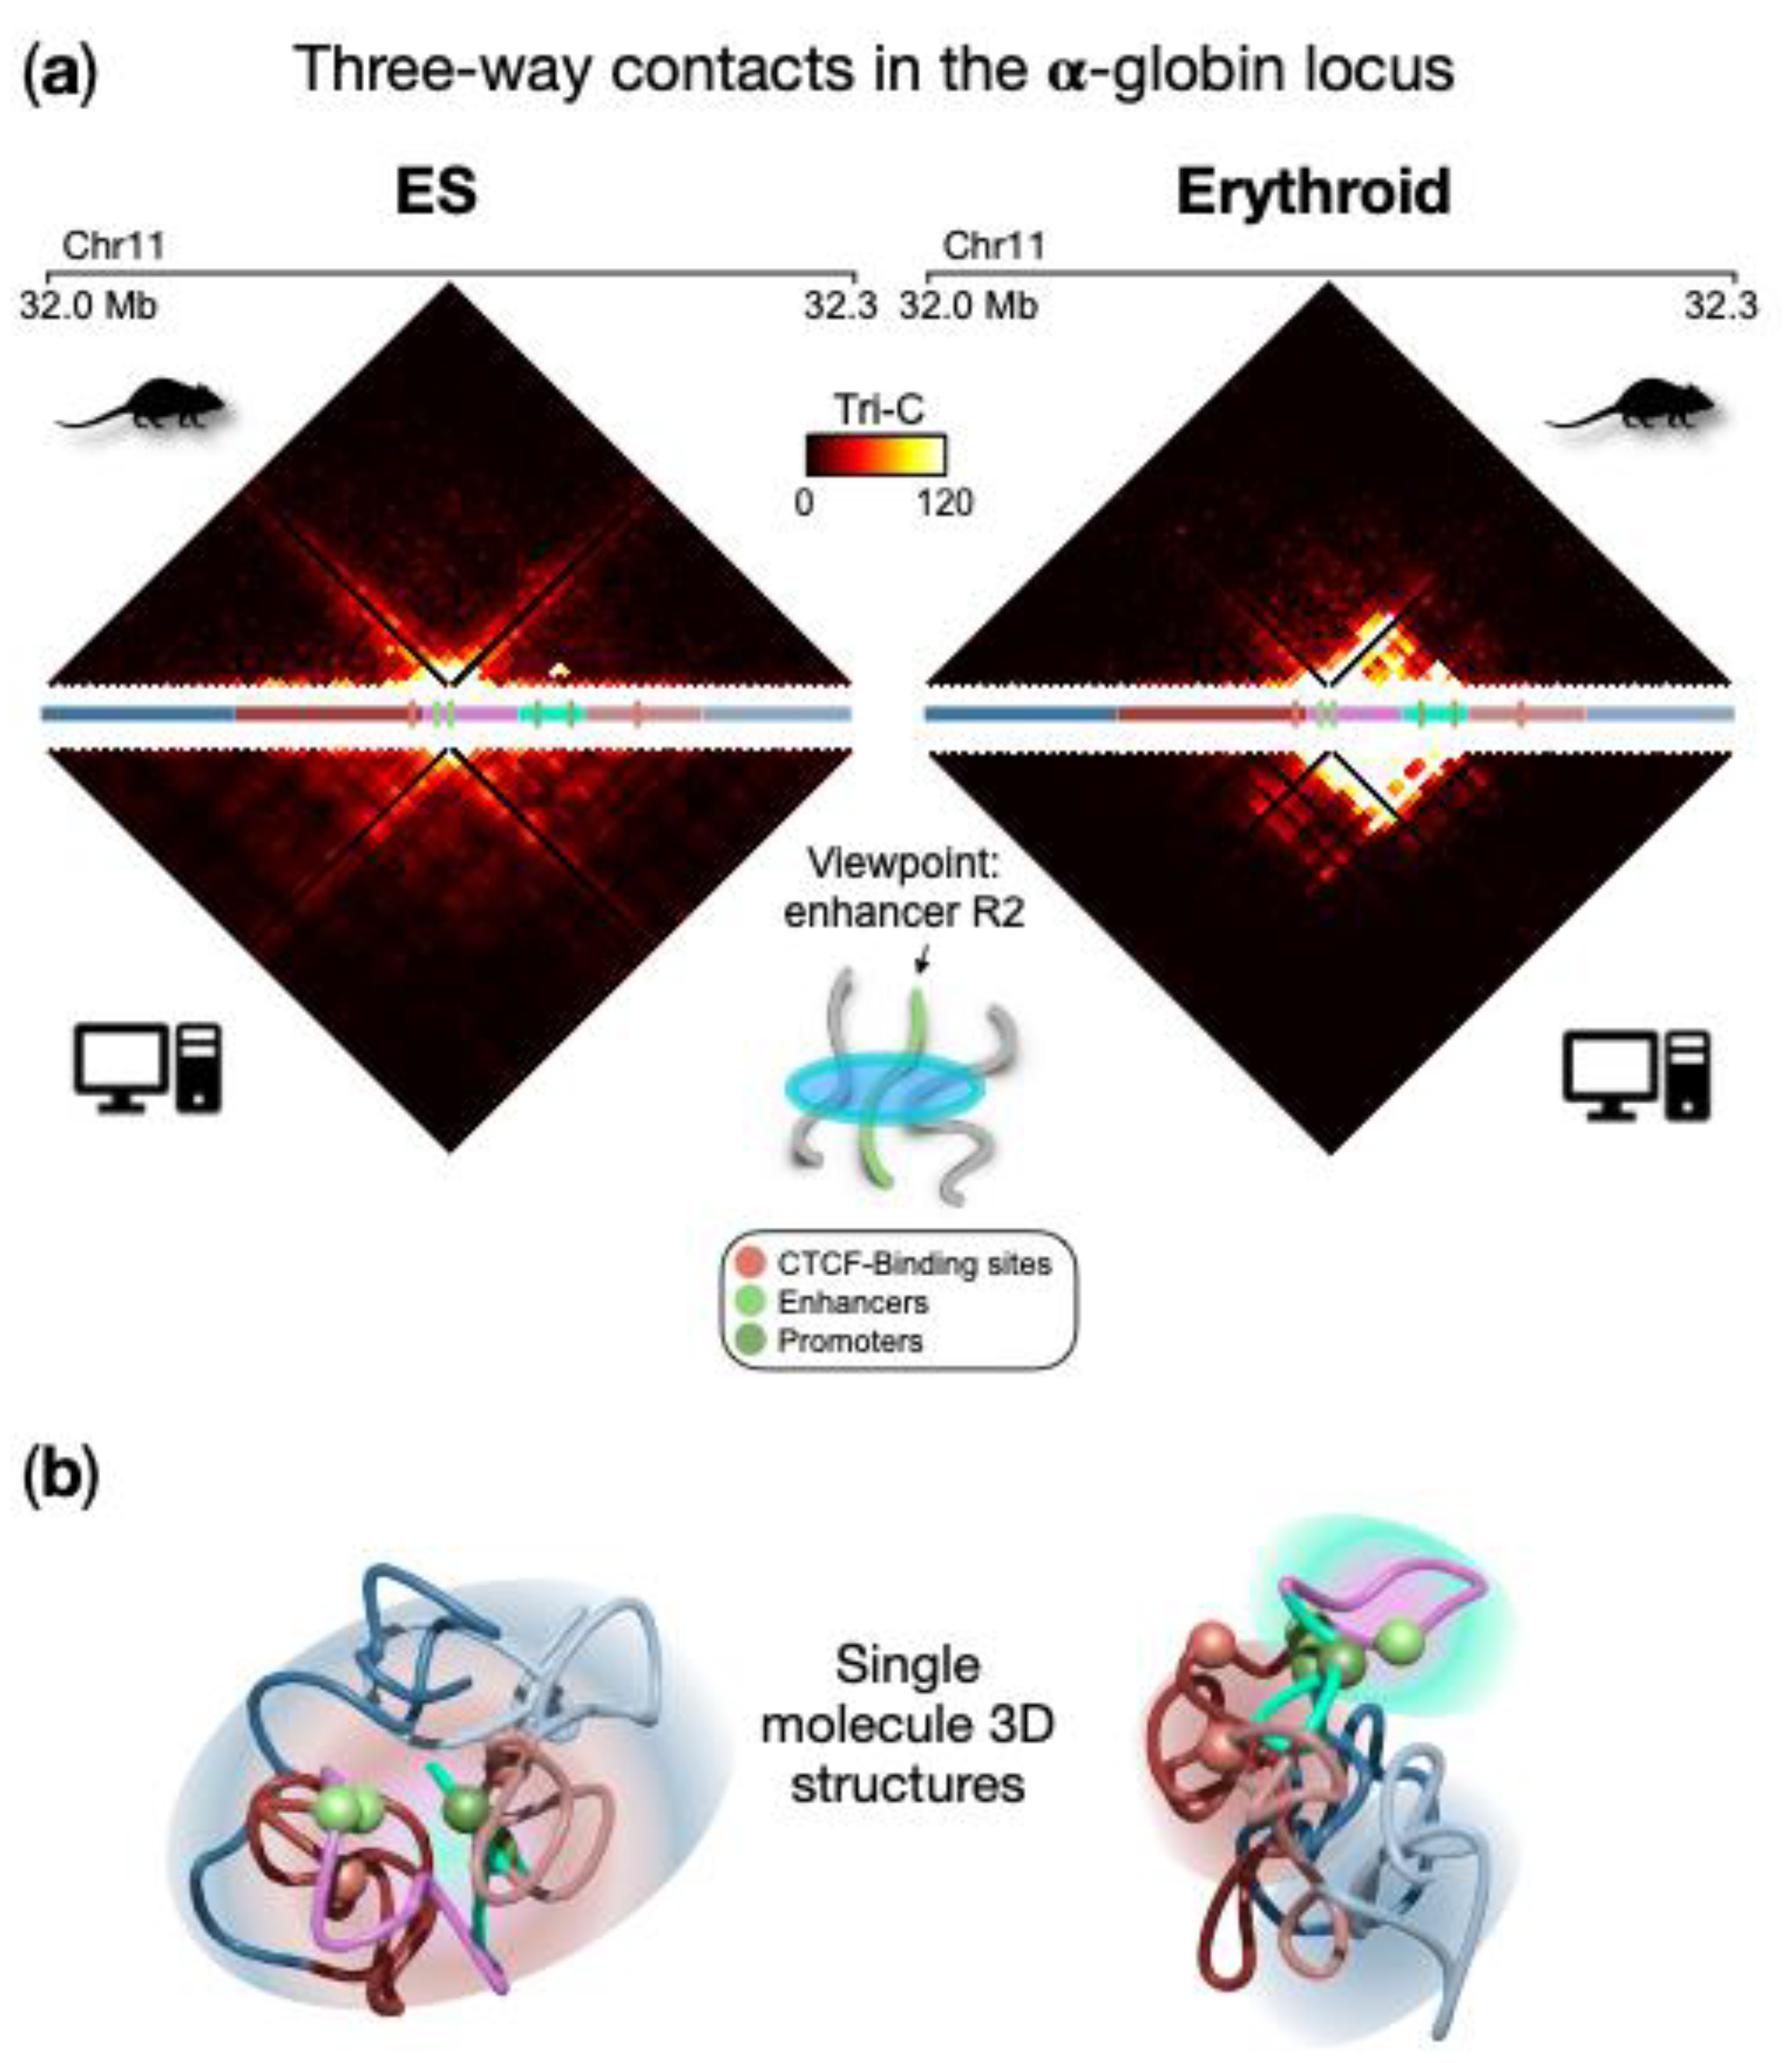
An important aspect of the discussed approach is that the researchers can extract more general, quantitative information about the specific architecture from the ensemble of 3D structures, beyond the simple pairwise contact probability. A natural extension is represented by multi-way contacts, i.e., contacts among more than two loci (e.g., triplet if three loci, quartets if four loci, etc.). Here, the researchers focus on the three-way contacts (triplets) of regulatory sites (genes and enhancers) that have been predicted from the polymer model and compared with experimental data obtained with the recently developed Tri-C technique
[2]. Without loss of generality, the researchers consider as a point of view the strongest enhancer (named R2) for the α-globin genes and calculate the probability of a triplet with any other pair of loci within the locus, in ESCs and erythroid cells. As shown in
Figure 2a (upper panels), the two cell lines exhibit different features. Indeed, in ESCs there is no specific three-way interaction pattern, in agreement with its 3D architecture where the polymer is highly intermingled and only proximity effects dominate. Conversely, in erythroid, a non-random pattern of triplet contacts emerges, with a high probability of multi-way contacts localized in the region spanning the enhancers and the globin genes. Interestingly, this is compatible with the hairpin structure proposed as a description for this locus in erythroid cells
[1] and driven by the polymer-binders phase-separation mechanism the researchers previously discussed. In this structure, the region containing genes and enhancers spatially segregates and weakly intermingles with its flanking regions, which in turn tend to be more intermingled and in close spatial proximity. As the validation of these results, the prediction of three-way contact probability was compared with independent experimental data generated by the Tri-C method (
Figure 2 bottom panels), which measures the probability of a triplet for a fixed point of view. Good agreement between the model and experimental data confirms the validity of the prediction for enhancer R2, also highlighted by the high correlation coefficient (Pearson r = 0.8 in both ESCs and erythroid cells
[1]). An analogous agreement is obtained by considering as a point of view a CTCF site located upstream the gene region (average correlation coefficient r = 0.8). Single snapshot 3D conformations obtained from real Molecular Dynamics simulations highlight such higher-order contacts and are helpful to visually capture the above-described structural features in ESCs and erythroid (
Figure 2b).
Figure 2. High-multiplicity regulatory contacts at the α-globin locus. (
a) Three-way contact probability from the ensemble of polymer conformations in ESCs and erythroid (upper panel) and from the TriC
[2] experimental method (bottom panels), with the enhancer R2 as a point of view; (
b) Example of a single molecule 3D structure obtained from Molecular Dynamics simulations highlights the structural features in ESCs and erythroid cells. Spheres indicate the positions of relevant regulatory elements. Image adapted from
[1].
It is important to note that the ensemble of 3D conformations is only derived from pairwise experimental matrices and the probability of such triplets is computed purely from the geometric coordinates in the simulated 3D structures. Therefore, this kind of analysis is general and can be applied to other loci for which a population of three-dimensional structures has been inferred, as shown in the following section. Furthermore, the method can be used to calculate higher-order contacts involving more than three objects
[3].
3. High-Multiplicity Regulatory Contacts at the HoxD Locus
Here, the researchers illustrate the modeling of a region around the murine HoxD genes clusters, which is involved in the formation of animal body structures during embryo development
[4][5][6]. Two cell types, ESCs and cortical neurons (CNs), were considered in order to explore the architectural changes occurring when the HoxD genes change from a poised to a silent transcription state
[4]. To infer polymer models for this region, PRISMR was applied to high-resolution (5 kb) Hi-C data
[7] (
Figure 3a) and ensembles of 3D conformations were obtained by MD simulations. In
Figure 3a, example snapshots from the model 3D structures are shown in ESCs and CNs cells, with the positions of key genes and regulatory regions highlighted. Interestingly, however, the 3D models show a strong structural variability in both ESCs and CNs. This is highlighted, e.g., by the standard deviation to the average ratio of the distance between HoxD1 and HoxD13 (the rightmost and leftmost gene in the cluster, respectively), which is approximately 30%. At the same time, there is high cell-type specificity in the 3D structure, as, e.g., the HoxD13 and HoxD1 genes are found approximately 50% further in CNs, showing that the poised HoxD cluster in ESCs is more compact than in CNs. As before, the corresponding average pairwise contact matrices from the 3D models well reproduce the Hi-C contact pattern correlations (see
[4] for details). Beyond pairwise contacts, the model has the ability to predict further structural features such as the formation of high-multiplicity, many-body contacts, information that can be easily derived from reconstructed 3D ensembles. In this way, abundant triple contacts were discovered, involving promoters and regulatory regions that are highly gene and cell-type specific (
Figure 3b,c). As an example, in
Figure 3b, the triplets formed by Hoxd13 gene with the rest of the locus are shown, while in
Figure 3c, the triplets from the Hoxd1 viewpoint are shown. Importantly, in ESCs, independent 3-way 4C data are available
[8] that have been used to validate the model predictions of triplet contacts from several viewpoints
[4]. Interestingly, the model-derived triple contact probability from the different viewpoints has a gene- and cell-type-specific compartmentalized structure. The triplets formed by HoxD13, for example, are mostly restricted within the TAD downstream the HoxD cluster, in both ESCs and CNs. On the contrary, the triplets formed by HoxD1 are mainly within the downstream TAD in both cell types. Additionally, gene-specific subsets of triplets are formed by genes and their regulatory regions
[4]. This indicates that such combinations of higher-multiplicity interactions are highly selective and suggest that they can be the mode of action whereby the 3D conformation differentially regulates the genes. Taken together, the polymer modeling results helped to shed light on the organization of the murine HoxD region, which is characterized by a network of cell-type and gene-specific many-body contacts with regulatory elements and undergoes deep reorganization upon differentiation from ESCs to CN cells in parallel with the changes in the activity of the genes.
Figure 3. Polymer physics highlights high-multiplicity regulatory contacts at the HoxD locus. (
a) High-resolution Hi-C data
[7] of the HoxD genomic region and model derived single-molecule 3D conformations in ES (
left) and CN (
right) cells help visualize the locus structure with its two flanking TADs in the two cell types. (
b,
c) Model predicted triple contact frequency form the viewpoint of HoxD13 (
b) and HoxD1 (
c) have a gene and cell-type-specific organization. Image adapted from
[4].
 +1 credit