Submitted Successfully!
To reward your contribution, here is a gift for you: A free trial for our video production service.
Thank you for your contribution! You can also upload a video entry or images related to this topic.
Version Summary Created by Modification Content Size Created at Operation
1 -- 3251 2022-04-30 17:39:37 |
2 Reference format revised. + 43 word(s) 3294 2022-05-05 09:32:46 |

Video Upload Options

Do you have a full video?

Confirm

Are you sure to Delete?
Cite
If you have any further questions, please contact Encyclopedia Editorial Office.
Gomes, L.; , .; Mergulhão, F.J. A Practical Teaching Course of Protein Engineering. Encyclopedia. Available online: https://encyclopedia.pub/entry/22538 (accessed on 03 May 2024).
Gomes L,  , Mergulhão FJ. A Practical Teaching Course of Protein Engineering. Encyclopedia. Available at: https://encyclopedia.pub/entry/22538. Accessed May 03, 2024.
Gomes, Luciana, , Filipe José Mergulhão. "A Practical Teaching Course of Protein Engineering" Encyclopedia, https://encyclopedia.pub/entry/22538 (accessed May 03, 2024).
Gomes, L., , ., & Mergulhão, F.J. (2022, April 30). A Practical Teaching Course of Protein Engineering. In Encyclopedia. https://encyclopedia.pub/entry/22538
Gomes, Luciana, et al. "A Practical Teaching Course of Protein Engineering." Encyclopedia. Web. 30 April, 2022.
A Practical Teaching Course of Protein Engineering
Edit

Proteins are the workhorses of the cell. With different combinations of the 20 common amino acids and some modifications of these amino acids, proteins have evolved with a staggering array of new functions and capabilities due to Protein Engineering techniques. The practical course presented was offered to undergraduate bioengineering and chemical students at the Faculty of Engineering of the University of Porto (Portugal) and consists of sequential laboratory sessions to learn the basic skills related to the expression and purification of recombinant proteins in bacterial hosts. These experiments were successfully applied by students as all working groups were able to isolate a model recombinant protein (the enhanced green fluorescent protein, eGFP) from a cell lysate containing a mixture of proteins and other biomolecules produced by an Escherichia coli strain and evaluate the performance of the extraction and purification procedures they learned.

recombinant protein plasmid green fluorescent protein protein purification course

1. Introduction

The engineering of proteins represents a modern and powerful approach to generating novel proteins for applications in different fields such as biocatalysts, therapeutic agents, and biosensors [1]. Therefore, knowledge of the basic skills of Protein Engineering is mandatory for future bioengineers and chemical engineers specialized in Biotechnology.
Green fluorescent protein (GFP) is a small protein of about 27 kDa consisting of 238 amino acids (aa) derived from the jellyfish Aequorea victoria [2]. It is intrinsically fluorescent, emitting a brilliant green light when exposed to ultraviolet or blue light, due to a chromophore formed from a maturation reaction of three specific aa at the center of the protein (Ser65, Tyr66, and Gly67) [3][4].
GFP-like proteins are widely used as quantitative genetically encoded markers for studying protein-protein interactions and cell tracking [5][6]. One of the most interesting aspects of GFP over other fluorescent tags is that the chromophore forms spontaneously and without accessory co-factors, substrates, or enzymes; it only requires the presence of oxygen during maturation [7], which means that the gene could be taken directly from A. victoria and expressed in other organisms as the Gram-negative bacterium Escherichia coli while still maintaining fluorescence.
The heterologous expression of GFP is a particularly interesting system for didactic purposes since it can be easily observed during laboratory classes. To this end, scholars previously cloned the eGFP gene fused to histidine (His) tags in the pET28a vector 
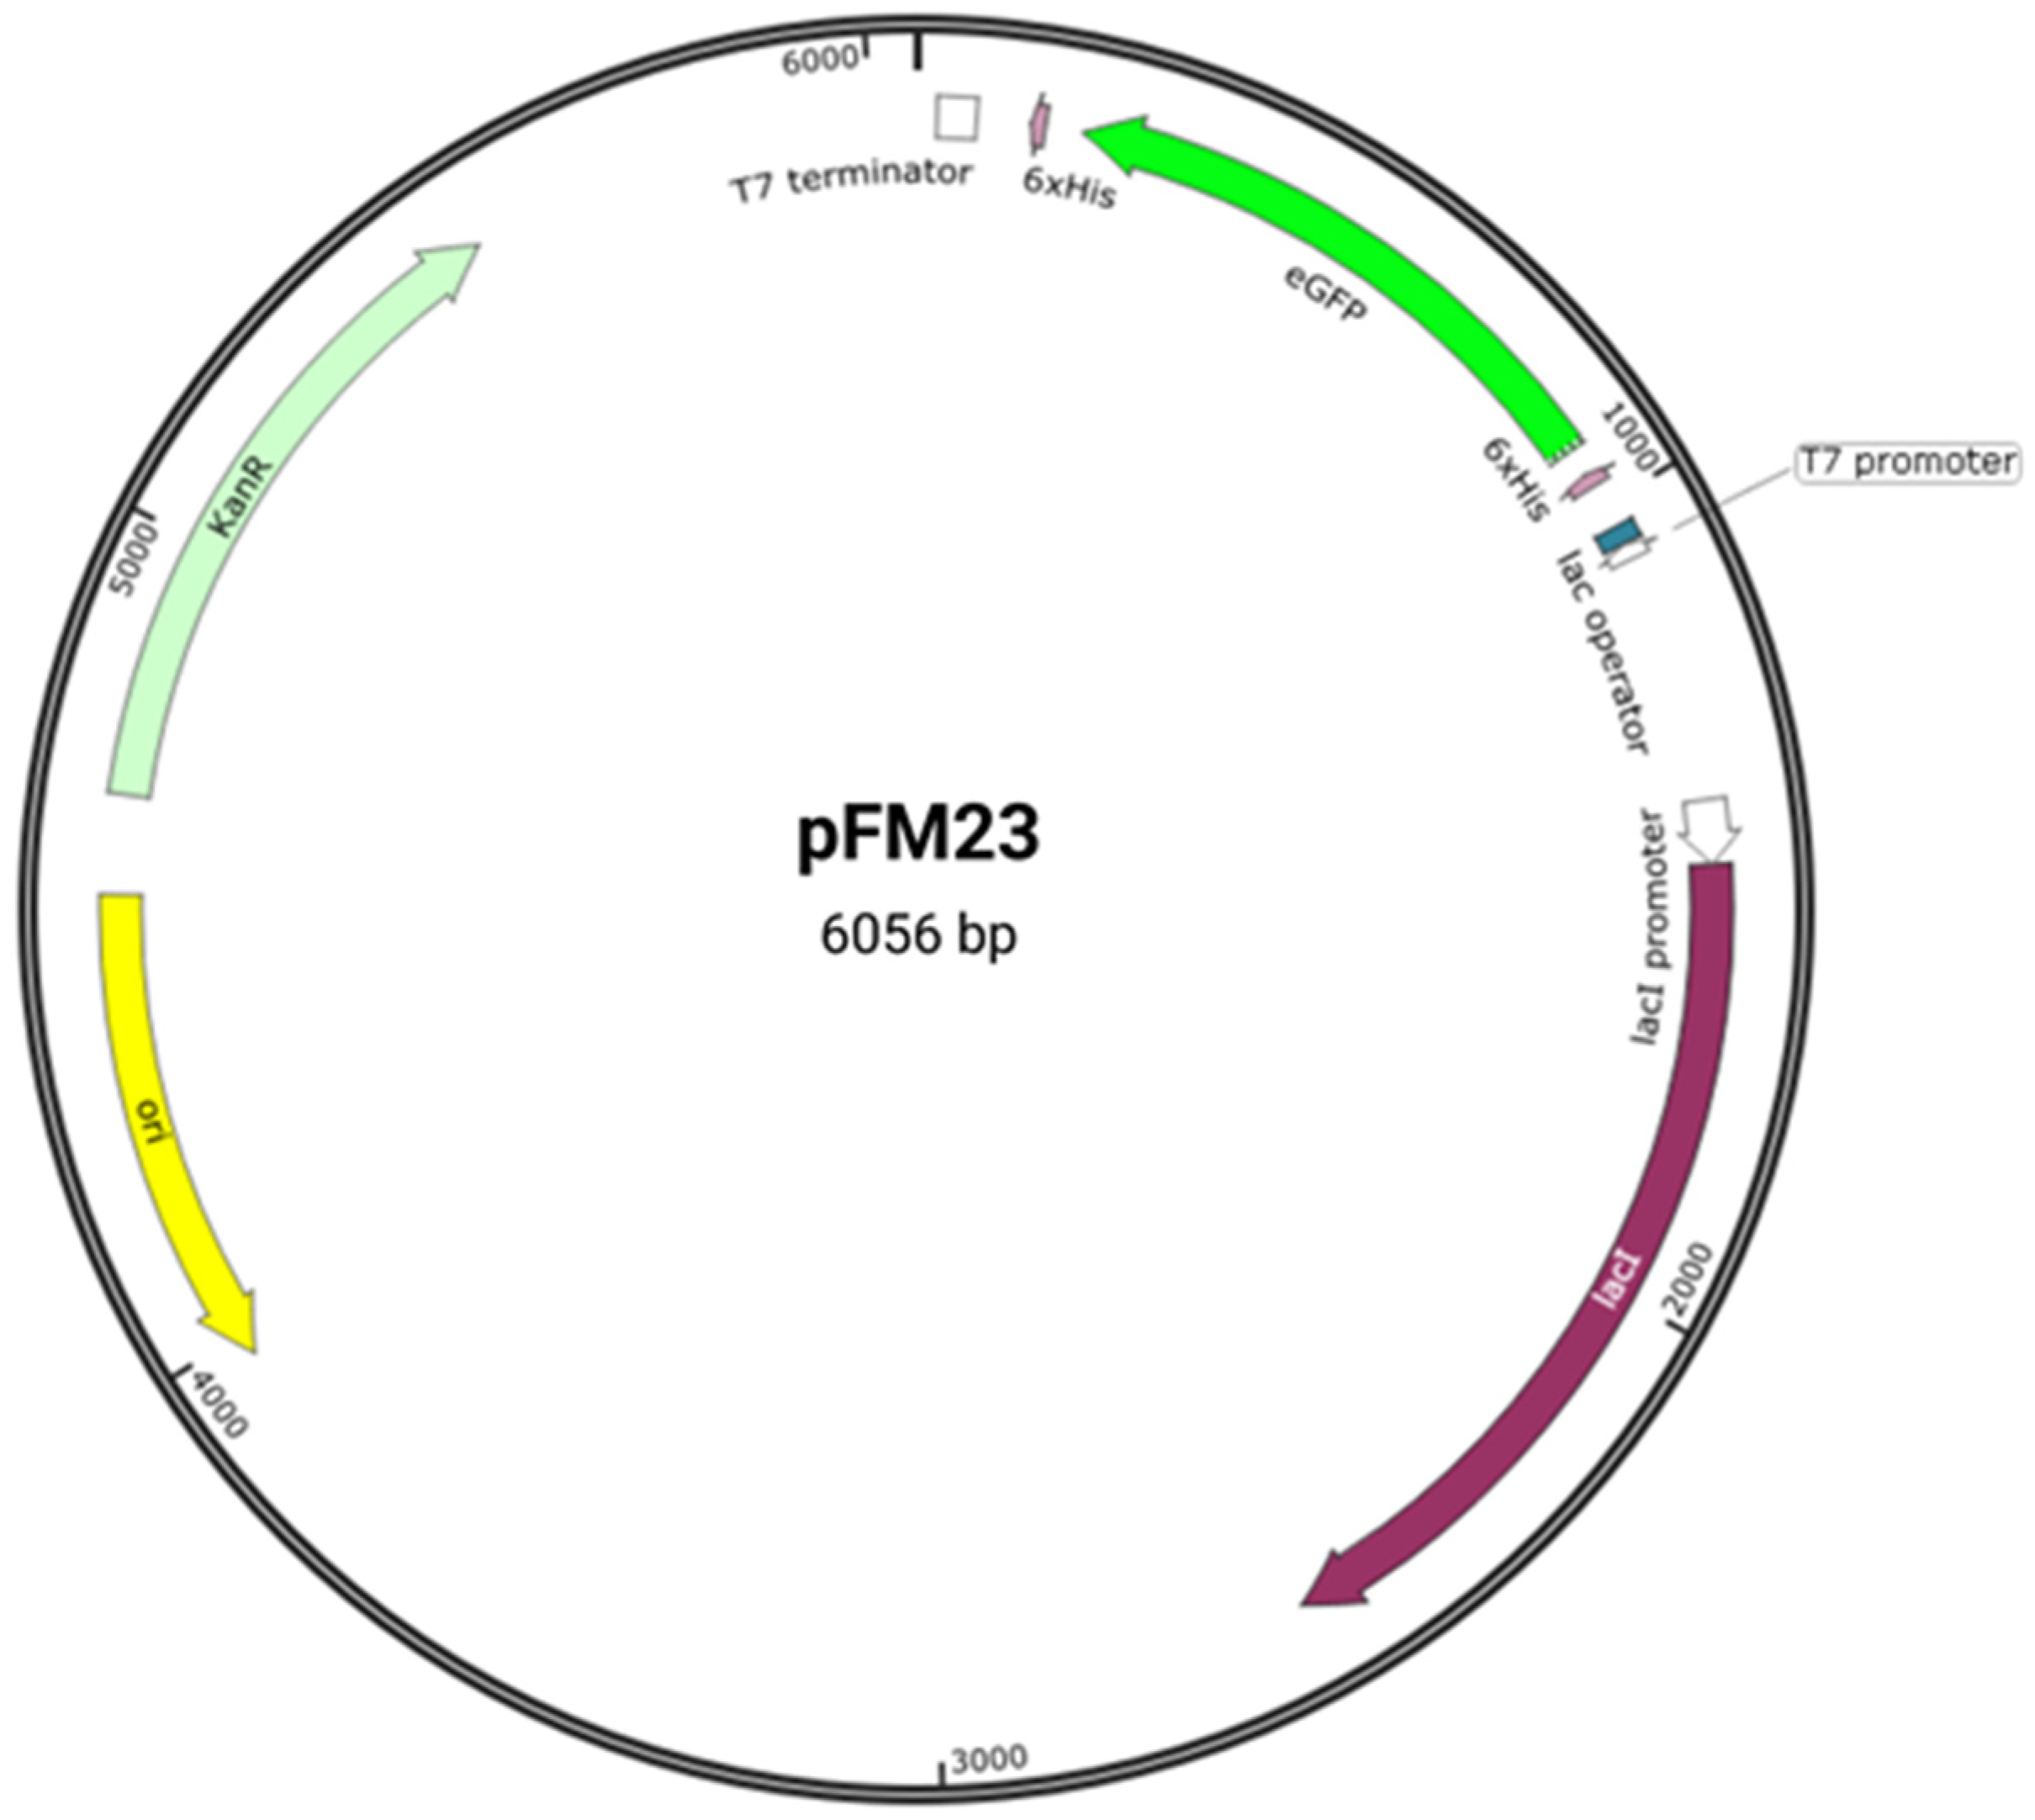
[8], generating plasmid pFM23 (Figure 1). Plasmid pFM23 for cytoplasmic production of eGFP-His6 was constructed by digestion of plasmid pFM20 (expressing ZZ-GFP) with the NdeI/BamHI restriction enzymes and cloning of the eGFP gene into pET28A [8]. For insertion into plasmid pFM20, the eGFP coding sequence had previously been amplified from plasmid pEGFP-N1 [8]. Expression using a pET-based vector such as pET28a provides larger amounts of the target protein than other simplified systems. For this system, E. coli host cells engineered to carry the gene encoding T7 RNA polymerase downstream of the lac promoter are required. These cells are transformed with a plasmid that includes a copy of the T7 promoter and, adjacent to it, the gene to be expressed.
Figure 1. Plasmid pFM23 map. This harbours (i) a pMB1 origin of replication (ori), (ii) a repressor for the lac promoter (lacI), (iii) a transcriptional promoter from the T7 phage (T7 promoter), (iv) a lactose operator (lac operator), (v) an affinity purification tag (6 × His), (vi) a T7 transcriptional terminator (T7 terminator), (vii) a kanamycin resistance gene (KanR), and (viii) the eGFP gene (eGFP).
When IPTG, a lactose analog, is added to the culture medium, T7 RNA polymerase is expressed by transcription from the lac promoter [9]. The enzyme recognizes the T7 promoter on the plasmid and catalyzes the transcription of the gene of interest. T7 RNA polymerase is so selective and active that almost all of the cell resources are directed to recombinant protein expression [10]. The bacterium E. coli is a preferred host for the production of recombinant proteins [11][12] due to its fast growth at high cell densities, minimal nutrient requirements, well-known genetics, and availability of a large number of cloning vectors and mutant host strains [13]. This bacterium can accumulate many recombinant proteins to at least 20% of the total cell protein content [14] and translocate them from the cytoplasm to the periplasm [15]. Despite all these advantages, the expression of recombinant proteins using E. coli as host often results in the formation of insoluble protein aggregates called inclusion bodies [11][16]. Inclusion bodies are usually formed in the cytoplasm, and several methods have been described for the redirection of proteins from inclusion bodies into the soluble cytoplasmic fraction of cells [17]. Overall, they can be divided into procedures where protein is refolded from inclusion bodies and procedures where the expression strategy is modified to obtain soluble proteins by lowering the expression levels. For instance, this can be achieved by balancing the promoter strength and gene copy number [15][18].
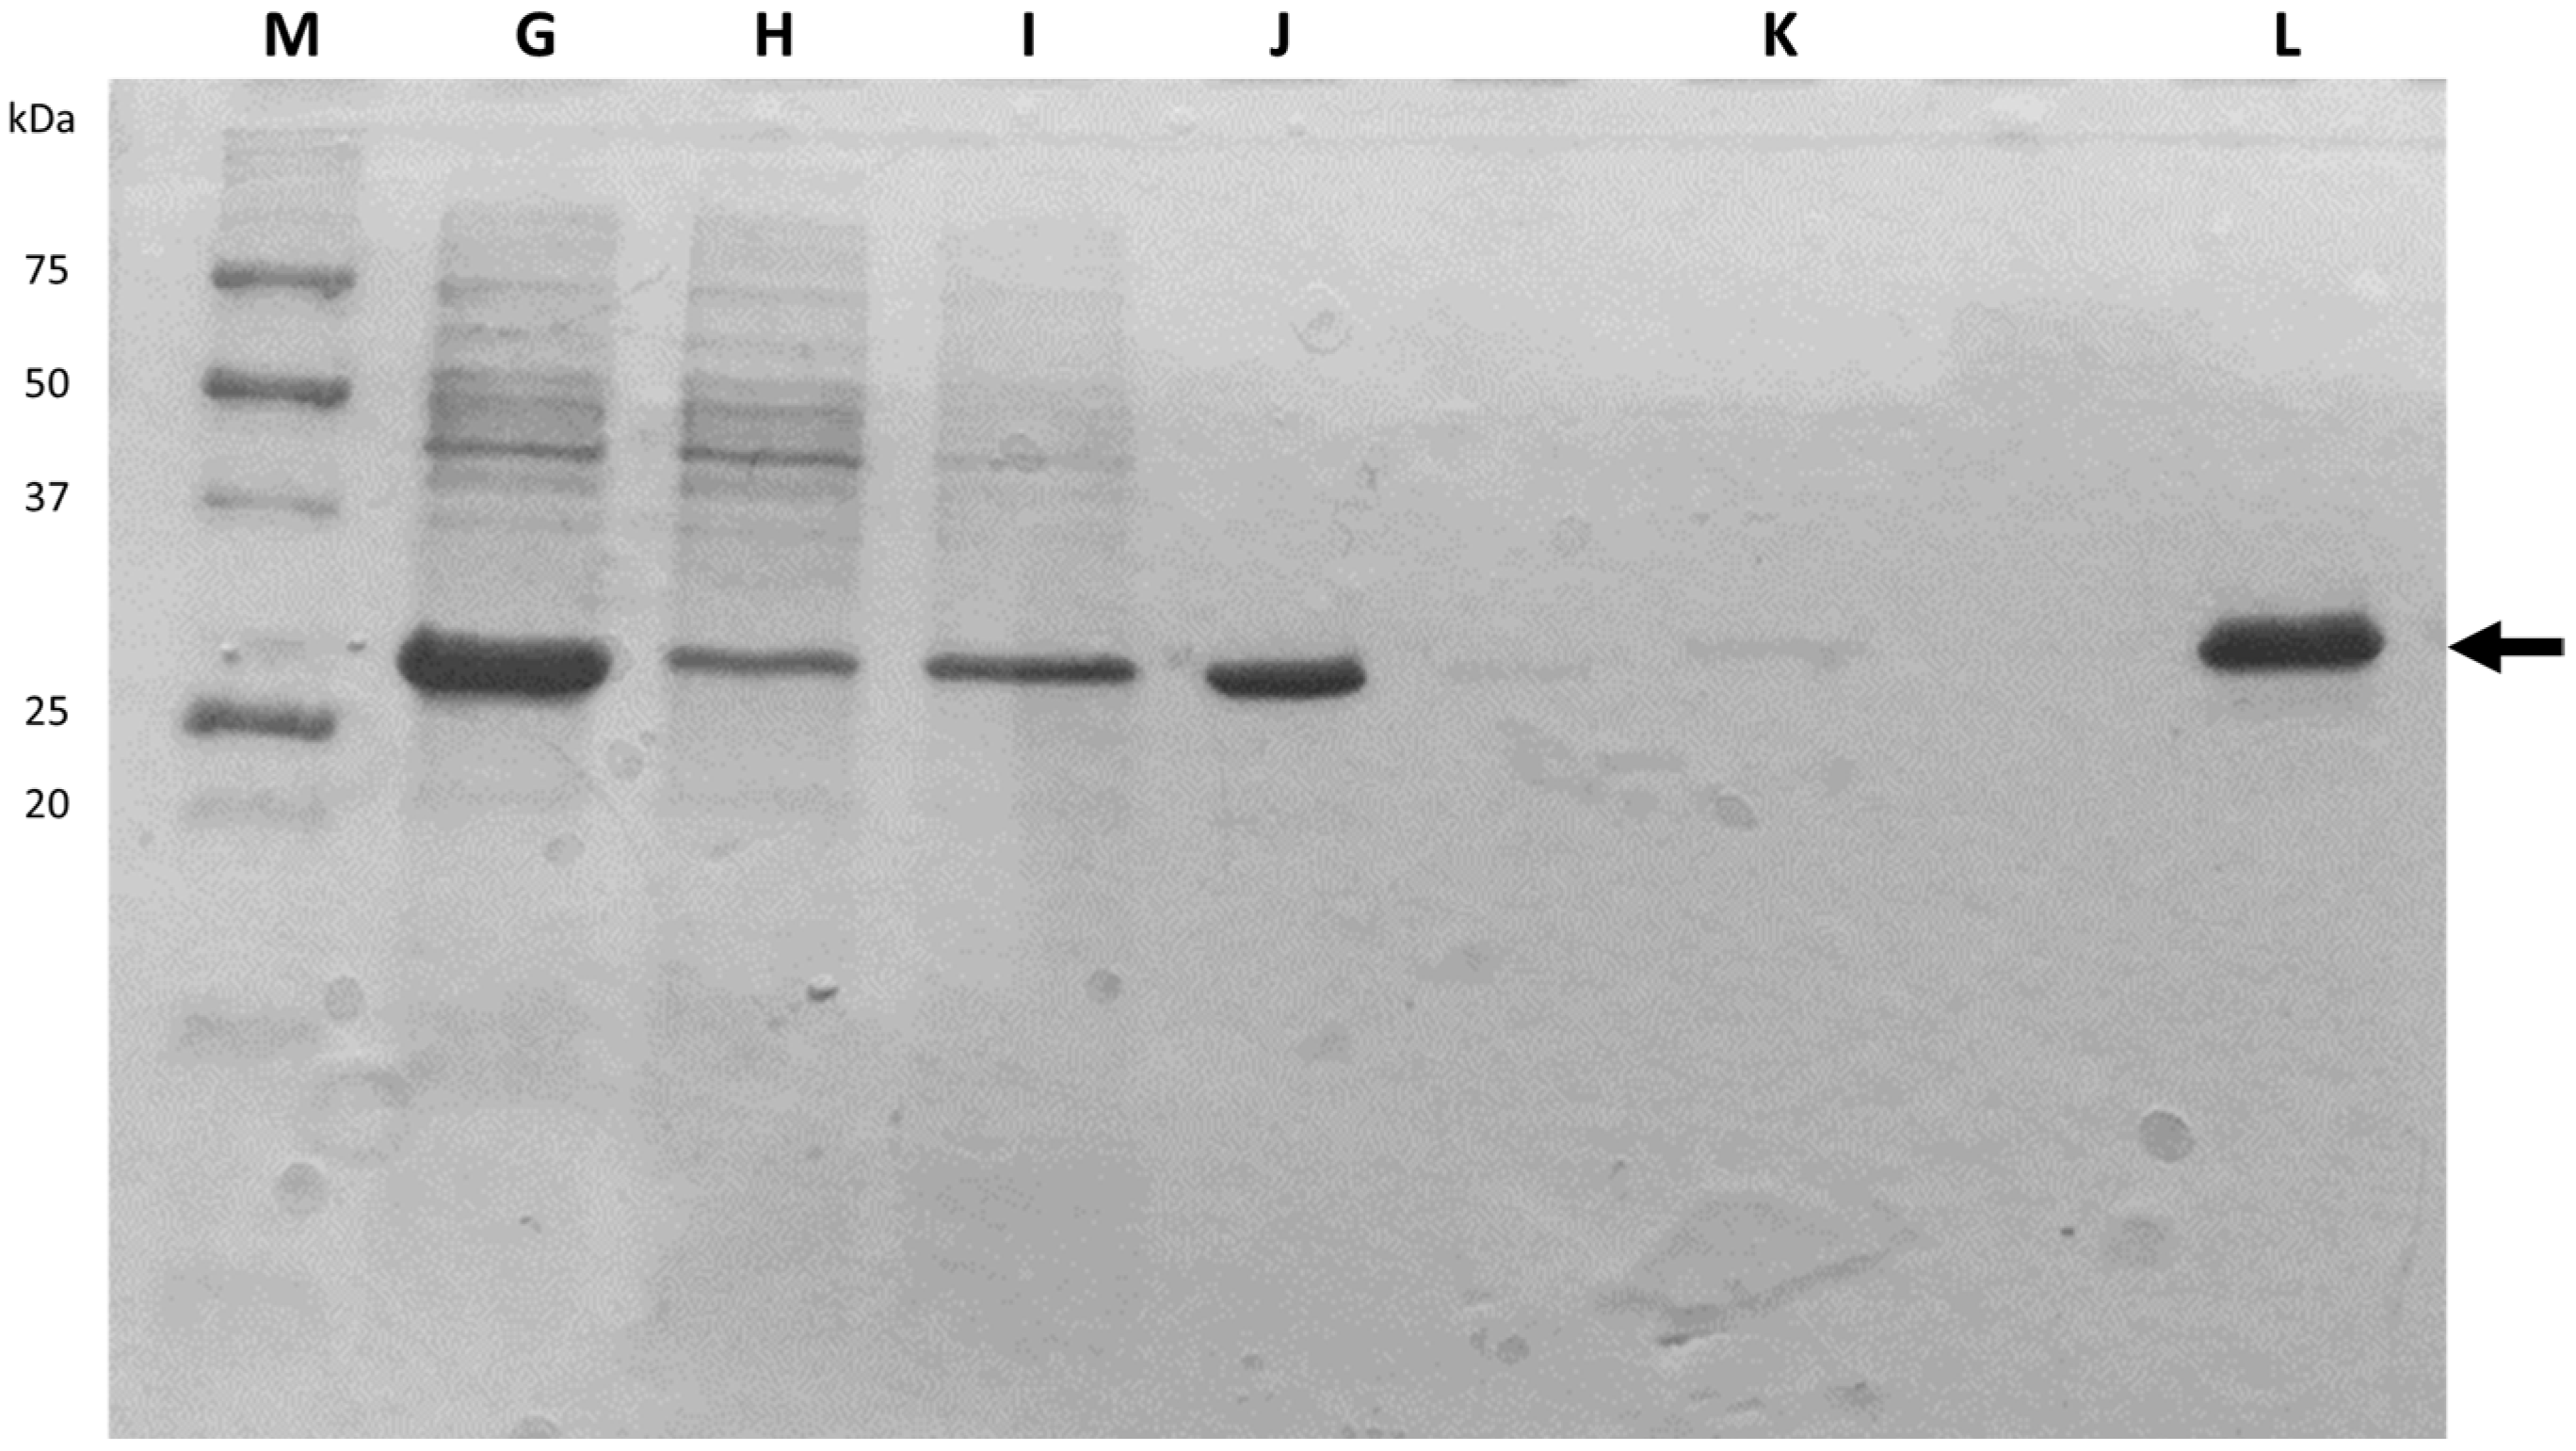
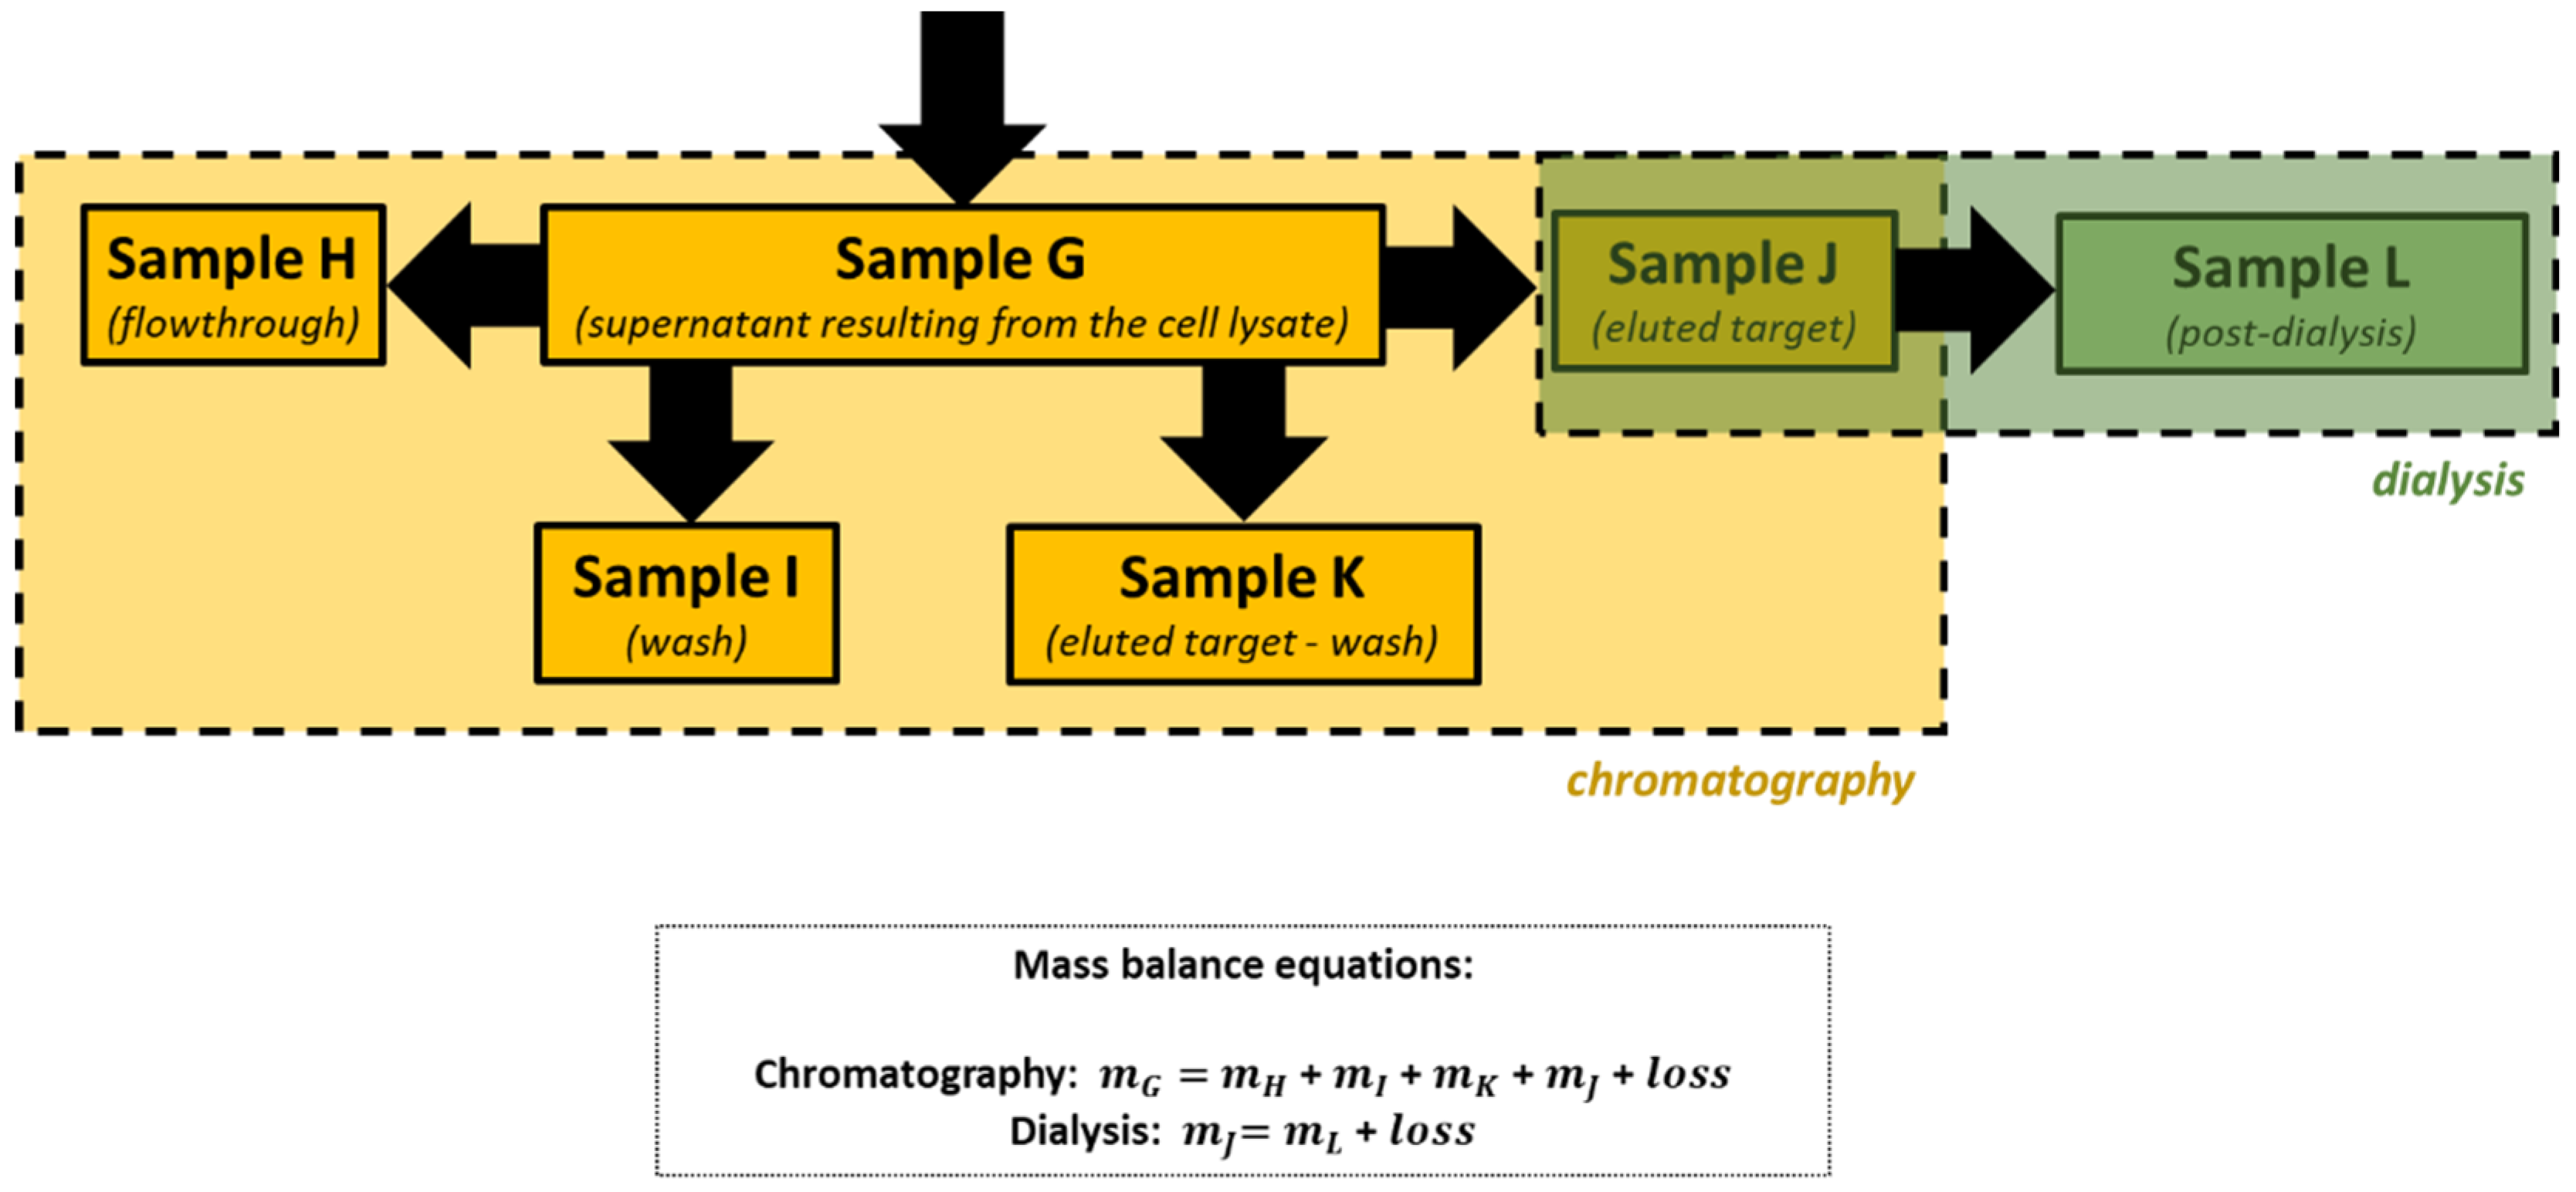
After cellular disruption, several methods can be used to enrich or purify a protein of interest from other proteins and components in a crude cell lysate. One of the most powerful methods is affinity chromatography, whereby the protein of interest is purified by its specific binding properties to an immobilized ligand [19]. In this practical course, protein purification was performed by affinity chromatography of the His-tagged protein in a nickel column, followed by dialysis. His-tag expression systems are extensively used in Protein Engineering because His-tagged proteins can be easily purified by single-step affinity chromatography, namely immobilized metal affinity chromatography (IMAC), which is commercially available in different kinds of formats, the Ni-NTA matrices being the most widely used [20]. Moreover, His-tags have low molecular weight (∼2.5 kDa) and usually do not affect protein structure and function, which means that it is not necessary to separate the His-tag from the target protein [21]. Most other proteins in the lysate do not bind to the Ni-NTA resin, or bind only weakly, thus the use of His-tag and IMAC can provide relatively pure recombinant protein directly from a crude lysate.

2. Pedagogical Considerations

The practical course is offered to undergraduate bioengineering and chemical engineering students at the Faculty of Engineering of the University of Porto (Portugal). A prerequisite for attendance is basic knowledge of cellular biology, molecular biology, and microbiology.
Students should familiar with the fundamentals of DNA cloning, vector design, and the pET system, since these concepts were attained in the corresponding lecture courses. For that reason, no pre-lab lecture was given, and students were expected to understand the lab work with the support of raw protocols provided by the instructors. Before starting the experimental session, a working group was selected to make a brief presentation of the theoretical concepts related to the topic of the session, as well as to present a quick protocol that was distributed to the remaining groups. Doubts were clarified and the quick protocols prepared by the remaining groups were collected. At the end of the course, the groups had access to the raw data of the other groups from the class and treated these data as a whole in the writing of their reports.
The main student learning objectives were:
  • To be proficient in carrying out the following procedures: bacterial growth, cell lysis, protein purification, protein quantification, and polyacrylamide gel electrophoresis.
  • To reinforce understanding of the following topics: plasmid design, recombinant protein expression, and protein purification.
  • To acquire skills to operate the following equipment: UV-Vis spectrophotometer, centrifuges, sonicator, microplate reader, and electrophoresis apparatus.
  • To improve the ability in critical thinking, team organization, and scientific concepts exposition and writing skills.

3. A Practical Teaching Course of Protein Engineering

3.1. Bacterial Growth

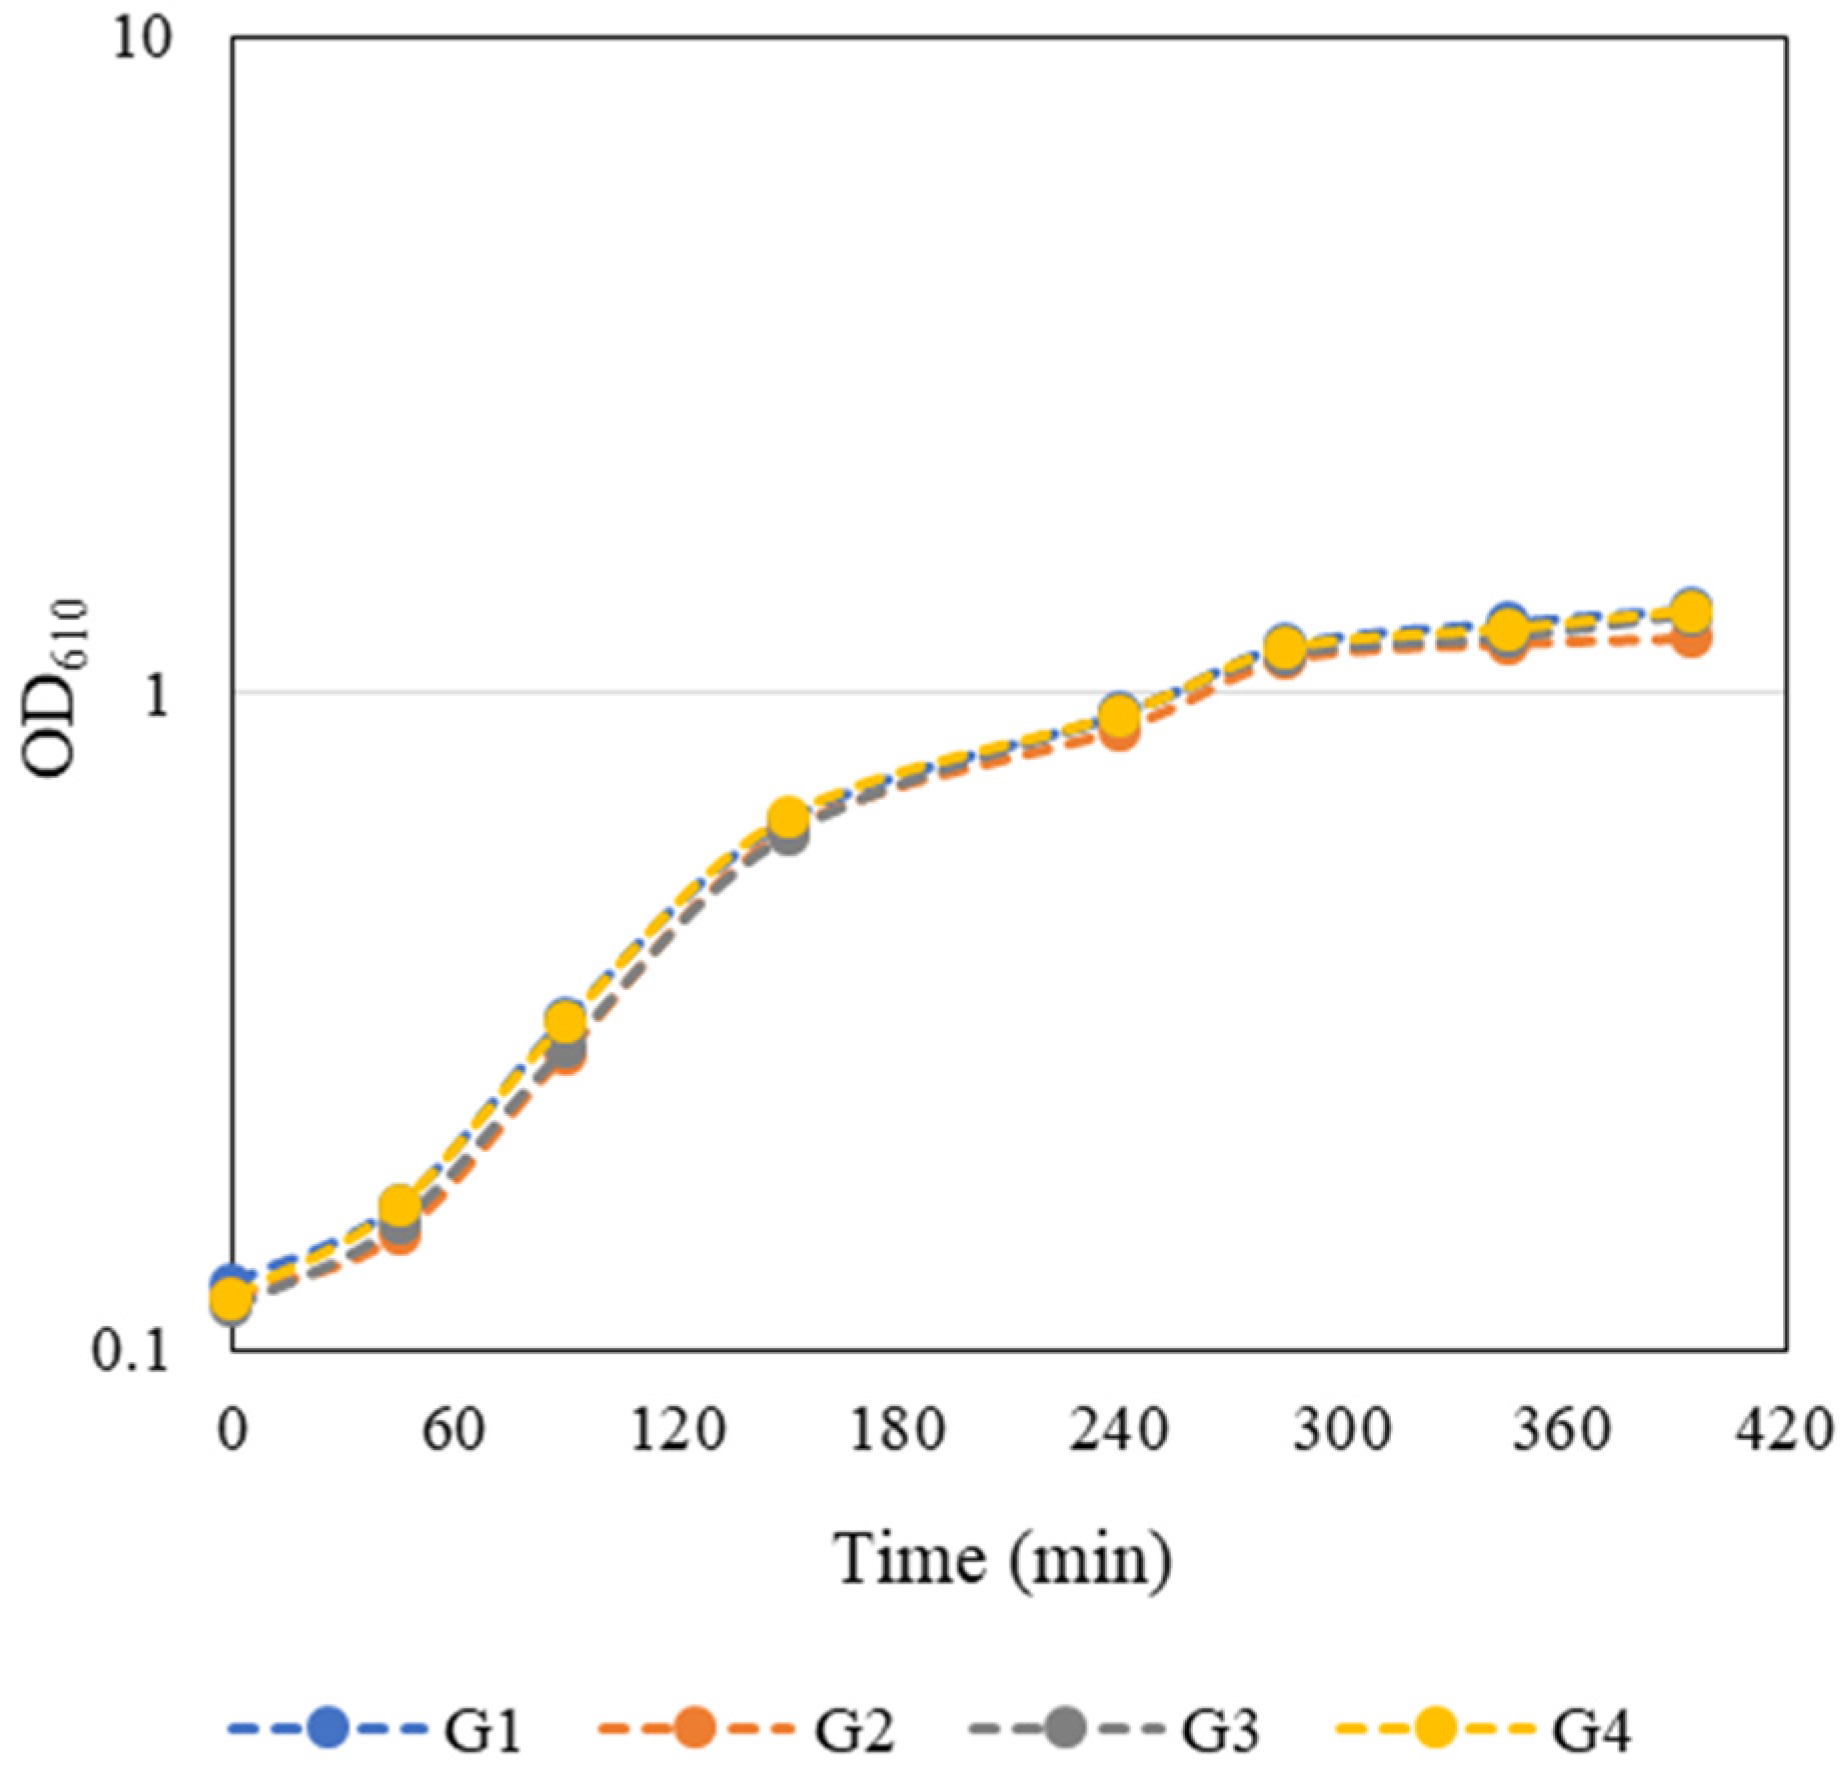
An overnight culture of E. coli JM109(DE3) containing the pFM23 plasmid was given to each group. To start the bacterial growth curves, the optical density at 610 nm (OD610) of this stationary phase culture was determined, and a dilution factor was calculated such that by adding fresh 125 mL of LB medium the final OD610 would be approximately 0.1. E. coli growth curves presented in Figure 2 were constructed by measuring the OD610 every 45–60 min during class and in the first hours after class. The growth curves were very similar and the groups considered that the exponential phase of bacterial growth occurred between 90 and 285 min. Growth kinetics parameters such as maximum growth rate (µmax) and doubling time (td) (Table 1) were then calculated separately for each individual growth curve through the logarithmic representation of the exponential part of the growth curve. Regression analysis of this experimental data was performed using a Microsoft Excel spreadsheet. The slope of the line that best fits the points corresponds to µmax of each independent growth, whereas td was estimated by Equation (1):
t d = ln ( 2 ) μ m a x   .
/media/item_content/202205/62737b75e2c72biology-11-00387-g003.png
Figure 2. Student-generated growth curves of E. coli JM109(DE3) harbouring the pFM23 plasmid. After 180 min of incubation, IPTG was added to the culture medium.
Table 1. Parameters obtained by regression analysis for each group.
Group R2 * p-Value ** µmax (min−1) td (min)
G1 0.9430 0.0289 0.00634 109.4
G2 0.9270 0.0372 0.00660 105.0
G3 0.9401 0.0304 0.00673 103.0
G4 0.9349 0.0331 0.00631 109.8
* R2 is the coefficient of determination and measures how well the regression predictions approximate the real data points. ** Since the p-values are much lower than the significance level (0.05), scholars rejected the null hypothesis that the coefficient is zero.
An average µmax and td of (0.00650 ± 0.00020) min−1 and (106.8 ± 3.3) min, respectively, were obtained. Looking at Table 1, it is possible to conclude that the values obtained from the regression analysis were similar between the working groups, with around 94% of the values fitting the linear model.
After 180 min of incubation (Figure 2), when bacterial cultures were in the exponential growth phase, IPTG was added to the culture medium. Recombinant protein expression was achieved through the transcription of the eGFP gene, which is under the control of T7 promoter in a pET-based vector (Figure 1). When bound to IPTG, the lac repressor lacI empties the lacUV5 promoter, enabling E. coli to transcribe the T7 gene 1, encoding the T7 RNA polymerase. The T7 RNA polymerase is then able to activate the promoter on the expression vector and transcribe the recombinant gene [9][10].

3.2. Protein Quantification and Analysis

After eGFP extraction and purification (Sessions 2 and 3), the total protein content in samples collected during these steps (sample G to L; Table 2) was first determined by the BCA assay. The BCA is a colorimetric method whose principle is that proteins can reduce Cu2+ to Cu+ in an alkaline solution (the biuret reaction), resulting in a purple color formation by bicinchoninic [22]. Thus, the amount of Cu2+ that is reduced is proportional to the amount of protein present in the solution. Bovine serum albumin (BSA) was used by the students to generate a standard curve against which unknown samples can be compared. The concentration of eGFP in the same samples (G to L) was also quantified by fluorometry using a calibration curve constructed from a purified eGFP solution of known concentration. Although the slope values of BCA or eGFP calibration curves were in the same order of magnitude for all groups, some variation between them was inevitably present due to pipetting errors in preparing standard solutions and loading the microplate for absorbance or fluorescence readings. However, all working groups were careful to validate their calibration curves using previously acquired knowledge of analytical chemistry [23].
Table 2. List of samples to be analyzed in Sessions 4, 5 and 6.
Sample Identification Session Content
A 1 Cell culture in the exponential phase
B 1 Grown cell culture
C 1 Supernatant resulting from the centrifugation of the cell culture
D 1 Cell pellet resuspended in Buffer I
E 2 Cell lysate
F 2 Cell debris resulting from the centrifugation of the cell lysate
G 2 Supernatant resulting from the centrifugation of the cell lysate
H 3 Flowthrough (unbound material)
I 3 Wash
J 3 Eluted target
K 3 Eluted target (wash)
L 3 Post-dialysis

The ability to predict bioprocessing performance is crucial for the production of recombinant proteins of therapeutic and prophylactic importance, especially on an industrial scale [24]. In an attempt to approach a real-world scenario of large-scale protein production, students were asked to examine the efficiency of the unit operations involved in the extraction and purification of the recombinant protein under study. For this, a full mass balance analysis was performed taking into account the concentrations of total protein and eGFP determined by the BCA and fluorometry methods, respectively, and knowing the total volume collected for each sample of the extraction and purification steps. The mass of total protein and eGFP of each sample, as well as its degree of purity (i.e., the percentage of eGFP in total protein), are summarized in Table 3 for each working group. As expected, the purity of the sample G (before the chromatography) was low compared to the other samples, varying between 14% and 24%, except for Group 4. Ideally, from the chromatography process, three samples with low protein purity should be obtained—samples H, I, and K—since they correspond to the discharges of the washing steps of the chromatographic columns. In fact, for all working groups, samples H and K had the two lowest levels of eGFP. In the case of sample I, since it corresponded to the wash fraction (unbound proteins and other compounds), it was expected that the mass of the target protein and, consequently the purity, would be residual, which was not verified. This may have resulted from an underestimation of the amount of total protein by the BCA method and/or the loss of His-tagged protein during sample loading and wash. Sample J corresponds to the eluted eGFP, thus it is expected that, like sample L collected after dialysis, it has a high degree of purity. This was verified in two of the groups (G1 and G4), with percentages of purity above 71% after chromatography. During the elution step, freedom of choice was given to the students concerning the volume in which they must collect and how they should do it (using continuous or intermittent flow with the collection of fractions at different times), always having in mind the visual aspect of the eluate and chromatographic resin. This introduces variations in the affinity chromatography protocol, which may justify the significant differences in the total and target protein content between groups. Nevertheless, the final sample of the purification process (sample L) was the one with the highest degree of purity for all working groups. Some purity values were greater than 100%, probably due to the uncertainty of the analytical methods involved in these calculations (BCA and fluorescence assays) and/or human errors (imprecision of pipetting and miscalculation, among others).

Table 3. Mass balance and eGFP purity for each working group.
Group Sample Total Protein Mass (mg) eGFP Mass (mg) Purity (%)
G1 G 39.475 8.056 20.4
H 29.709 1.176 4.0
I 3.759 1.207 32.1
J 5.146 5.325 103.5
K 0.248 0.051 20.6
L 2.686 3.737 139.1
G2 G 68.138 9.323 13.7
H 54.898 1.282 2.3
I 5.746 4.867 84.71
J 6.868 3.169 46.14
K 0.625 0.005 0.73
L 2.672 2.745 102.73
G3 G 55.630 13.361 24.0
H 51.235 1.358 2.7
I 1.993 1.067 53.5
J 0.580 0.227 39.1
K 0.191 0.007 3.7
L 1.621 2.743 169.2
G4 G 23.586 13.530 57.36
H 7.107 2.664 37.48
I 2.404 1.676 69.70
J 13.856 9.791 70.66
K 0.218 0.013 6.06
L 1.088 1.207 110.9
An alternative way of assessing the quality of the purification process is to determine the specific protein activity, which corresponds to the eGFP fluorescent signal per mass of total protein.
To qualitatively assess the purity and relative molecular mass of proteins in the samples, polyacrylamide gel electrophoresis (SDS-PAGE) was used. This technique, associated with Coomassie blue staining, can detect bands containing as little as 100 ng of protein in a simple and relatively rapid manner (just a few hours) [25]. After reduction and denaturation by SDS, proteins migrate in the gel according to their molecular mass, allowing detection of potential contaminant and proteolysis events. Therefore, these gels provide a useful diagnostic tool for estimating the degree of purity and quality of the recombinant protein throughout the purification steps. Figure 3 shows a photograph of a representative SDS-PAGE gel where samples from G to L were loaded, as well as the molecular weight marker in the first well on the left (M). By comparing the marker bands, it is possible to determine that the stronger and better-defined bands correspond to protein(s) with molecular weights slightly higher than 25 kDa. Given that this value is very close to that found in the bibliography for eGFP (27 kDa) [2], it can be concluded that this protein has been present since the beginning of the chromatography (sample G) in relevant quantities until the post-dialysis moment, where the presence of only one band of its molecular weight revealed that it was correctly isolated from the remaining proteins (sample L). This qualitative analysis corroborated the purity results previously described and presented in Table 3.
Figure 3. Representative SDS-PAGE gel of the samples collected between cell lysis and protein dialysis (G to L). Lane M corresponds to Precision Plus Protein unstained standards (ref. 161-0363, Bio-Rad). The arrow indicates the bands corresponding to eGFP.
As this is an engineering course, in addition to a full mass balance, students were also concerned with calculating the yield of each unit operation involved in the protein purification process (affinity chromatography and dialysis), as well as its overall performance (Table 4 and Figure 4). To determine the yield values presented in Table 4, each group had to consider the values of eGFP mass obtained by fluorometry (Session 6) shown in Table 3, and use Equations (2) and (3):
Chromatography   yield   ( % ) = e G F P   m a s s   i n   s a m p l e   J   e G F P   m a s s   i n   s a m p l e   G × 100 ,
Figure 4. Process flow diagram and mass balance equations associated with eGFP purification.
Table 4. eGFP yield for chromatography and dialysis by each working group.
Group Chromatography Yield (%) Dialysis Yield (%)
G1 66.1 70.2
G2 34.0 86.6
G3 1.7 1208.4 *
G4 72.4 12.3
* This value is not physically possible since there was no production or addition of recombinant protein during the dialysis stage.
Concerning chromatography, yields between 34% and 72% were obtained (except for G3, whose yield was residual), which means that from the amount of eGFP mass present in sample G, it was possible to recover between 34% and 72% in sample J (eluate). The variations in results obtained between groups were most likely associated with how they decided to collect the eluate containing the protein of interest, as explained before, which can lead to higher or lower losses of eGFP. For dialysis, the yield varied between 12% and 87%. It was not expected to have high losses of eGFP in this process since it consists of a separation technique to remove small, unwanted compounds (such as imidazole and salts) from proteins in solution by selective and passive diffusion through a semi-permeable membrane. Different events may have led to the low yield determined by the students: human error (inaccuracy of pipetting or miscalculation), technical problems associated with non-specific binding of the target protein to the dialysis membrane, or protein loss due to wrong membrane pore size or lose closure of the dialysis tube. The low ionic strength of the dialysis buffer may also have caused protein precipitation. Although the dialysis membrane was made of cellulose acetate and this material is less susceptible to non-specific protein adsorption, some eGFP sticking may have occurred. One way to avoid this is to add a low concentration of a nonionic detergent such as Triton X-100 or Tween-20 to the sample and dialysis buffer in order to coat the plastic surface and any exposed hydrophobic patches of the protein. The issue of protein precipitation during dialysis can be circumvented by increasing the ionic strength of the buffer resulting in salting-in (increased protein solubility). Despite the low dialysis yield, it was possible to obtain total protein recoveries up to 46%.
These sequential laboratory experiments were successfully applied by students as they were able to extract, purify, and quantify the protein of interest (eGFP) from an E. coli culture containing the expression plasmid (pFM23), and finally discuss the performance of the extraction and purification procedures they learned. Moreover, students were able to assess some of the benefits of Protein Engineering techniques such as mutagenesis (yielding more active proteins) and fusion protein tagging (which enabled high-level purification in a single-chromatographic step). This engineering course gives students the opportunity to experience different techniques commonly used in the pharmaceutical industry and academia to produce recombinant proteins.

References

  1. Poluri, K.M.; Gulati, K. Biotechnological and Biomedical Applications of Protein Engineering Methods. In Protein Engineering Techniques: Gateways to Synthetic Protein Universe; Springer: Singapore, 2017; pp. 103–134.
  2. Chalfie, M.; Tu, Y.; Euskirchen, G.; Ward, W.W.; Prasher, D.C. Green fluorescent protein as a marker for gene expression. Science 1994, 263, 802–805.
  3. Zacharias, D.A.; Tsien, R.Y. Molecular biology and mutation of green fluorescent protein. Methods Biochem. Anal. 2006, 47, 83–120.
  4. Stepanenko, O.V.; Stepanenko, O.V.; Kuznetsova, I.M.; Verkhusha, V.V.; Turoverov, K.K. Beta-barrel scaffold of fluorescent proteins: Folding, stability and role in chromophore formation. Int. Rev. Cell. Mol. Biol. 2013, 302, 221–278.
  5. Zacharias, D.A.; Baird, G.S.; Tsien, R.Y. Recent advances in technology for measuring and manipulating cell signals. Curr. Opin. Neurobiol. 2000, 10, 416–421.
  6. Gomes, L.C.; Mergulhão, F.J. Applications of Green Fluorescent Protein in Biofilm Studies. In Advances in Medicine and Biology; Berhardt, L.V., Ed.; Nova Science Publishers: Hauppauge, NY, USA, 2018; Volume 132.
  7. Stepanenko, O.V.; Verkhusha, V.V.; Kuznetsova, I.M.; Uversky, V.N.; Turoverov, K.K. Fluorescent proteins as biomarkers and biosensors: Throwing color lights on molecular and cellular processes. Curr. Protein Pept. Sci. 2008, 9, 338–369.
  8. Mergulhão, F.J.; Monteiro, G.A. Analysis of factors affecting the periplasmic production of recombinant proteins in Escherichia coli. J. Microbiol. Biotechnol. 2007, 17, 1236–1241.
  9. Gomes, L.C.; Monteiro, G.A.; Mergulhão, F.J. The Impact of IPTG Induction on Plasmid Stability and Heterologous Protein Expression by Escherichia coli Biofilms. Int. J. Mol. Sci. 2020, 21, 576.
  10. Novagen. pET System Manual, 11th ed.; 2005; Available online: https://kirschner.med.harvard.edu/files/protocols/Novagen_petsystem.pdf (accessed on 20 February 2022).
  11. Mergulhão, F.J.M.; Monteiro, G.A.; Cabral, J.M.S.; Taipa, M.A. Design of bacterial vector systems for the production of recombinant proteins in Escherichia coli. J. Microbiol. Biotechnol. 2004, 14, 1–14.
  12. Sanchez-Garcia, L.; Martín, L.; Mangues, R.; Ferrer-Miralles, N.; Vázquez, E.; Villaverde, A. Recombinant pharmaceuticals from microbial cells: A 2015 update. Microb. Cell Factories 2016, 15, 33.
  13. Baneyx, F. Recombinant protein expression in Escherichia coli. Curr. Opin. Biotechnol. 1999, 10, 411–421.
  14. Pines, O.; Inouye, M. Expression and secretion of proteins in E. coli. Mol. Biotechnol. 1999, 12, 25–34.
  15. Mergulhão, F.J.M.; Summers, D.K.; Monteiro, G.A. Recombinant protein secretion in Escherichia coli. Biotechnol. Adv. 2005, 23, 177–202.
  16. Mergulhão, F.J.; Taipa, M.A.; Cabral, J.M.; Monteiro, G.A. Evaluation of bottlenecks in proinsulin secretion by Escherichia coli. J. Biotechnol. 2004, 109, 31–43.
  17. Sørensen, H.P.; Mortensen, K.K. Soluble expression of recombinant proteins in the cytoplasm of Escherichia coli. Microb. Cell Fact. 2005, 4, 1.
  18. Gomes, L.C.; Mergulhão, F.J. Production of Recombinant Proteins in Escherichia coli Biofilms: Challenges and Opportunities. In Advances in Medicine and Biology; Berhardt, L.V., Ed.; Nova Science Publishers: Hauppauge, NY, USA, 2019; Volume 152.
  19. Urh, M.; Simpson, D.; Zhao, K. Affinity Chromatography: General Methods. In Methods in Enzymology; Burgess, R.R., Deutscher, M.P., Eds.; Academic Press: Cambridge, MA, USA, 2009; Volume 463, pp. 417–438.
  20. Spriestersbach, A.; Kubicek, J.; Schäfer, F.; Block, H.; Maertens, B. Purification of His-Tagged Proteins. In Methods in Enzymology; Lorsch, J.R., Ed.; Academic Press: Cambridge, MA, USA, 2015; Volume 559, pp. 1–15.
  21. Booth, W.T.; Schlachter, C.R.; Pote, S.; Ussin, N.; Mank, N.J.; Klapper, V.; Offermann, L.R.; Tang, C.; Hurlburt, B.K.; Chruszcz, M. Impact of an N-terminal Polyhistidine Tag on Protein Thermal Stability. ACS Omega 2018, 3, 760–768.
  22. Smith, P.K.; Krohn, R.I.; Hermanson, G.T.; Mallia, A.K.; Gartner, F.H.; Provenzano, M.D.; Fujimoto, E.K.; Goeke, N.M.; Olson, B.J.; Klenk, D.C. Measurement of protein using bicinchoninic acid. Anal. Biochem. 1985, 150, 76–85.
  23. Homem, V.; Alves, A.; Santos, L. Development and Validation of a Fast Procedure To Analyze Amoxicillin in River Waters by Direct-Injection LC–MS/MS. J. Chem. Educ. 2014, 91, 1961–1965.
  24. Tripathi, N.K.; Shrivastava, A. Recent Developments in Bioprocessing of Recombinant Proteins: Expression Hosts and Process Development. Front. Bioeng. Biotechnol. 2019, 7, 420.
  25. Walker, J.M. SDS Polyacrylamide Gel Electrophoresis of Proteins. In The Protein Protocols Handbook; Walker, J.M., Ed.; Humana Press: Totowa, NJ, USA, 2009; pp. 177–185.
More
Information
Contributors MDPI registered users' name will be linked to their SciProfiles pages. To register with us, please refer to https://encyclopedia.pub/register : , ,
View Times: 838
Revisions: 2 times (View History)
Update Date: 05 May 2022
1000/1000