Your browser does not fully support modern features. Please upgrade for a smoother experience.
Submitted Successfully!
 +1 credit
Thank you for your contribution! You can also upload a video entry or images related to this topic.
For video creation, please contact our Academic Video Service.
| Version | Summary | Created by | Modification | Content Size | Created at | Operation |
|---|---|---|---|---|---|---|
| 1 | Oscar Vidal | -- | 2182 | 2022-04-03 21:19:09 | | | |
| 2 | Dean Liu | Meta information modification | 2182 | 2022-04-06 03:57:40 | | | | |
| 3 | Dean Liu | Meta information modification | 2182 | 2022-04-06 10:18:50 | | |
Video Upload Options
We provide professional Academic Video Service to translate complex research into visually appealing presentations. Would you like to try it?
Cite
If you have any further questions, please contact Encyclopedia Editorial Office.
Vidal, O.; Saurina, J.; , .; Granados, M.; Nuñez, O.; Sentellas, S. Total Polyphenol Content in Food Samples and Nutraceuticals. Encyclopedia. Available online: https://encyclopedia.pub/entry/21337 (accessed on 23 July 2026).
Vidal O, Saurina J, , Granados M, Nuñez O, Sentellas S. Total Polyphenol Content in Food Samples and Nutraceuticals. Encyclopedia. Available at: https://encyclopedia.pub/entry/21337. Accessed July 23, 2026.
Vidal, Oscar, Javier Saurina, , Mercè Granados, Oscar Nuñez, Sonia Sentellas. "Total Polyphenol Content in Food Samples and Nutraceuticals" Encyclopedia, https://encyclopedia.pub/entry/21337 (accessed July 23, 2026).
Vidal, O., Saurina, J., , ., Granados, M., Nuñez, O., & Sentellas, S. (2022, April 03). Total Polyphenol Content in Food Samples and Nutraceuticals. In Encyclopedia. https://encyclopedia.pub/entry/21337
Vidal, Oscar, et al. "Total Polyphenol Content in Food Samples and Nutraceuticals." Encyclopedia. Web. 03 April, 2022.
Copy Citation
Total polyphenol content and antioxidant capacity were estimated in various food and nutraceutical samples. These were analyzed by using two antioxidant assays—ferric reducing antioxidant power (FRAP) and Folin–Ciocalteu (FC)—and a reversed-phase high performance liquid chromatography (HPLC), with a focus on providing compositional fingerprints dealing with polyphenolic compounds. A preliminary data exploration via principal component analysis (PCA) revealed that HPLC fingerprints were suitable chemical descriptors to classify the analyzed samples according to their nature. Moreover, chromatographic data were correlated with antioxidant data using partial least squares (PLS) regression.
polyphenols
antioxidant capacity
high-performance liquid chromatography
ferric reducing antioxidant power
Folin–Ciocalteu
1. Introduction
One of the most important effects of polyphenols, due to their great antioxidant capacity, is their ability to eliminate toxic products that harm organisms through oxidative reactions. Several studies have proven the protective effects of plants against cancers or cardiovascular diseases; these studies have investigated the role of polyphenols. Experimental research has proven that polyphenols, in addition to preventing diseases, could also impact propagation, even in healing.
The separation and determination of polyphenols are difficult tasks, due to the high number of polyphenolic molecules and the matrix complexities of different food samples. Analytical separation methodologies, such as high-performance liquid chromatography (HPLC) and capillary electrophoresis (CE), coupled with several detection systems, including UV–Vis, fluorescence, and mass spectrometry (MS), have been described. The latter is presently the most powerful system used for the identification of polyphenols.
While HPLC is the most common technique used for separating and quantifying individual polyphenols, there are many spectrophotometric assays used to determine the total polyphenol content and, consequently, the antioxidant capacity [1][2]. These spectrophotometric assays are based on chemical reactions, some involving single electron transfer (SET) processes, such as Folin–Ciocalteu (FC) and ferric reducing antioxidant power (FRAP) methods, while others rely on hydrogen atom transfer (HAT) mechanisms (e.g., oxygen radical absorbance capacity (ORAC)), or a combination of the two types (e.g., 2,2′-azino-bis(3-ethylbenzothiazoline-6-sulfonic) acid (ABTS) and 2,2-diphenyl-1-picrylhydrazyl (DPPH) methods) [3][4][5]. Moreover, antioxidant capacity can also be estimated by electrochemical techniques, especially via differential pulse voltammetry (DPV) [2][6].
Focusing on the redox methods evaluated in this work—FC is based on the reduction of Mo (VI) to Mo (V), yielding a blue product often measured at 765 nm. As a drawback, other reducing agents apart from polyphenols—such as ascorbic acid, some sugars, and amino acids—can interfere with the determination, so the content of phenolic compounds may be overestimated [7]. In a similar way, FRAP relies on the reduction of Fe(III) to Fe(II) by the action of the antioxidants. In the presence of 2,4,6-tripyridyl-S-triazine (TPTZ), Fe(II) forms a colored complex that absorbs at 595 nm. Although the assay is simple, the absorption slowly increases over the reaction time and several hours may be required to reach a steady state for some polyphenols (caffeic acid, tannic acid, ferulic acid, ascorbic acid, and quercetin) [8][9].
2. HPLC and MS Analysis
A reverse-phase HPLC method was used to analyze the wide variety of samples (nutraceuticals, foods, and beverages). The optimization was focused on obtaining compositional profiles of the samples under study---as rich as possible at a minimum running time. For this purpose, the QC sample was used as a representative average sample. A suitable elution gradient based on previous studies is given in the experimental section. The chromatogram of the QC sample obtained under these conditions is depicted in Figure 1. Since sample extracts consisted of complex mixtures of a wide range of compounds with different spectroscopic features and polarity, a gradient profile increasing the ACN percentage from 20% to 60% in 22 min (total running time, 27 min, including separation, cleaning, and stabilization steps) was applied to achieve a reasonable separation of the compounds.
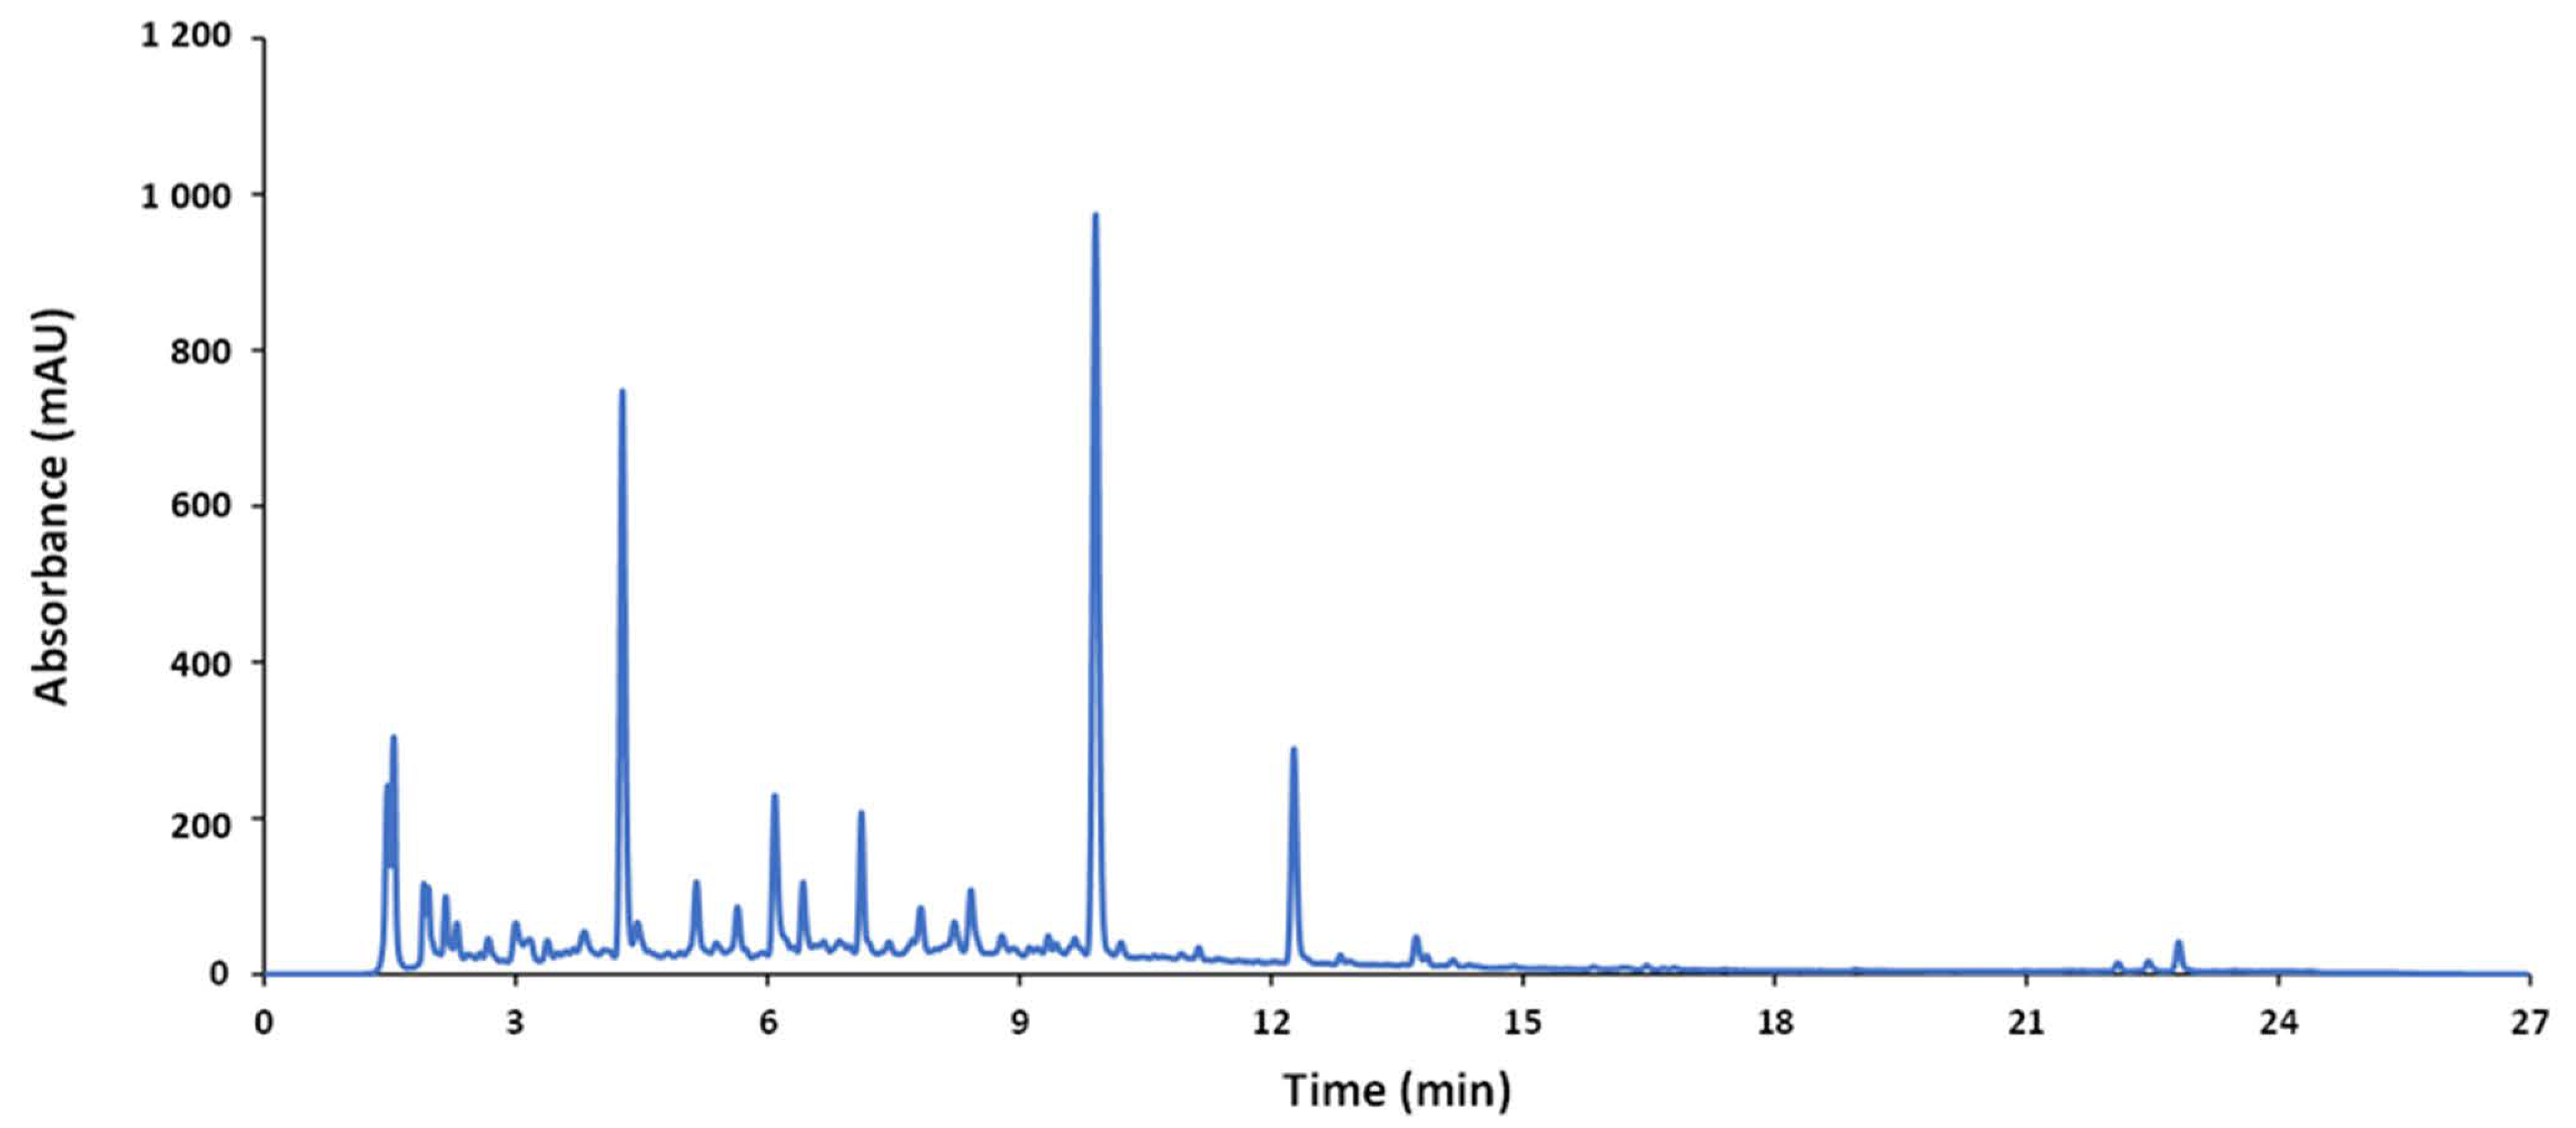
Figure 1. Chromatogram of the QC recorded by UV at 280 nm.
According to the detection used (UV or FLD), noticeable differences depending on the nature of the sample can be found in both types of fingerprints. This finding suggests that given products could be discriminated from each other based on the differences in composition. In the case of UV chromatograms recorded at 280 nm, they mainly contained information dealing with phenolic acids and some flavonoid families, so that the overall areas could be reasonable indices of the global phenolic content closely related to the global antioxidant activity [10]. In contrast, FLD fingerprints were more specific of flavanol and flavanone species, while the contributions of other phenolic compounds, such as hydroxybenzoic and hydroxycinnamic acids, were negligible [11].
A tentative identification of some major phenolic components in each type of sample relied on HPLC–MS. A targeted study using standards revealed that, in the case of chocolate—epicatechin, catechin, gallic acid, procyanidin C1, and procyanidin B1 were major phytochemicals. The most significant flavonoids in tea were epigallocatechin, quercetin, rutin, myricetin, and hesperidin. Moreover, caffeic and related compounds, such as chlorogenic acid, caftaric, and coumaric acids, and 3,4-dihydroxybenzoic acid and 4-hydroxybenzoic acid, were also important. Coffee extracts were rich in hydroxycinnamic acids, such as ferulic and caffeic acid, and their derivatives, especially chlorogenic acids. In the case of turmeric and curry, the most significative compounds were curcuminoids, including curcumin, demethoxycurcumin, and bisdemethoxycurcumin, which is of great interest because of their anti-inflammatory and antineoplastic activities; caffeic acid, coumaric acid, ferulic acid, 4-hydroxybenzoic acid, vanillic acid, and vanillin were also abundant. Cranberry-based extracts were rich in flavanols—epicatechin, procyanidin C1, and procyanidin B1—among which, procyanidin A2 stands out, due to its antibacterial activity. For grape and wine products—caffeic, caftaric, and coutaric acid were the major species, with gallic acid, ethyl gallate, epicatechin, and chlorogenic acid also occurring at high levels. Raspberry showed some components similar to other berries, comprising flavanols, such as epigallocatechin, epicatechin, and catechin, flavonols, such as quercetin, and phenolic acids, such as caffeic and gallic acids. The main phenolic compounds in artichoke extract were hydroxycinnamic acids (e.g., ferulic, coumaric, and caffeic acids), and multiple hydroxybenzoic acids (e.g., gallic, 3,4-dihydroxybenzoic, 4-hydroxybenzoic, vanillic acid and 2,5-dihydroxybenzoic acids). Finally, pepper samples contained some flavonoids (e.g., quercetin) and phenolic acids (e.g., caffeic and 3,4-dihydroxybenzoic acids). These results agree with previous studies that focused on the characterization of each particular matrix [12][10][11][13][14][15][16][17].
3. Sample Characterization by PCA
Regarding polyphenolic fingerprinting, the data under study consisted of sample chromatograms recorded by UV at 280 nm, in the working range of 1.15 to 25.95 min, in which the most significant components were eluted, especially those corresponding to phenolic acids and flavonoids. Moreover, to obtain additional information for the compositional profiles, chromatograms recorded by FLD at 280 and 330 nm as the excitation and emission wavelengths, respectively, in the working range of 1.22 to 25.19 min, were also examined. The data pretreatment consisted of a correction of the baseline, standardization by the sample mass, normalization, and autoscaling. Then, chemometric analyses by the PCA of UV and FLD data were conducted. The UV model (Figure 2) showed that QCs appear clustered, nearly in the middle of the model; therefore, this indicates a good reproducibility of chromatographic data and suitability of the model built. PC1 mainly discriminated among turmeric-based (on the right side) and other samples (on the left). According to the information provided by PCA loadings, curry, especially turmeric samples, were highly differentiated from the others by the content of curcuminoids, which presented high retention times (22–23 min) because of their lower polarity compared with other polyphenols. Conversely, those samples on the left side displayed more polar molecules, such as hydroxycinnamic acids regarding wines and some berries. PC2 discriminated samples as a function of the overall phenolic content, with the richest extracts located in the upper part of the graph (e.g., cranberry and grape-based products) while the less concentrated ones were at the bottom (juices and other beverages).
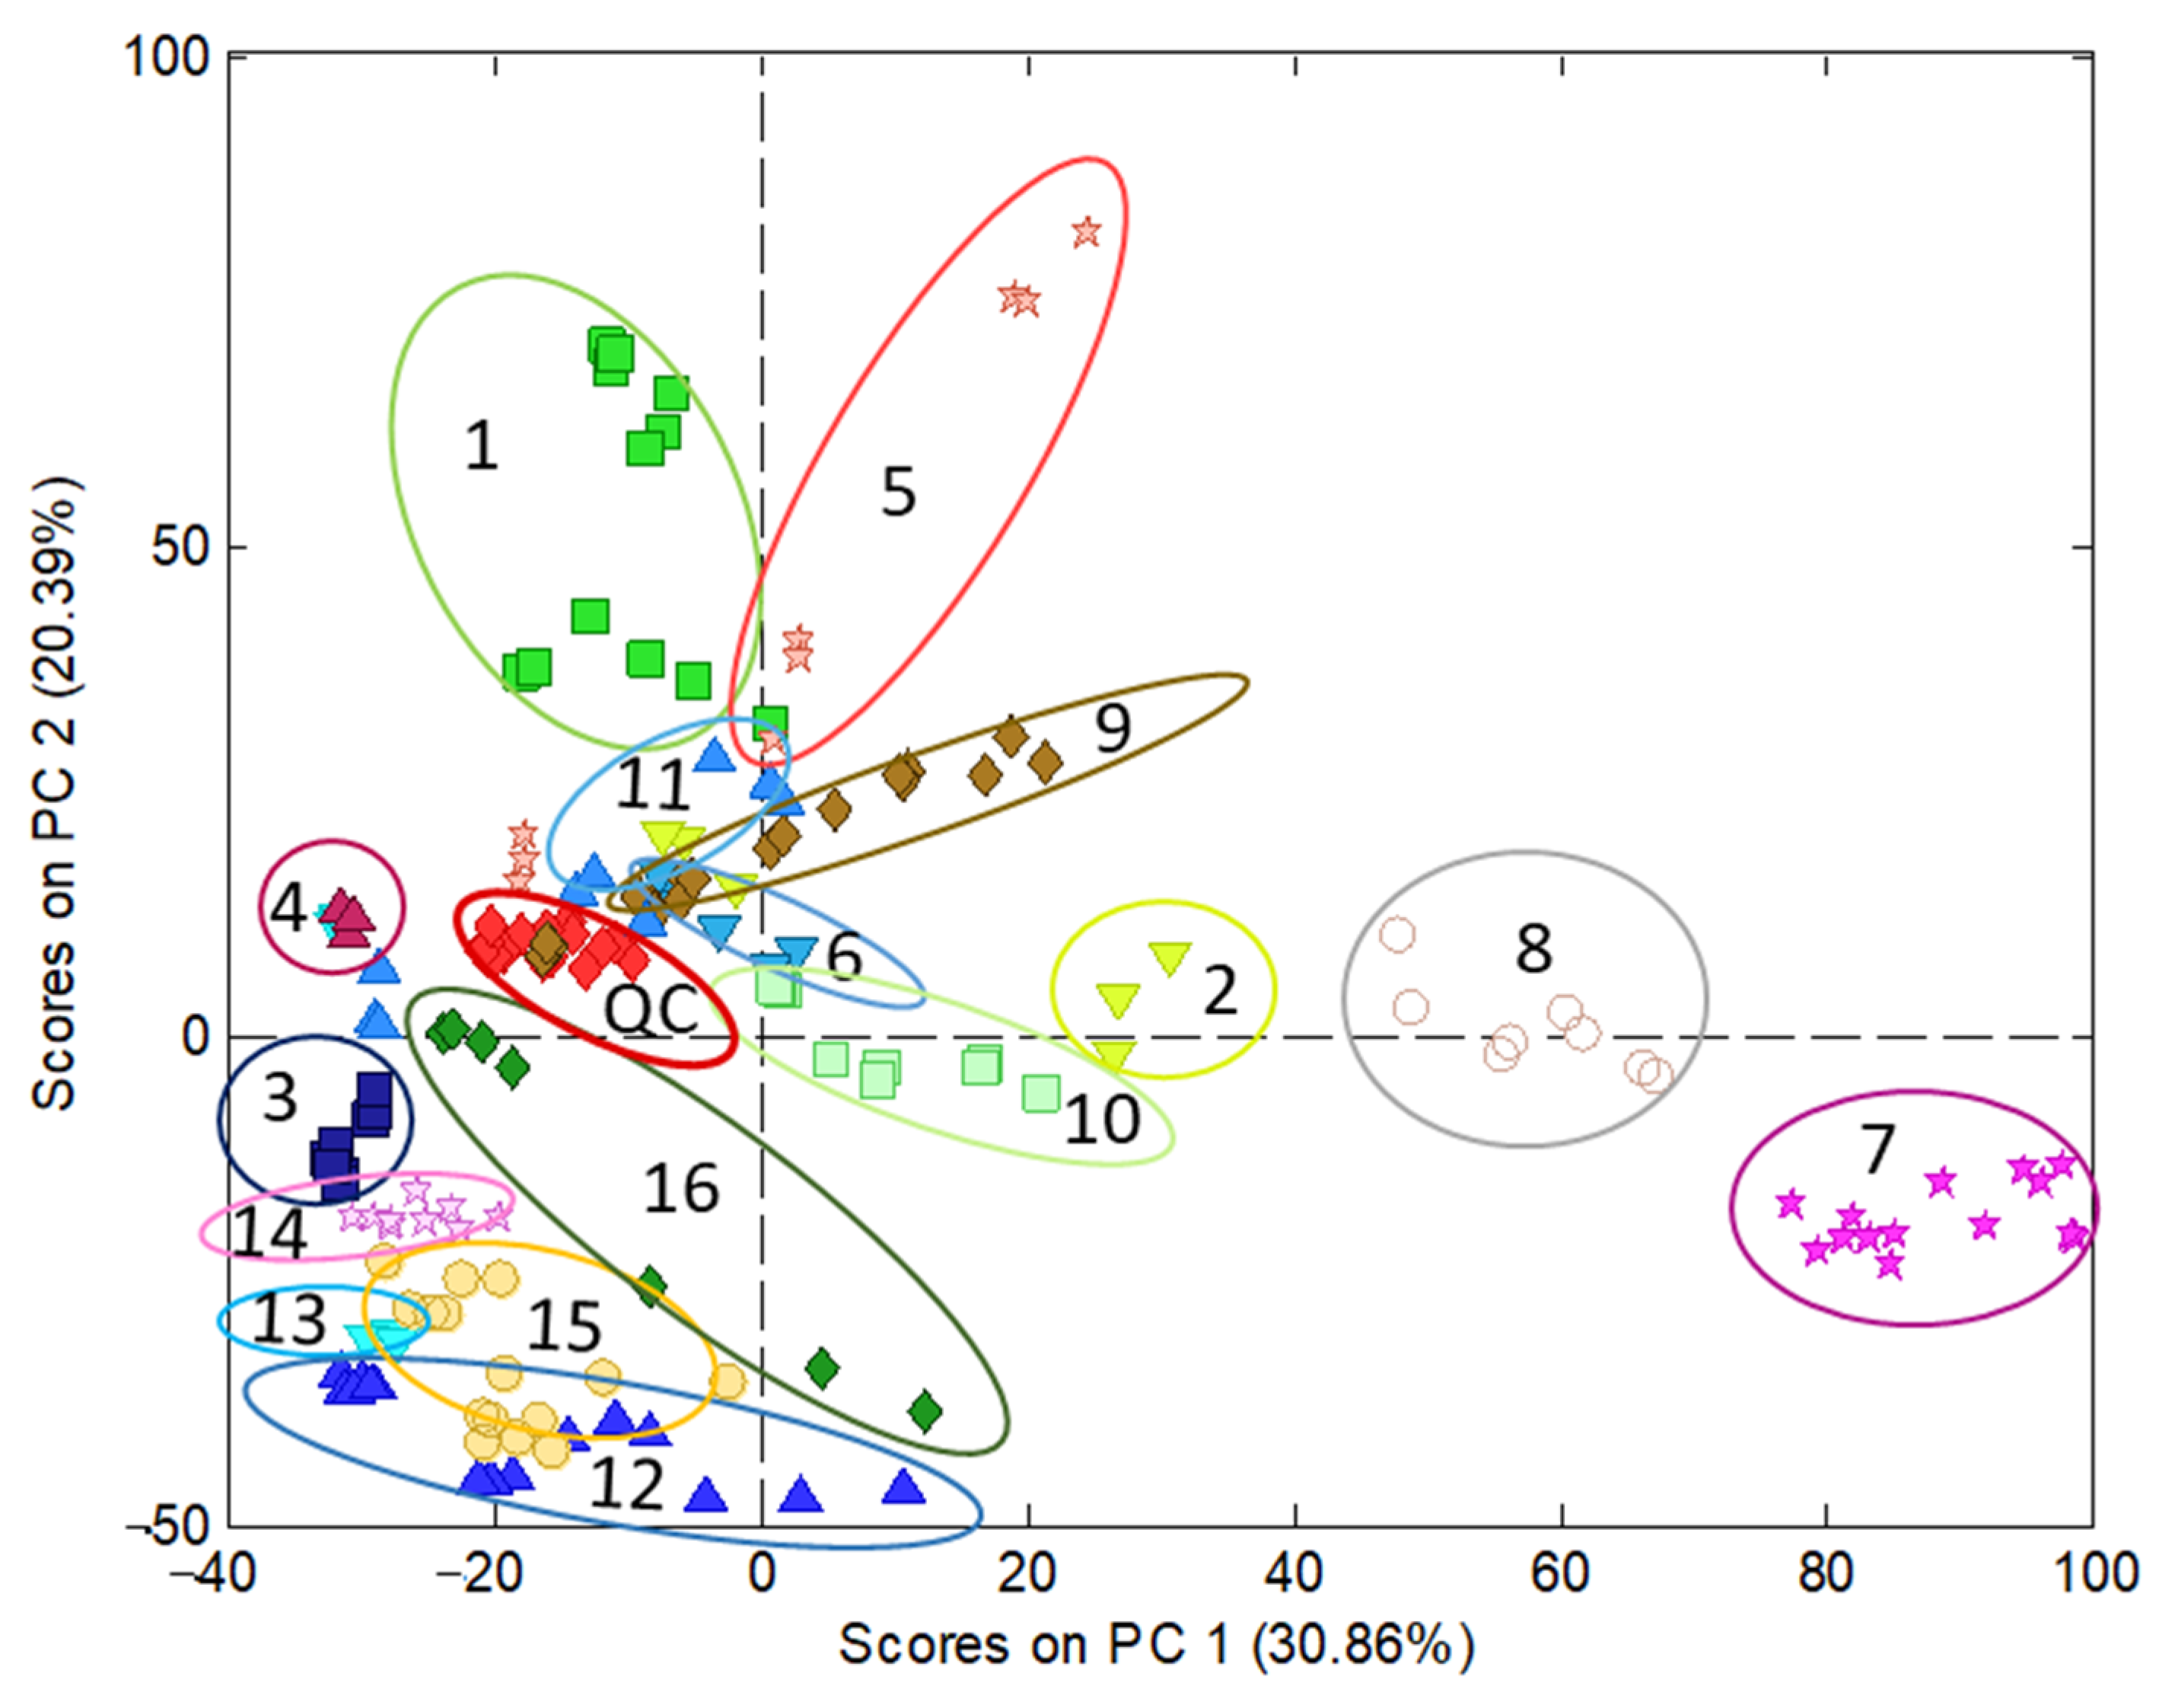
Figure 2. Characterization of nutraceuticals, foods, and beverages by PCA using the chromatographic fingerprints by UV (280 nm) in the time range 1.15 to 25.95 min as the data. Scatter plot of scores of PC1 vs. PC2. Classes identification: 1 = cranberry extract; 2 = cranberry (with other plants) extract; 3 = raspberry extract; 4 = black grape (seeds) extract; 5 = black grape (peel and grapevine) extract; 6 = artichoke extract; 7 = turmeric extract; 8 = curry extract; 9 = coffee extract; 10 = pepper extract; 11 = tea extract; 12 = juice; 13 = wine; 14 = beer; 15 = sparkling wine; 16 = chocolate extract.
The principal difference between the UV and FLD model is that, in the first, the cranberry samples are more dispersed than in the FLD model and mixed with samples made of black grape (peel) with others and grapevine. Moreover, the variance explained with two PCs by the UV model is higher than that captured by the FLD counterpart—51.25% and 45.04%, respectively. Eventually, the results obtained by UV were considered better than by FLD. This finding was attributed to the higher richness of the UV fingerprints, containing information from a wide range of phenolic acid and flavonoid families, while FLD data were more limited to flavanols and flavanones [11].
As a conclusion, PCA models revealed interesting information on the compositions of the samples from both qualitative and quantitative points of view; they were mainly distributed depending on the polarities of their phenolic components as well as their concentrations.
4. Determination of the Antioxidant Capacity of Different Sample Classes by Spectrophotometric Indices
The 53 samples from nutraceuticals, foods, and beverages were also analyzed via FC and FRAP methods to assess the polyphenol content expressed as the antioxidant capacity (g standard per Kg or L of sample). Under the current circumstances, the FC method was linear in the range 1 to 18 mg L−1 gallic acid (determination coefficient, R2 = 0.994) and the FRAP method was linear between 0.2 and 9 mg L−1 Trolox (R2 = 0.998).
Based on these indices, samples with higher antioxidant activities were tea and berry extracts (e.g., from cranberry, black grape, and raspberry), while beverages, such as beer, peach juice, and sparkling wine showed lower activities. The comparison of results from the different indices reveal that the antioxidant power of each sample type depended on the FC or FRAP method because the sensitivities towards each type of polyphenol were different [18]. For example, even though FC and FRAP reactions follow the same antioxidant HAT mechanism and the redox potentials of both systems are similar, the FC index is more sensitive in cranberry and raspberry samples, and the FRAP index in artichoke, coffee, and tea samples. These discrepancies can be easily visualized in the plot of FC versus FRAP data (Figure 3), in which, despite the correlation, was statistically significant (R2 = 0.8259); some samples differed from the general trend.
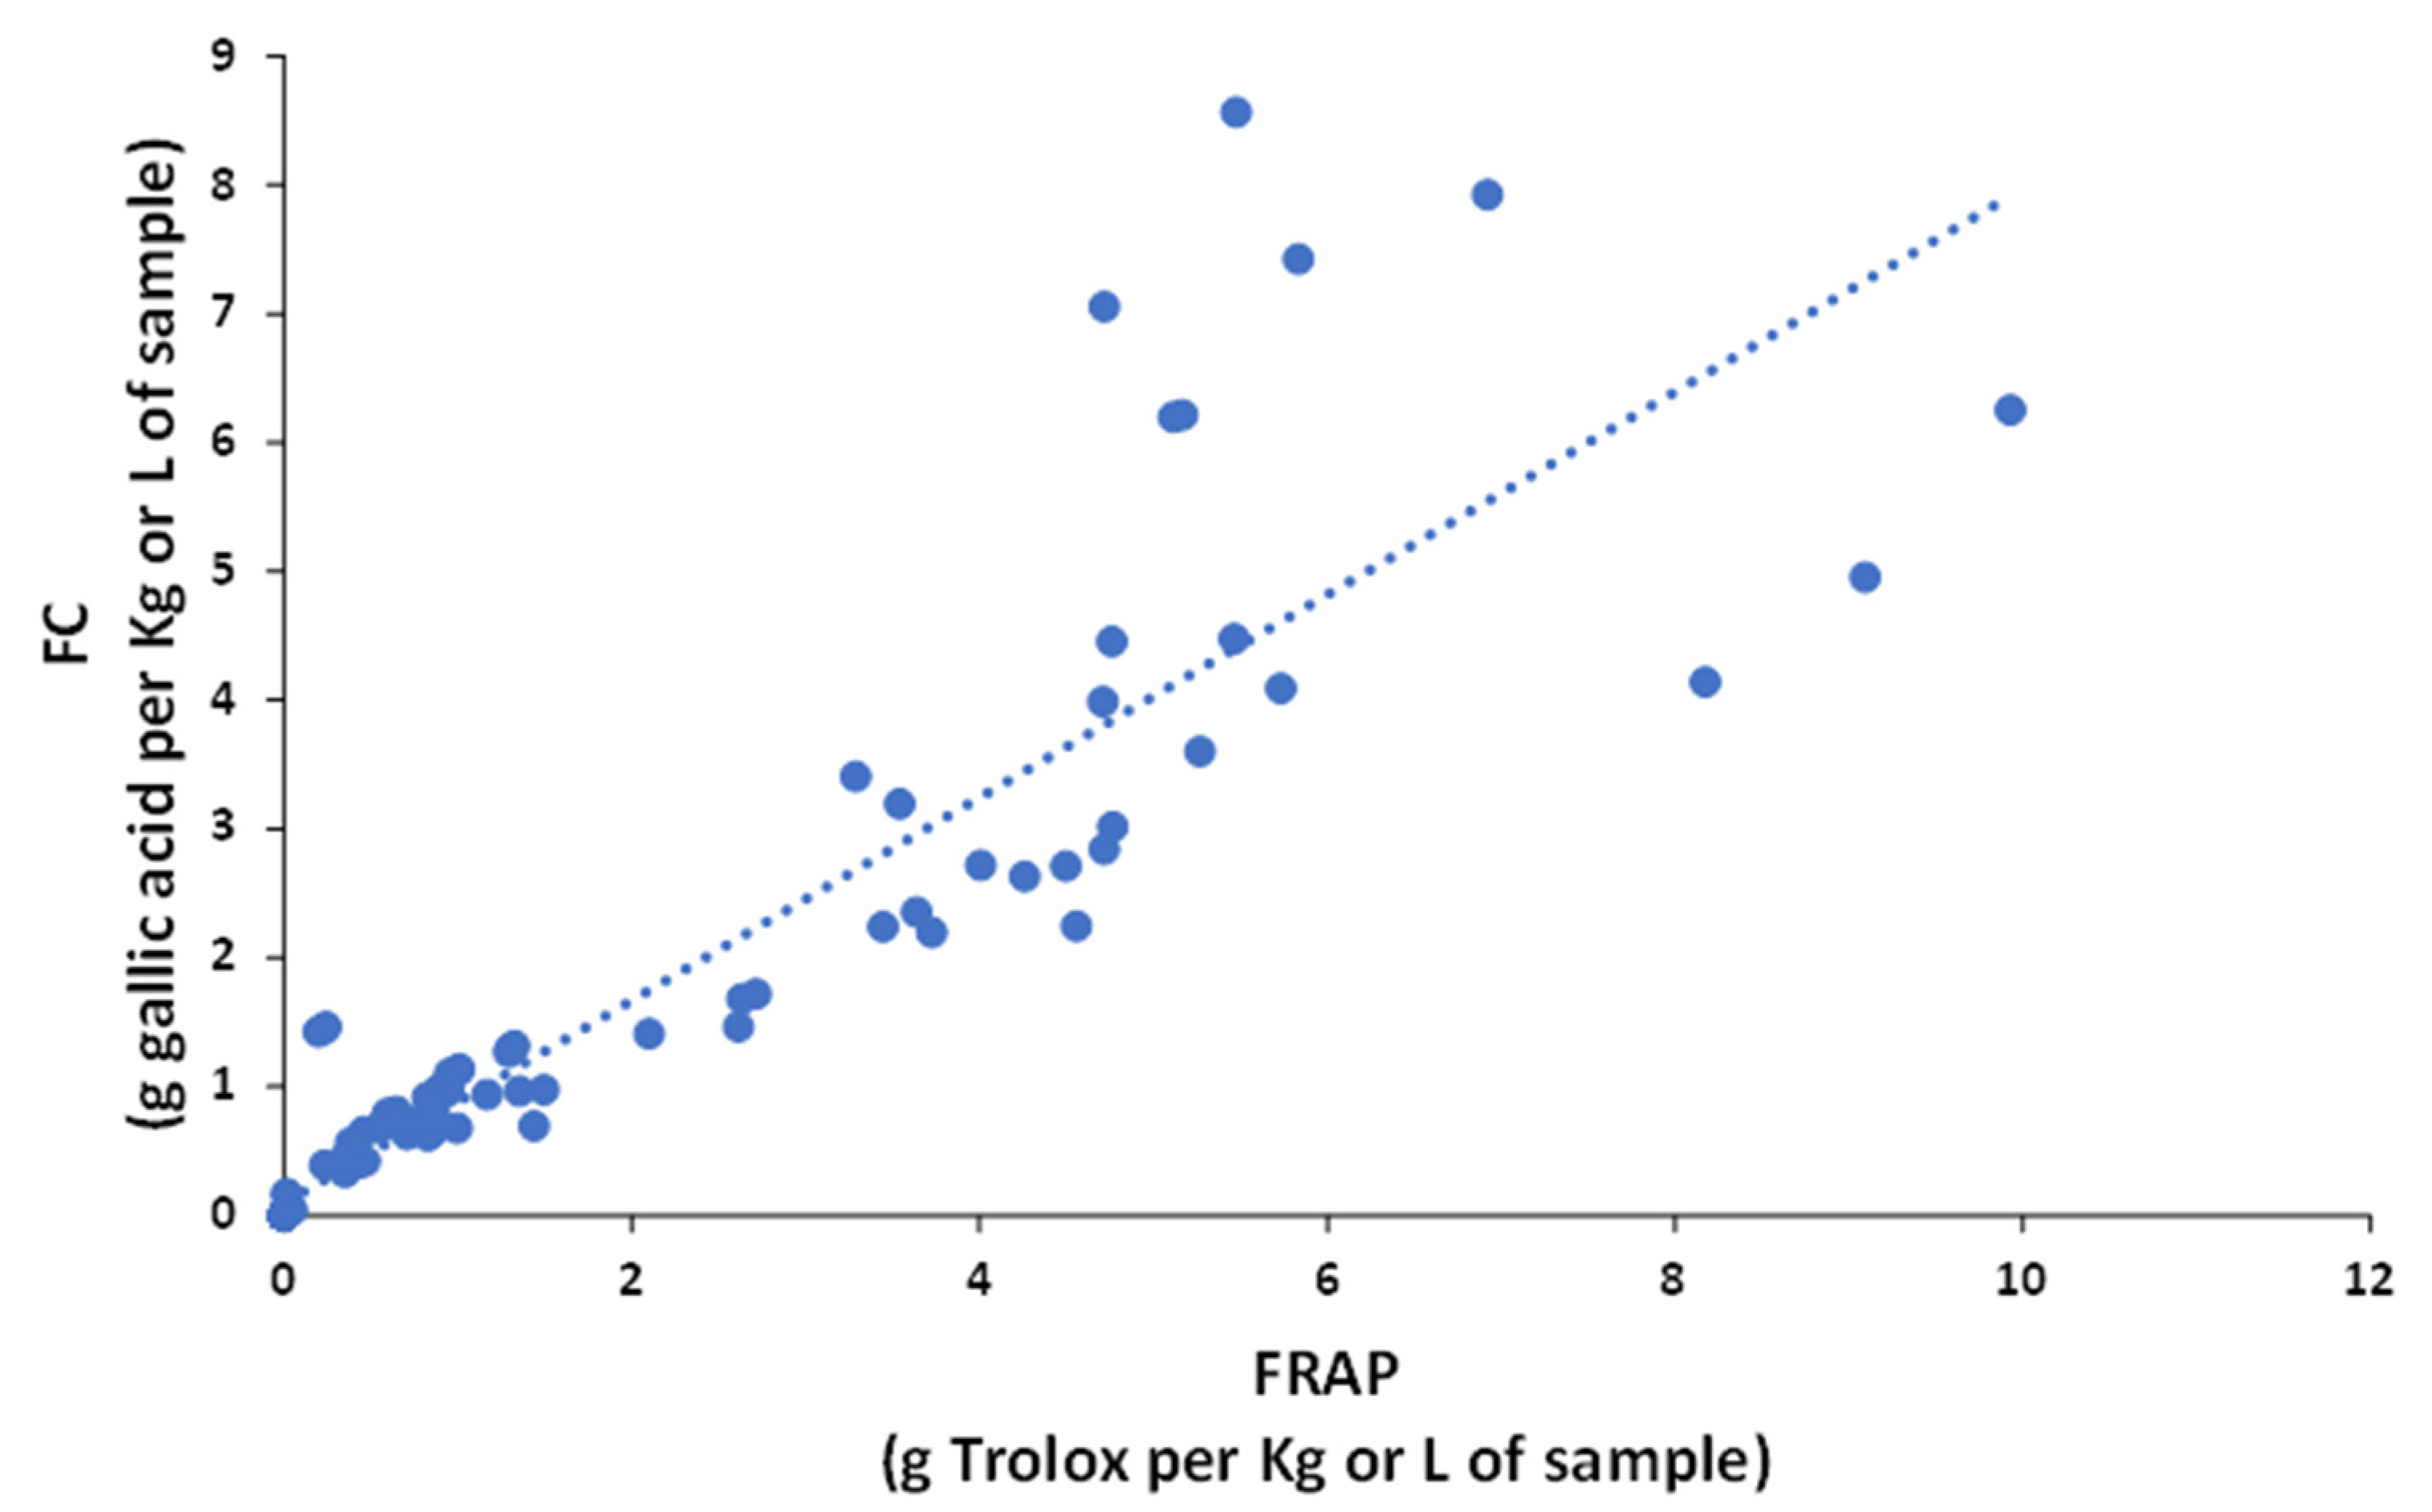
Figure 3. Correlation of the antioxidant capacity between Folin–Ciocalteu (FC) and FRAP.
The antioxidant power by FC and FRAP were also compared with the total polyphenolic content estimated by HPLC–UV. This parameter, relying on the total area of chromatographic peaks detected at 280 nm, was found to be an excellent descriptor of the overall phenolic concentration, so researchers expected a reasonable correlation with the antioxidant capacity of the samples. In the two cases, correlations were statistically significant (p < 0.05), with determination coefficients of 0.8595 and 0. 7755, respectively. These findings suggested that the vast majority of compounds detected at 280 nm displayed phenolic moieties in their structures that, eventually, provided antioxidant capacity. In this case, the redox processes involved were mainly related to the oxidation of phenolic groups to quinones.
3.4. Correlation between HPLC Fingerprints and Spectrophotometric Indices by PLS
PLS was applied to investigate the possibility of estimating the antioxidant capacity from the chromatographic data. The PLS analysis was conducted with HPLC–UV fingerprints at 280 nm as the X-matrix and the antioxidant capacities of the samples for FC or FRAP indices in the Y-matrix. As indicated above, UV chromatograms at 280 nm were taken in the working range of 1.15 to 25.95 min, in which those relevant compounds were eluted, while avoiding interferences from the chromatographic front and cleaning range. In any case, a PCA model was built to remove the outliers from the exploration of the graphics of Q residuals vs. Hotelling’s T2.
For the regression model using FC results, six LVs were found optimal to carry out the calibration, as was deduced by cross validation (CV) under a Venetian blind approach. In these circumstances, the variance explained was 77.53% for the X-block and 99.63% for the Y-block. Figure 4a shows the scatter plot of FC indices measured vs. FC indices predicted by cross-validation using PLS. As can be seen, the prediction was accurate, with a R2 of CV of 0.983.
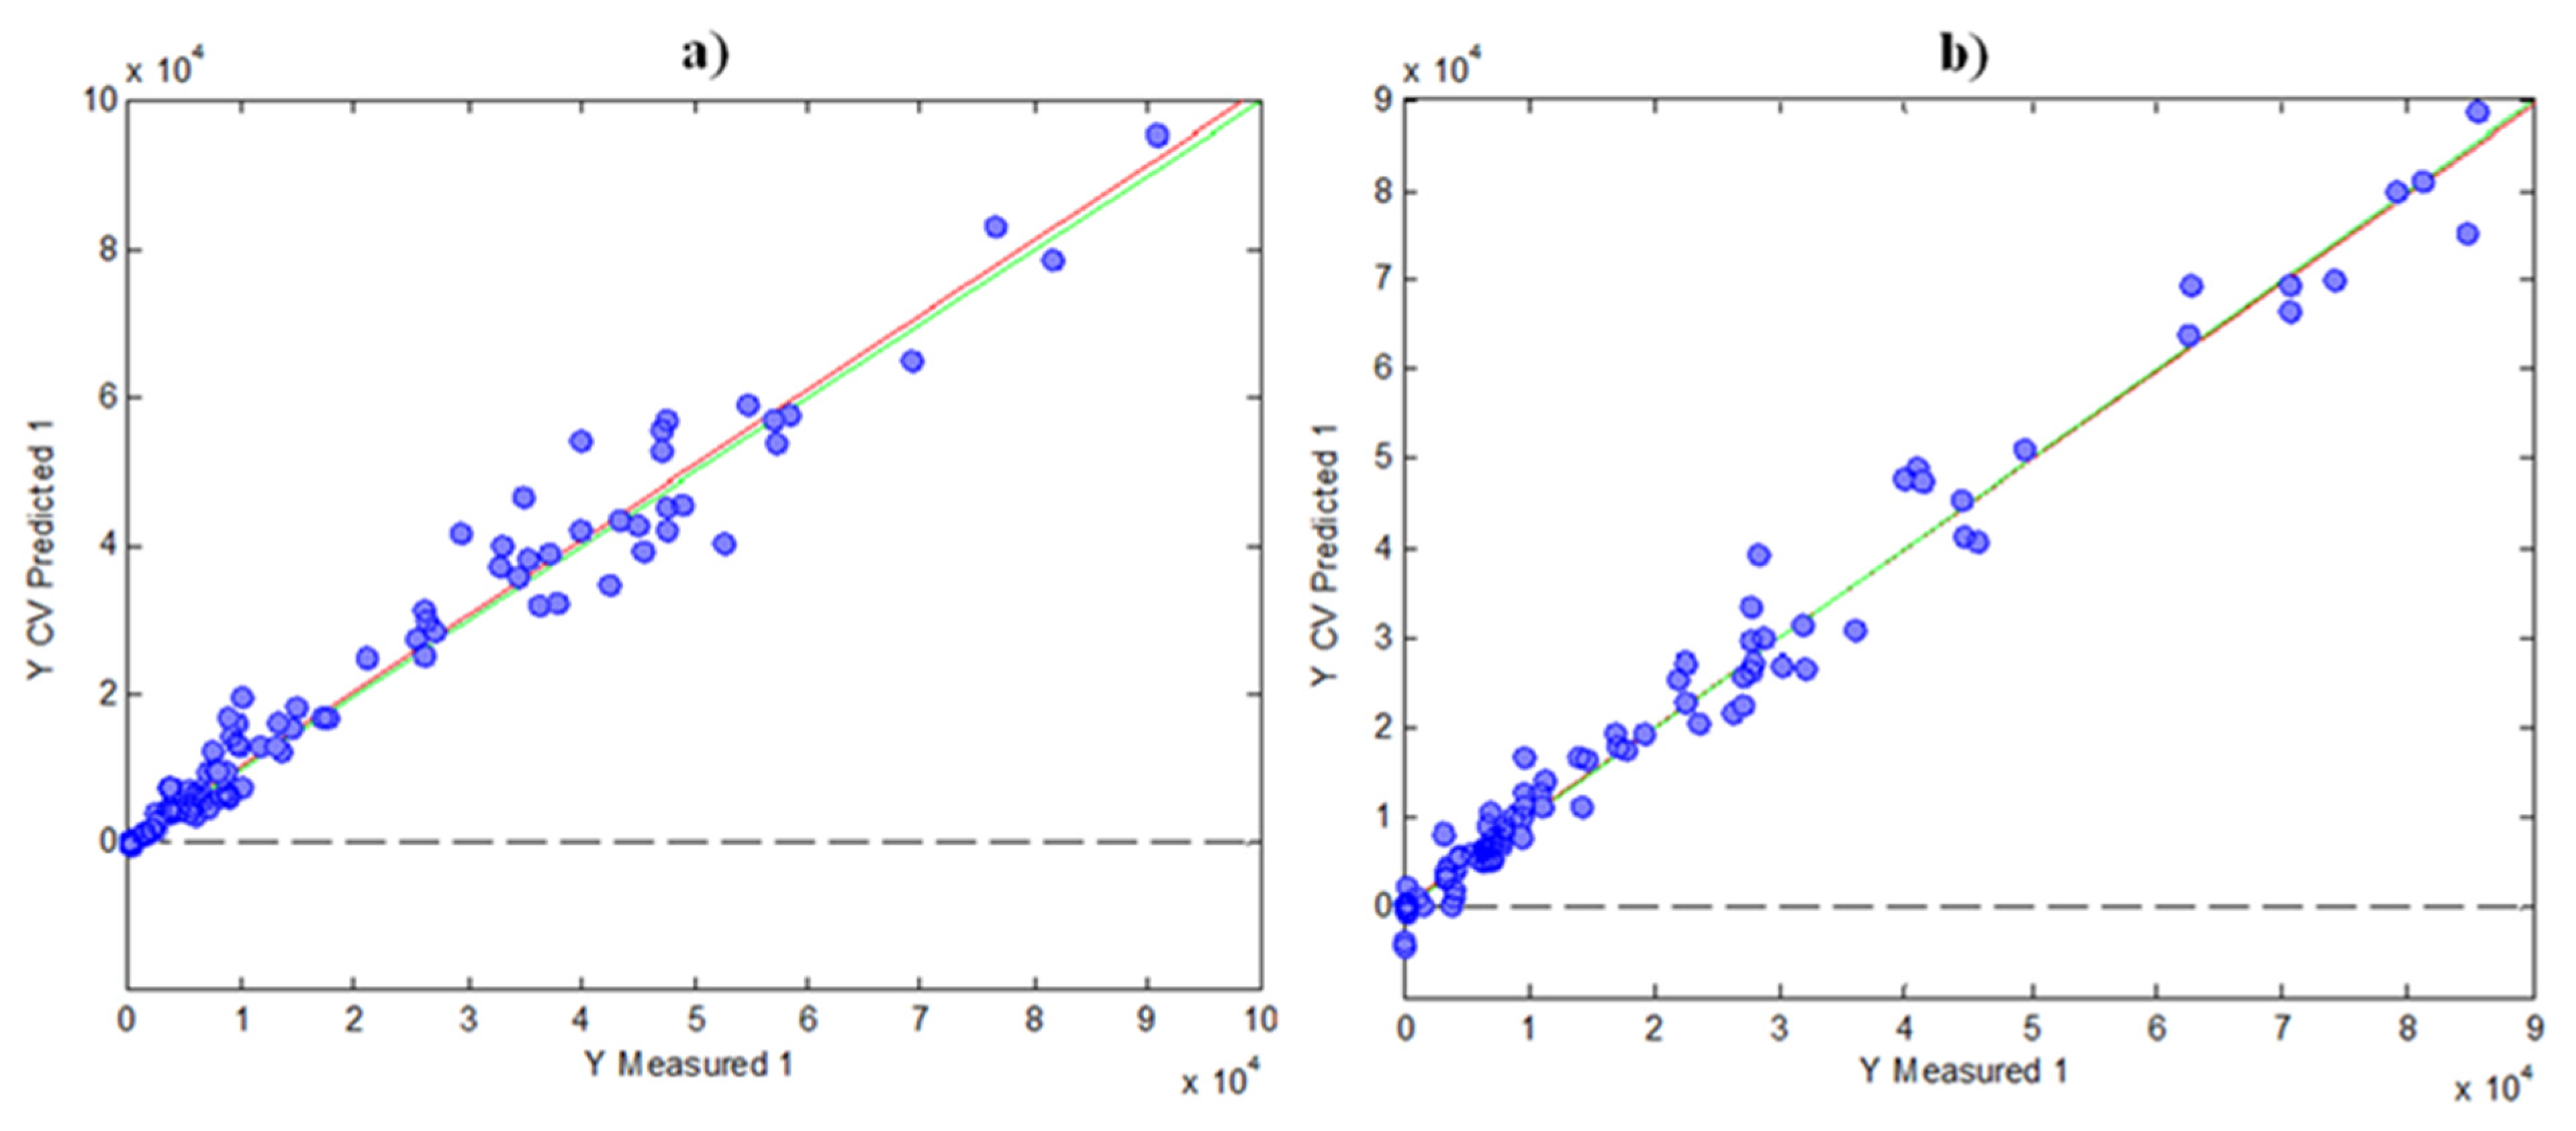
Figure 4. Graphics of Y measured vs. Y CV predicted for PLS models by using the data of indices as matrix Y: (a) FC; (b) FRAP.
For the FRAP prediction, a PLS model using HPLC fingerprints and FRAP results was built in a similar way, as in the case of FC. Four LVs were found optimal in this case, with a variance explained of 73.50% for the X-block and 98.16% for the Y-block. Figure 4b shows the measured FRAP values vs. CV-predicted FRAP values, in which the R2 of CV was 0.971. Again, these results indicate a good prediction with the two models, having a high correlation with the HPLC data.
The regression vector for the prediction of antioxidant indices from the chromatographic fingerprints by the FC and FRAP models showed that the differences between the two indices depend principally on the sensitivities to different polyphenolic compounds, since the same zones on the chromatograms positively affect both indices.
References
- Šeruga, M.; Novak, I.; Jakobek, L. Determination of Polyphenols Content and Antioxidant Activity of Some Red Wines by Differential Pulse Voltammetry, HPLC and Spectrophotometric Methods. Food Chem. 2011, 124, 1208–1216.
- Vidal-Casanella, O.; Nunez, O.; Granados, M.; Saurina, J.; Sentellas, S. Analytical Methods for Exploring Nutraceuticals Based on Phenolic Acids and Polyphenols. App. Sci. 2021, 11, 8276.
- Ebner, H.; Dienstbach, F.; Sandritter, W. Hormonelle Beeinflussung des experimentellen Portiocarcinoms. Natl. Libr. Med. 1967, 73, 366–369.
- Re, R.; Pellegrini, N.; Proteggente, A.; Pannala, A.; Yang, M.; Rice-Evans, C. Antioxidant Activity Applying an Improved ABTS Radical Cation Decolorization Assay. Free Radic. Biol. Med. 1999, 26, 1231–1237.
- Brand-Williams, W.; Cuvelier, M.E.; Berset, C. Use of a Free Radical Method to Evaluate Antioxidant Activity. LWT Food Sci. Technol. 1995, 28, 25–30.
- Alcalde, B.; Granados, M.; Saurina, J. Exploring the Antioxidant Features of Polyphenols by Spectroscopic and Electrochemical Methods. Antioxidants 2019, 8, 523.
- Everette, J.D.; Bryant, Q.M.; Green, A.M.; Abbey, Y.A.; Wangila, G.W.; Walker, R.B. Thorough Study of Reactivity of Various Compound Classes toward the Folin-Ciocalteu Reagent. J. Agric. Food Chem. 2010, 58, 8139–8144.
- Apak, R.; Özyürek, M.; Güçlü, K.; Çapanoʇlu, E. Antioxidant Activity/Capacity Measurement. 1. Classification, Physicochemical Principles, Mechanisms, and Electron Transfer (ET)-Based Assays. J. Agric. Food Chem. 2016, 64, 997–1027.
- Ou, B.; Huang, D.; Hampsch-Woodill, M.; Flanagan, J.A.; Deemer, E.K. Analysis of Antioxidant Activities of Common Vegetables Employing Oxygen Radical Absorbance Capacity (ORAC) and Ferric Reducing Antioxidant Power (FRAP) Assays: A Comparative Study. J. Agric. Food Chem. 2002, 50, 3122–3128.
- Tapia-Quiros, P.; Montenegro-Landivar, M.F.; Reig, M.; Vecino, X.; Alvarino, T.; Cortina, J.L.; Saurina, J.; Granados, M. Olive Mill and Winery Wastes as Viable Sources of Bioactive Compounds: A Study on Polyphenols Recovery. Antioxidants 2020, 9, 1074.
- Bakhytkyzy, I.; Nunez, O.; Saurina, J. Determination of flavanols by liquid chromatography with fluorescence detection. Application to the characterization of cranberry-based pharmaceuticals through profiling and fingerprinting approaches. J. Pharm. Biomed. Anal. 2018, 156, 206–213.
- Vidal-Casanella, O.; Arias-Alpizar, K.; Nuñez, O.; Saurina, J. Hydrophilic Interaction Liquid Chromatography to Characterize Nutraceuticals and Food Supplements Based on Flavanols and Related Compounds. Separations 2021, 8, 17.
- Izquierdo-Llopart, A.; Saurina, J. Liquid Chromatographic Approach for the Discrimination and Classification of Cava Samples Based on the Phenolic Composition Using Chemometric Methods. Beverages 2020, 6, 54.
- Vidal-Casanella, O.; Nunez, N.; Sentellas, S.; Nunez, O.; Saurina, J. Characterization of Turmeric and Curry Samples by Liquid Chromatography with Spectroscopic Detection Based on Polyphenolic and Curcuminoid Contents. Separations 2020, 7, 23.
- Barbosa, S.; Campmajo, G.; Saurina, J.; Puignou, L.; Nunez, O. Determination of Phenolic Compounds in Paprika by Ultrahigh Performance Liquid Chromatography-Tandem Mass Spectrometry: Application to Product Designation of Origin Authentication by Chemometrics. J. Agric. Food Chem. 2020, 68, 591–602.
- Barbosa, S.; Pardo-Mates, N.; Hidalgo-Serrano, M.; Saurina, J.; Puignou, L.; Nunez, O. Detection and Quantitation of Frauds in the Authentication of Cranberry-Based Extracts by UHPLC-HRMS (Orbitrap) Polyphenolic Profiling and Multivariate Calibration Methods. J. Agric. Food Chem. 2018, 66, 9353–9365.
- Pardo-Mates, N.; Vera, A.; Barbosa, S.; Hidalgo-Serrano, M.; Nunez, O.; Saurina, J.; Hernandez-Cassou, S.; Puignou, L. Characterization, classification and authentication of fruit-based extracts by means of HPLC-UV chromatographic fingerprints, polyphenolic profiles and chemometric methods. Food Chem. 2017, 221, 29–38.
- Alén-Ruiz, F.; García-Falcón, M.S.; Pérez-Lamela, M.C.; Martínez-Carballo, E.; Simal-Gándara, J. Influence of Major Polyphenols on Antioxidant Activity in Mencía and Brancellao Red Wines. Food Chem. 2009, 113, 53–60.
More
Information
Subjects:
Chemistry, Analytical
Contributors
MDPI registered users' name will be linked to their SciProfiles pages. To register with us, please refer to https://encyclopedia.pub/register
:
View Times:
1.1K
Revisions:
3 times
(View History)
Update Date:
06 Apr 2022
Table of Contents


Notice
You are not a member of the advisory board for this topic. If you want to update advisory board member profile, please contact office@encyclopedia.pub.
OK
Confirm
Only members of the Encyclopedia advisory board for this topic are allowed to note entries. Would you like to become an advisory board member of the Encyclopedia?
Yes
No
${ textCharacter }/${ maxCharacter }
Submit
Cancel
Back
Comments
${ item }
|
${ item.createdUser.fullName }
${ item.createdAt }
${ item.vote }
${ item.reply }
Delete
${ reply.createdUser.fullName }
${ reply.createdAt }
${ reply.vote }
Delete
There is no reply to this comment~
${ item.replyTextCharacter }/${ item.replyMaxCharacter }
Submit
Cancel
More
No more~
There is no comment~
${ textCharacter }/${ maxCharacter }
Submit
Cancel
${ selectedItem.replyTextCharacter }/${ selectedItem.replyMaxCharacter }
Submit
Cancel
Confirm
Are you sure to Delete?
Yes
No