Submitted Successfully!
To reward your contribution, here is a gift for you: A free trial for our video production service.
Thank you for your contribution! You can also upload a video entry or images related to this topic.
Version Summary Created by Modification Content Size Created at Operation
1 -- 3082 2022-03-30 05:55:39 |
2 revision + 611 word(s) 3693 2022-03-30 06:05:28 | |
3 format correct -1787 word(s) 1906 2022-03-31 06:19:28 |

Video Upload Options

Do you have a full video?

Confirm

Are you sure to Delete?
Cite
If you have any further questions, please contact Encyclopedia Editorial Office.
Qi, W. Infrared Spectroscopy Technology. Encyclopedia. Available online: https://encyclopedia.pub/entry/21154 (accessed on 20 August 2024).
Qi W. Infrared Spectroscopy Technology. Encyclopedia. Available at: https://encyclopedia.pub/entry/21154. Accessed August 20, 2024.
Qi, Wenliang. "Infrared Spectroscopy Technology" Encyclopedia, https://encyclopedia.pub/entry/21154 (accessed August 20, 2024).
Qi, W. (2022, March 30). Infrared Spectroscopy Technology. In Encyclopedia. https://encyclopedia.pub/entry/21154
Qi, Wenliang. "Infrared Spectroscopy Technology." Encyclopedia. Web. 30 March, 2022.
Infrared Spectroscopy Technology
Edit

Food or raw materials themselves contain substances that may endanger human health and are called toxic and harmful substances in food, which can be divided into endogenous, exogenous toxic, and harmful substances and biological toxins. Therefore, realizing the rapid, efficient, and nondestructive testing of toxic and harmful substances in food is of great significance to ensure food safety and improve the ability of food safety supervision. Among the nondestructive detection methods, infrared spectroscopy technology has become a powerful solution for detecting toxic and harmful substances in food with its high efficiency, speed, easy operation, and low costs, while requiring less sample size and is nondestructive, and has been widely used in many fields.

infrared spectroscopy toxic substance

1. Introduction

With the rapid development of the food industry, China’s food safety level is constantly improving. However, it still faces many problems, such as illegal food additives and the abuse of antibiotics. The quality and safety of food involve everyone’s health and safety. Such problems not only exist in individual countries but also present as a global problem. For instance, “melamine” and the “Sudan red duck egg” event, among others, have brought fatal consequences [1][2]. According to the different sources of harmful substances, they can be divided into three kinds: endogenous, exogenous toxic and harmful substances, and microbial toxins. Endogenous toxic and harmful substances can be divided into endogenous toxins and toxic substances produced in processing. Endogenous toxins include toxic proteins, alkaloids, phenols in plant-derived agricultural products [3][4][5], tetrodotoxin, shellfish toxin, and so on, in animal-derived agricultural products [6][7]. Exogenous toxic and harmful substances mainly come from the external environment, and pollution to food, such as pesticides. They may occur in every link of the food supply chain [8], from the contamination of veterinary drugs [9], heavy metals and harmful elements [10], and from using food additives, antibiotics, dioxins, and their analogs. Microbial toxins consist mainly of bacterial and fungal toxins, such as cyanobacteria toxins, aflatoxin, etc. [11][12].
For different kinds of toxic and harmful substances, the commonly used detection methods are gas chromatography (GC), high-performance liquid chromatography (HPLC), gas chromatography–mass spectrometry combined technology (GC-MS), liquid chromatography–mass spectrometry (LC-MS), enzyme-linked immunosorbent assay (ELISA), etc. [13][14][15]. Most of these methods have high requirements for high-cost instruments and complex sample preprocessing. Infrared spectroscopy technology is widely used in the detection of toxic and harmful components in food with its fast, nondestructive, efficient, and convenient operation. This technology is also a common detection method in modern structural chemistry and analytical chemistry. The characteristics of the molecular structure can be distinguished according to the position and intensity of the infrared absorption peak. The absorption peak intensity of the spectra is positively correlated with its chemical group content. Therefore, it becomes the principal method for detecting toxic and harmful substances in food.

2. Principle of Infrared Spectroscopy Technology

Infrared spectroscopy is an analytical method for using intermolecular vibrations to identify molecular structures. When an infrared light source with a continuous wavelength radiates the measured object, the infrared light at a specific frequency is absorbed by a specific molecule corresponding to the characteristic bond in the sample molecule that selectively absorbs light from the infrared region of the electromagnetic spectrum, causing molecular vibration. The absorption specificity corresponds to the characteristic chemical bonds in the sample molecule. Generally, the infrared spectral interval is divided into three regions, namely, the near-infrared region (12,800~4000 cm−1), mid-infrared region (4000–400 cm−1), and far-infrared region (400–10 cm−1) [16].

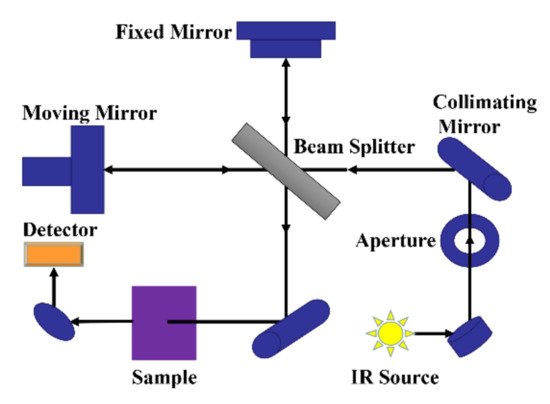
3. Fourier Transform Infrared Spectrometer Principle

Fourier transform infrared spectrometer is the mainstream instrument used for infrared spectroscopy analysis. Figure 1 is a schematic diagram of the optical system of the Fourier transform infrared spectrometer, mainly composed of the fixed mirror, moving mirror, beam splitter, appendix, light source, etc. The light from the light source reaches the beam separator through the collimated lens, which is divided into two beams: one beam through the transmission to the moving lens, and the other beam by reflection on the fixed mirror. Two beams of light are reflected by the fixed mirror and the moving mirror and return to the beam splitter. The moving mirror is moving at a constant speed, so the two beams of light through the beam splitter form the light range difference and produce interference. Interferometric light passes through the sample pool after the beam splitter meets, through which the interference light containing the sample information reaches the detector, and then processes the signal by the Fourier transform to finally obtain an infrared absorption spectrogram of transmittance or absorbance with a wavenumber or wavelength.
Figure 1. Schematic diagram of the optical system of the mid-infrared spectrometer.
There are four main Fourier transform infrared detection modes: transmission, attenuated total reflection (ATR), mirror reflection, and diffuse reflection mode. Users can choose appropriate detection methods according to different detection needs and physical states of the sample. Solid samples can be detected by transmission spectroscopy, attenuation full reflection spectroscopy, etc. Liquid samples can be detected by transmission spectroscopy of an infrared liquid pool or reflection spectrum of attenuated full reflection accessories.

4. Principle of Near-Infrared Spectroscopy

Near-infrared spectroscopy (NIR) is an instrument detecting molecular vibration spectra ranging from 12,800 to 4000 cm−1. The near-infrared spectra mainly absorb C-C, O-H, C-H, N-H, S-H, etc. [17]. The double and co-frequency of group vibrations contain component information of most organic compounds. NIR spectroscopy is efficient, fast, nondestructive, and requires no sample pretreatment, being advantageous in the quality control of food, biological, medicinal, and chemical products [18][19]. Modern infrared spectroscopy is a fusion of spectral measurement, computer science, chemometrics, and basic detection [20][21].
In the qualitative analysis, the NIR spectrum is related to the chemical composition and content of the material itself, and the same chemical composition. The material structure and content of the sample determine the attribute characteristics of the sample. The NIR spectrum is used as a variable to establish the correspondence between the sample genus and the NIR spectrum, which is then applied to the NIR spectrum to calculate and obtain the genus or characteristics of the sample [22]. Changes in the sample composition in quantitative NIR spectral analysis have caused changes in sample properties and also changes in molecular spectra. There is a correlation between the sample composition concentration or properties and the corresponding molecular spectral changes. By establishing the correction model using a multivariate correction method and applying the model, unknown sample spectra can be obtained to achieve a quantitative prediction of single or multiple composition concentrations or properties [23].

5. Detection of Exogenous Toxic and Harmful Substances

During the production and processing of food or raw materials, contamination may be caused by various external causes and illegal human factors. The detection of such substances by infrared spectroscopy is of great importance.
Arzu Yazici et al. [24] established a method for rapid nondestructive detection of pesticide residues in strawberries based on near-infrared spectroscopy. By performing the second-order derivative, principal component analysis (PCA) on the spectral data, the prediction models for aminopyralid and azoxystrobin were developed using PLSR: the prediction correlation coefficient (RP) for aminopyralid was 0.93, the root mean square error of prediction (RMSEP) was 3.22 mg kg−1, and the relative prediction error (RPD) was 2.28. The prediction correlation coefficient (RP) for azoxystrobin was 0.91. Lu et al. [25] used visible-NIR spectroscopy combined with chemometric methods to quantify chlorpyrifos and carbendazim residues in cabbage. The quantitative models were developed using the partial least squares regression (PLSR) and least squares support vector machine (LS-SVM) methods. The feature variables were selected using the continuous projection algorithm (SPA), random frog algorithm, and PLSR methods. The LS-SVM model performed better than the PLSR model. The prediction correlation coefficient (RP) of chlorpyrifos samples was 1 and the root mean square error of prediction (RMSEP) was 0.03 mg kg−1. The average spiked recoveries ranged from 98.95–102.26% and the relative prediction errors ranged from 0.88–9.97% when the chlorpyrifos concentration was greater than 5 mg kg−1. The prediction correlation coefficient (RP) of chlorpyrifos samples was close to 1, the prediction mean-spiked recoveries ranged from 99.10% to 100.66%, and the relative prediction errors ranged from 0.39% to 5.01% when the concentration of carbendazim was greater than 1 mg kg−1, and the two samples had good consistency and reproducibility.
Liu et al. [26] investigated a method based on the radial basis function (RBF) neural network combined with NIR spectral data to predict the talc content in wheat flour. In this method, sample data were processed by multiple scattering correction, and the correlation coefficient method was used to reduce the spectral redundancy to determine the maximum relevant information wavelength. The prediction correlation coefficient (RP) of the optimal MSC-CCM-RBF model was 0.9999, the root mean square error of prediction (RMSEP) was 0.0765, and the relative prediction error (RPD) was 65.0909. Che et al. [27] used Vis-NIR reflectance spectroscopy based on physical property analysis to predict the concentration of azodicarbonyl in flour. An amount of 101 samples with a concentration gradient of 3 mg kg−1 were prepared using a stepwise dilution method in the concentration range of 0–300 mg kg−1. The abnormal samples were identified and rejected by combining the Marxian distance method and leave-one-out cross-validation, and the radial basis function model could better predict the concentration of azodicarbonyl in flour by selecting the characteristic band through correlation and using the preprocessing method of the first-order derivatives and SNV. The method yielded prediction correlation coefficients and the root mean square error of prediction (RMSEP) of 0.99996 and 0.5467, which were within 0.01 for each sample, and LOD and LOQ of 3.2 and 9.7 mg kg−1, respectively. Li et al. [28] used Fourier transform transmission infrared (FTIR) spectrometry to determine Pb–Cr green in green tea. Partial least squares discrimination (PLS-DA) was used for the qualitative analysis of Pb–Cr green, and the classification was 100% correct. The interval partial least squares (iPLS) regression combined with the successive projection algorithm (SPA) was proposed to select the characteristic wavenumbers for quantitative analysis of Pb–Cr green, and the least squares support vector machine algorithm (LS-SVM) was used to obtain the optimal model with RP2 of 0.864 and a root mean square error of prediction (RMSEP) of 0.291. The results showed that infrared spectrometry was feasible for the detection of Pb–Cr green in green tea. Kurrey et al. [29] used diffuse reflectance Fourier transform infrared spectroscopy (DRS-FTIR) for the rapid quantitative determination of antibiotics, ciprofloxacin (CIP), and norfloxacin (NOR) in poultry egg samples. The linear range of DRS-FTIR for the detection of CIP and NOR in poultry egg yolk was 0.05–0.50 ng mL−1, the limits of detection (LODs) were 0.032 ng mL−1, and the recoveries were 83.1%-102.3%. The method is simple, sensitive and suitable for high-throughput analysis of food samples. Gu et al. [30] studied the chemical morphological changes of squid immersed in different concentrations of formaldehyde using three infrared spectra (FTIR, SD-IR, and 2DCOS-IR). The predicted values of the constructed model were close to the actual formaldehyde concentration values in squid, with a prediction correlation coefficient of 0.9774, a root mean square error of prediction (RMSEP) of 6.08 and a limit of quantification of 15 mg kg−1. The method took 5 min to determine formaldehyde, while the HPLC method took 1.5 h to determine formaldehyde.
The analysis of the above studies shows that infrared spectroscopy is a good technique for the nondestructive detection of pesticide residues in fruits and vegetables, illegal additives in flour and green tea, and antibiotics in eggs. However, differences in the manufacturers of fruits, vegetables, and eggs from different origins and illegal additives used in the experiments may lead to the differentiation of the final models. Therefore, the establishment of a set of standardized and perfect data models for detecting illegal food additives, pesticides, and antibiotics could well improve the universality of the models and broaden the application of this technology.

References

  1. Dhakal, S.; Schmidt, W.F.; Kim, M.; Tang, X.; Peng, Y.; Chao, K. Detection of Additives and Chemical Contaminants in Turmeric Powder Using FT-IR Spectroscopy. Foods 2019, 8, 143.
  2. Li, Q.; Song, P.; Wen, J.G. Melamine and food safety: A 10-year review. Curr. Opin. Food Sci. 2019, 30, 79–84.
  3. Koike, H.; Kanda, M.; Hayashi, H.; Matsushima, Y.; Ohba, Y.; Nakagawa, Y.; Nagano, C.; Sekimura, K.; Hirai, A.; Shindo, T.; et al. Identification and quantification of cereulide in cow’s milk using liquid chromatography-tandem mass spectrometry. Food Addit. Contam. Part A 2020, 37, 1359–1373.
  4. Hungerford, N.L.; Carter, S.J.; Anuj, S.R.; Tan, B.L.L.; Hnatko, D.; Martin, C.L.; Sharma, E.; Yin, M.; Nguyen, T.T.P.; Melksham, K.J.; et al. Analysis of Pyrrolizidine Alkaloids in Queensland Honey: Using Low Temperature Chromatography to Resolve Stereoisomers and Identify Botanical Sources by UHPLC-MS/MS. Toxins 2019, 11, 726.
  5. Xu, X.Q.; Liu, A.M.; Hu, S.Y.; Ares, I.; Martínez-Larrañaga, M.R.; Wang, X.; Martínez, M.; Anadón, A.; Martínez, M.A. Synthetic phenolic antioxidants: Metabolism, hazards and mechanism of action. Food Chem. 2021, 353, 129488.
  6. Biessy, L.; Boundy, M.J.; Smith, K.F.; Harwood, D.T.; Hawes, I.; Wood, S.A. Tetrodotoxin in marine bivalves and edible gastropods: A mini-review. Chemosphere 2019, 236, 124404.
  7. Li, J.; Persson, K.M. Quick detection method for paralytic shellfish toxins (PSTs) monitoring in freshwater-A review. Chemosphere 2021, 265, 128591.
  8. Beneito-Cambra, M.; Gilbert-López, B.; Moreno-González, D.; Bouza, M.; Franzke, J.; García-Reyes, J.F.; Molina-Díaz, A. Ambient (desorption/ionization) mass spectrometry methods for pesticide testing in food: A review. Anal. Methods 2020, 12, 4831–4852.
  9. Colombo, R.; Papetti, A. Advances in the Analysis of Veterinary Drug Residues in Food Matrices by Capillary Electrophoresis Techniques. Molecules 2019, 24, 4617.
  10. Sivakumar, R.; Lee, N.Y. Rapid one-pot synthesis of PAM-GO-Ag nanocomposite hydrogel by gamma-ray irradiation for remediation of environment pollutants and pathogen inactivation. Chemosphere 2021, 275, 130096.
  11. Brown, K.; Mugoh, M.; Call, D.R.; Omulo, S. Antibiotic residues and antibiotic-resistant bacteria detected in milk marketed for human consumption in Kibera, Nairobi. PLoS ONE 2020, 15, e0233413.
  12. Neng, J.; Zhang, Q.; Sun, P. Application of Surface-enhanced Raman Spectroscopy in Fast Detection of Toxic and Harmful Substances in food. Biosens. Bioelectron. 2020, 167, 112480.
  13. Li, J.X.; Teng, X.Y.; Wang, W.W.; Zhang, Z.J. Determination of multiple pesticide residues in teas by gas chromatography with accurate time-of-flight mass spectrometry. J. Sep. Sci. 2019, 42, 1990–2002.
  14. Zeki, Ö.C.; Eylem, C.C.; Reçber, T.; Kır, S.; Nemutlu, E. Integration of GC-MS and LC-MS for untargeted metabolomics profiling. J. Pharm. Biomed. Anal. 2020, 190, 113509.
  15. Li, H.; Li, Y.T.; Jiang, J.Q.; Li, R.F.; Fan, G.Y.; Lv, J.M.; Zhou, Y.; Zhang, W.J.; Wang, Z.L. Development of a Direct Competitive ELISA Kit for Detecting Deoxynivalenol Contamination in Wheat. Molecules 2019, 25, 50.
  16. Beć, K.B.; Grabska, J.; Huck, C.W. Biomolecular and bioanalytical applications of infrared spectroscopy-A review. Anal. Chim. Acta 2020, 1133, 150–177.
  17. Tian, Y.L.; Gao, X.J.; Qi, W.L.; Wang, Y.; Wang, X.; Zhou, J.C.; Lu, D.L.; Chen, B. Advances in differentiation and identification of foodborne bacteria using near infrared spectroscopy. Anal. Methods 2021, 13, 2558–2566.
  18. Shi, Y.Y.; Du, M.Y.; Ren, J.; Zhang, K.L.; Xu, Y.C.; Kong, X.L. Application of Infrared Multiple Photon Dissociation (IRMPD) Spectroscopy in Chiral Analysis. Molecules 2020, 25, 5152.
  19. Tian, W.F.; Tong, J.Y.; Zhu, X.Y.; Martin, P.F.; Li, Y.H.; He, Z.H.; Zhang, Y. Effects of Different Pilot-Scale Milling Methods on Bioactive Components and End-Use Properties of Whole Wheat Flour. Foods 2021, 10, 2857.
  20. Qi, W.L.; Xiong, Z.X.; Tang, H.T.; Lu, D.L.; Chen, B. Compact near-infrared spectrometer for quantitative determination of wood composition. J. Appl. Spectrosc. 2021, 88, 461–467.
  21. Amirvaresi, A.; Nikounezhad, N.; Amirahmadi, M.; Daraei, B.; Parastar, H. Comparison of near-infrared (NIR) and mid-infrared (MIR) spectroscopy based on chemometrics for saffron authentication and adulteration detection. Food Chem. 2021, 344, 128647.
  22. Cozzolino, D. The Ability of Near Infrared (NIR) Spectroscopy to Predict Functional Properties in Foods: Challenges and Opportunities. Molecules 2021, 26, 6981.
  23. Liu, C.M.; Han, Y.; Min, S.G.; Jia, W.; Meng, X.; Liu, P.P. Rapid qualitative and quantitative analysis of methamphetamine, ketamine, heroin, and cocaine by near-infrared spectroscopy. Forensic Sci. Int. 2018, 290, 162–168.
  24. Yazici, A.; Tiryaki, G.Y.; Ayvaz, H. Determination of pesticide residual levels in strawberry (Fragaria) by near-infrared spectroscopy. J. Sci. Food Agric. 2020, 100, 1980–1989.
  25. Lu, Y.; Li, X.L.; Li, W.J.; Shen, T.T.; He, Z.N.; Zhang, M.Q.; Zhang, H.; Sun, Y.Q.; Liu, F. Detection of chlorpyrifos and carbendazim residues in the cabbage using visible/near-infrared spectroscopy combined with chemometrics. Spectrochim. Acta Part. A Mol. Biomol. Spectrosc. 2021, 257, 119759.
  26. Liu, Y.; Sun, L.J.; Ran, Z.Y.; Pan, X.Y.; Zhou, S.; Liu, S.C. Prediction of Talc Content in Wheat Flour Based on a Near-Infrared Spectroscopy Technique. J. Food Prot. 2019, 82, 1655–1662.
  27. Che, W.K.; Sun, L.J.; Zhang, Q.; Zhang, D.; Ye, D.D.; Tan, W.Y.; Wang, L.K.; Dai, C.J. Application of Visible/Near-Infrared Spectroscopy in the Prediction of Azodicarbonamide in Wheat Flour. J. Food Sci. 2017, 82, 2516–2525.
  28. Li, X.L.; Xu, K.W.; Zhang, Y.Y.; Sun, C.J.; He, Y. Optical Determination of Lead Chrome Green in Green Tea by Fourier Transform Infrared (FT-IR) Transmission Spectroscopy. PLoS ONE 2017, 12, e0169430.
  29. Kurrey, R.; Mahilang, M.; Deb, M.K.; Nirmalkar, J.; Shrivas, K.; Pervez, S.; Rai, M.K.; Rai, J. A direct DRS-FTIR probe for rapid detection and quantification of fluoroquinolone antibiotics in poultry egg-yolk. Food Chem. 2019, 270, 459–466.
  30. Gu, D.C.; Zou, M.J.; Guo, X.X.; Yu, P.; Lin, Z.W.; Hu, T.; Wu, Y.F.; Liu, Y.; Gan, J.H.; Sun, S.Q.; et al. A rapid analytical and quantitative evaluation of formaldehyde in squid based on Tri-step IR and partial least squares (PLS). Food Chem. 2017, 229, 458–463.
More
Information
Contributor MDPI registered users' name will be linked to their SciProfiles pages. To register with us, please refer to https://encyclopedia.pub/register :
View Times: 885
Revisions: 3 times (View History)
Update Date: 31 Mar 2022
1000/1000
ScholarVision Creations