Your browser does not fully support modern features. Please upgrade for a smoother experience.
Submitted Successfully!
 +1 credit
Thank you for your contribution! You can also upload a video entry or images related to this topic.
For video creation, please contact our Academic Video Service.
| Version | Summary | Created by | Modification | Content Size | Created at | Operation |
|---|---|---|---|---|---|---|
| 1 | Yaman Sufian Albadawi | + 2881 word(s) | 2881 | 2022-03-18 10:48:40 | | | |
| 2 | Yaman Sufian Albadawi | + 1 word(s) | 2882 | 2022-03-21 09:03:18 | | | | |
| 3 | Vicky Zhou | -1 word(s) | 2881 | 2022-03-23 07:27:23 | | | | |
| 4 | Vicky Zhou | + 71 word(s) | 2953 | 2022-03-23 07:34:08 | | |
Video Upload Options
We provide professional Academic Video Service to translate complex research into visually appealing presentations. Would you like to try it?
Cite
If you have any further questions, please contact Encyclopedia Editorial Office.
Albadawi, Y. Driver Drowsiness Detection Systems. Encyclopedia. Available online: https://encyclopedia.pub/entry/20784 (accessed on 18 July 2026).
Albadawi Y. Driver Drowsiness Detection Systems. Encyclopedia. Available at: https://encyclopedia.pub/entry/20784. Accessed July 18, 2026.
Albadawi, Yaman. "Driver Drowsiness Detection Systems" Encyclopedia, https://encyclopedia.pub/entry/20784 (accessed July 18, 2026).
Albadawi, Y. (2022, March 21). Driver Drowsiness Detection Systems. In Encyclopedia. https://encyclopedia.pub/entry/20784
Albadawi, Yaman. "Driver Drowsiness Detection Systems." Encyclopedia. Web. 21 March, 2022.
Copy Citation
Continuous advancements in computing technology and artificial intelligence have led to improvements in driver monitoring systems. Numerous experimental studies have collected real driver drowsiness data and applied various artificial intelligence algorithms and feature combinations with the goal of significantly enhancing the performance of these systems in real-time.
biological-based measures
driver drowsiness detection
hybrid-based measures
image-based measures
vehicle-based measures
1. Introduction
Based on 2017 police and hospital reports, the National Highway Traffic Safety Administration (NHTSA) identified 91,000 car accidents as being caused by drowsy drivers. These accidents resulted in 50,000 injuries. In 2019, 697 fatalities involved a drowsy driver. However, NHTSA admits that it is hard to determine the precise number of drowsy-driving accidents, injuries, or deaths and that the reported numbers are underestimates [1]. For example, a study by the American Automobile Association’s foundation for traffic safety estimated that more than 320,000 drowsy driving accidents happen each year, including 6400 fatal crashes [2]. The high numbers indicate that drowsy driving is a serious concern that needs to be addressed to mitigate its impact.
Drowsiness refers to sleepiness, often in inappropriate situations [3]. Although the state of drowsiness may only last for a few minutes, its consequences can be disastrous. The reason for entering such a state is usually attributed to fatigue, which diminishes attention and alertness levels [4]. Drowsiness may happen either by driving for long distances without enough sleep or driving at a time when the driver would typically be asleep [5]. In such cases, the main problem is the drowsy driver’s lack of concentration, resulting in a delayed response to any event on the road [6].
Fortunately, it is possible to detect driver drowsiness in its early stages and alarm the driver to avoid any potential accident. Drowsy drivers exhibit various signs, which include repeated yawning, frequent eye closure, and repeatedly departing street lanes [6]. In fact, driver drowsiness detection (DDD) techniques have been researched intensively in recent years [7][8][9][10][11][12][13]. Researchers have proposed various measures to detect these drowsiness signs as early as possible, in order to avoid accidents. These measures can be divided into four main categories: firstly, image-based measures that are obtained using a camera to analyze the driver’s movements and facial expressions; secondly, biological-based measures that relate to the driver’s bio-signals and can be recorded by placing special sensors on the driver’s body; thirdly, vehicle-based measures, which depend on monitoring the behavior and movement of the vehicle; finally, hybrid-based measures, using two or more measures. According to the literature, in 2019, Ramzan et al. [9] presented a comprehensive analysis for the existing DDD methods, as well as a detailed analysis for the commonly used classification techniques in this sector. Ramzan et al. classified the DDD techniques into three categories: behavioral, physiological, and vehicular parameter-based techniques. Then, they reviewed the top supervised learning techniques used in detecting drowsiness. In the end, they discussed the pros and cons of the three DDD in a comparative study. On the other hand, Sikander and Anwar [10] presented an in-depth review of the recent advancements in the field of driver fatigue detection. Here, the DDD methods were categorized into five groups, depending on the extracted fatigue features, including physical features, vehicular features, biological features, subjective reporting, and hybrid features. Furthermore, the fatigue effect on driving performance was discussed, along with the existing commercial products for fatigue detection available on the market. Additionally, Dong et al. presented a review of driver inattention monitoring technologies. Inattention consists of distraction and fatigue [11]. Dong et al. summarized the detection measure into five groups, similar to Sikander and Anwar’s work [10]. In their review, Dong et al. introduced the concept of driver inattention and its effect on driving performance. Additionally, they covered some of the commercial products related to inattention detection, along with a detailed review of previous research on inattention detection.
2. Drowsiness Detection Measures
In order to detect the different stages of drowsiness, researchers have studied driver responses and vehicle driving patterns. This section provides an overview of the four widely used measures for DDD. The diagram in Figure 1 illustrates all the currently used measures for classifying driver drowsiness levels. Two of these measures are observed in the drivers themselves: image- and biological-based. The third measure is extracted from the car itself and referred to as the vehicle-based measure. The fourth measure considered is the hybrid measure, which combines at least two of the previously mentioned ones.
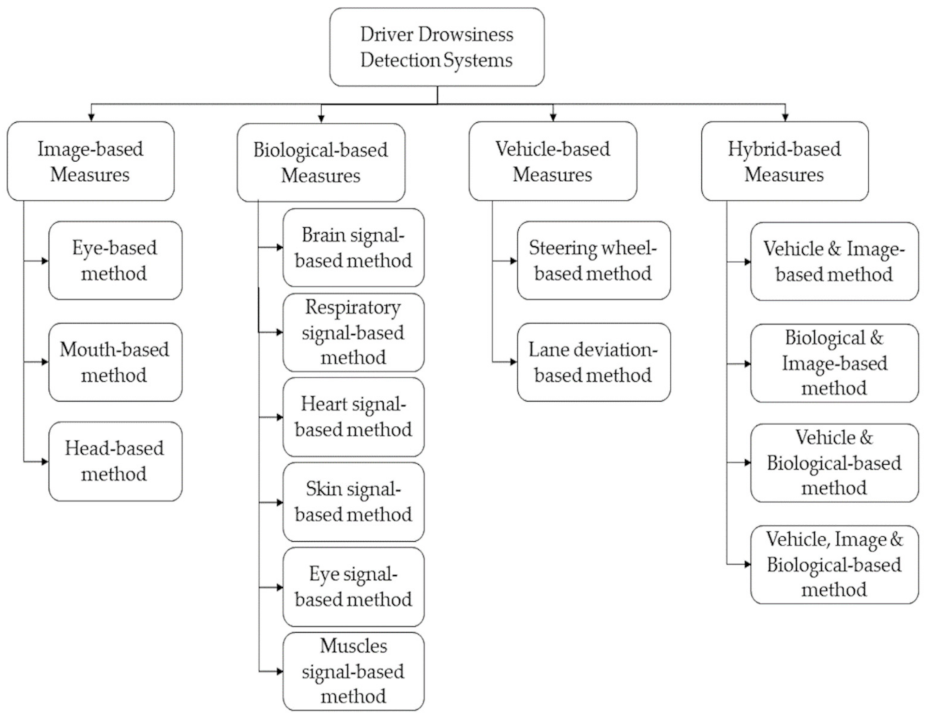
Figure 1. Driver drowsiness detection measures.
Figure 2 illustrates a DDD system’s general block diagram and data flow that can employ any of the four measures mentioned above. Initially, data are captured using a suitable sensing device; then, the target features are extracted from the captured signals. This step is essential because it simplifies the system input by discarding irrelevant information and extracting useful ones. Next, some systems may employ feature transformation or dimensionality reduction, in order to project the data in another domain, where it is easier to analyze or reduce the computational load. The fourth step selects the features that best correlate to drowsiness, using different feature selection algorithms, such as backward selection or wrapper feature selection methods. After that, machine learning (ML) or deep learning is utilized to generate a model in the training phase that is used to classify the driver’s status. The trained model is used in the testing phase to detect the driver’s drowsiness level and, if required, take action, such as activating an alarm or alerting the driver to take a break.
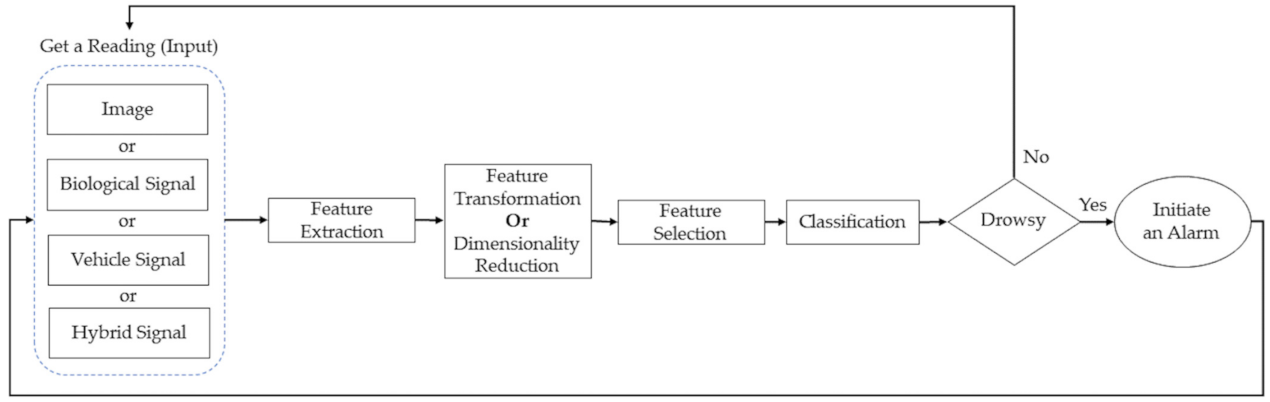
Figure 2. Driver drowsiness detection systems data flow.
Various metrics have been used to evaluate the ability of the system to detect drowsy subjects. These include accuracy, precision, and sensitivity. The equations for three metrics are listed below (1)–(3) [14][15].

(1)

(2)

(3)
2.1. Image-Based Measures
Some drowsiness signs are visible and can be recorded by cameras or visual sensors. They include the driver’s facial expressions and movements, especially the head movements. The literature refers to these signs as visual [8] or image-based measures [7]. Herein refers to them as image-based measures to highlight that these measures usually lead to features extracted from images or videos. Additionally, it is important to note here that image-based measures are a subcategory of the physical [10] or behavioral measures [9]. Physical and behavioral measures refer to the body movements captured either from videos or using motion sensors, such as a gyroscope and accelerometer [16][17].
Image-based DDD systems can be broadly categorized into three techniques, based on whether movements of the mouth, head, or eyes are observed. Table 1 lists some of the image-based measures.
Table 1. Some of the image-based measures.
| Features | Description |
|---|---|
| Blink frequency [18] | The number of times an eye closes over a specific period of time. |
| Maximum closure duration of the eyes [18] | The maximum time the eye was closed. However, it can be risky to delay detecting an extended eye closure that indicates a drowsy driver. |
| Percentage of eyelid closure (PERCLOS) [19] | The percentage of time (per minute) in which the eye is 80% closed or more. |
| Eye aspect ratio (EAR) [20] | EAR reflects the eye’s openness degree. The EAR value drops down to zero when the eyes are closed. On the other hand, it remains approximately constant when the eye is open. Thus, the EAR detects the eye closure at that time. |
| Yawning frequency [21] | The number of times the mouth opens over a specific period of time. |
| Head pose [22] | Is a figure that describes the driver’s head movements. It is determined by counting the video segments that show a large deviation of three Euler angles of head poses from their regular positions. These three angles are nodding, shaking, and tilting. |
2.2. Biological-Based Measures
Many biological signals have been used to detect the driver’s drowsiness, such as brain activity, heart rate, breathing rate, pulse rate, and body temperature signals [10]. These biological signals, also known as physiological measures [9], are proven to be more accurate and reliable for detecting drowsiness. This accuracy is due to their ability to capture early biological changes that may appear, in the case of drowsiness, thus alerting the driver before any physical drowsiness signs appear. The most commonly used biological measures in literature are listed in Table 2.
Table 2. Some biological-based measures.
| Biological Signals | Description |
|---|---|
| Electroencephalography (EEG) [23] | An EEG signal is a monitoring method that records the brain’s electrical activity from the scalp. It represents the microscopic activity of the brain’s surface layer underneath the scalp. Based on the frequency ranges (0.1 Hz–100 Hz), these signals are categorized as delta, theta, alpha, beta, and gamma. |
| Electrocardiography (ECG) [24] | ECG signals represent the electrical activity of the heart, which are acquired using electrodes placed on the skin. ECG monitors heart functionality, including heart rhythm and rate. |
| Heart rate variability (HRV) [26] | HRV signals are used to monitor the changes in the cardiac cycle, including the heartbeats. |
| Electrooculography (EOG) [27] | EOG signals are used to measure the corneo-retinal standing potential between the front and back of the human eye and record the eye movements. |
| Electromyography (EMG) [28] | EMG signals are the collective electric signals produced from muscles movement. |
2.3. Vehicle-Based Measures
This method depends on tracing and analyzing driving patterns. Every driver forms a unique driving pattern. Thus, the driving patterns of a drowsy driver can be easily distinguished from those of an alert driver. According to Pratama et al. [8], vehicular-based measures are the least investigated methods, due to the difficulty of precisely determining drowsy driving state features. Thus, many researchers combine this measure with image-based or biological measures [29][30][31]. The two most common detected vehicle-based measures, used to identify driver drowsiness, are steering wheel angle (SWA) and lane departure. Table 3 provides a list of DDD systems based on vehicle measures.
Table 3. Vehicle-based drowsiness detection systems.
| Ref. | Vehicle Parameters |
Extracted Features | Classification Method | Description | Quality Metric | Dataset |
|---|---|---|---|---|---|---|
| [30] | Steering wheel | SWA | RF | Used SWA as input data and compared it with PERCLOS. The RF algorithm was trained by a series of decision trees, with a randomly selected feature. | Accuracy: RF- steering model: 79% PERCLOS: 55% |
Prepared their own dataset |
| [31] | Lateral distance | Statistical features, derived from the time and wavelet domains, relevant to the lateral distance and lane trajectory | SVM and neural network | Detection was based on lateral distance. Additionally, it collects data of the driver’s facial and head movements to be used as ground truth for the vehicle data. | Accuracy: Over 90% |
Prepared their own dataset |
| [32] | Steering wheel | SWA | Specially designed binary decision classifier | Used SWA data to apply online fatigue detection. The alertness state is determined using a specially designed classifier. | Accuracy: Drowsy: 84.85% Awake: 78.01% |
Prepared their own dataset |
| [33] | Steering wheel | SWA, steering wheel velocity | ANFIS for feature selection, PSO for optimizing the ANFIS parameters, and SVM for classification |
Detection was based on steering wheel data. The system used a selection method that utilized ANFIS. | Accuracy: 98.12% | Prepared their own dataset |
| [34] | Steering wheel | SW_Range_2, Amp_D2_Theta, PNS, and NMRHOLD | MOL, SVM, and BPNN | Used steering wheel status data. Using variance analysis, four parameters were selected, based on the correlation level with the driver’s status. MOL model performed best. | Accuracy: MOL: 72.92% SVM: 63.86% BPNN: 62.10% |
Prepared their own dataset |
2.4. Hybrid-Based Measures
A hybrid DDD system employs a combination of image-, biological-, and vehicle-based measures to extract drowsiness features, with the aim of producing a more robust, accurate, and reliable DDD system. Table 4 shows a list of some of the recently proposed hybrid DDD systems.
Table 4. Hybrid-based drowsiness detection systems.
| Ref. | Sensors | Hybrid Parameters |
Extracted Features | Classification Method | Description | Quality Metric | Dataset |
|---|---|---|---|---|---|---|---|
| [29] | Automatic gearbox, image-generating computers, and control-loaded steering system | Image- and vehicle-based features | Latera position, yaw angle, speed, steering angle, driver’s input torque, eyelid opening degree, etc. | A series of mathematical operations, specified schemes from the study hypothesis | A system that assists the driver in case drowsiness is detected to prevent lane departure. It gives the driver a specific duration of time to control the car. If not, the system controls the vehicle and parks it. | Accuracies up to 100% in taking control of the car when the specified driving conditions were met | Prepared their own dataset |
| [16] | PPG, sensor, accelerometer, and gyroscope | Biological- and vehicle-based features | Heart rate, stress level, respiratory rate, adjustment counter, and pulse rate variability, steering wheel’s linear acceleration, and radian speed | SVM | It collected data from the sensors. Then, the features were extracted and fed to the SVM algorithm. If determined drowsy, the driver is alerted via the watch’s alarm. | Accuracy: 98.3% | Prepared their own dataset |
| [35] | Smartphone camera | Biological- and image-based features | Blood volume pulse, blinking duration and frequency, HRV, and yawning frequency | If any of the detected parameters showed a specific change/value | Used a multichannel second-order blind identification based on the extended-PPG in a smartphone to extract blood volume pulse, yawning, and blinking signals. | Sensitivity: Up to 94% | Prepared their own dataset |
| [17] | Headband, equipped with EEG electrodes, accelerometer, and gyroscope |
Biological- and behavioral-based features | Eyeblink patterns analysis, head movement angle, and magnitude, and spectral power analysis | Backward feature selection method applied followed by various classifiers | Used a non-invasive and wearable headband that contains three sensors. This system combines the features extracted from the head movement analysis, eye blinking, and spectral signals. The features are then fed to a feature selection block followed by various classification methods. Linear SVM performed the best. | Accuracy, sensitivity, and precision: Linear SVM: 86.5%, 88%, and 84.6% Linear SVM after feature selection: 92%, 88%, and 95.6% |
Prepared their own dataset |
| [36] | SCANeR Studio, faceLAB, electrocardiogram, PPG sensor, electro-dermal activity, Biopac MP150 system, and AcqKnowledge software |
Biological-, image-, and vehicle-based features | Heart rate and variability, respiration rate, blink duration, frequency, PERCLOS, head and eyelid movements, time-to-lane-crossing, position on the lane, speed, and SWA |
ANN | Included two models that used ANN. One is for detecting the drowsiness degree, and the other is for predicting the time needed to reach a specific drowsiness level. Different combinations of the features were tested. | Overall mean square error of 0.22 for predicting various drowsiness levels Overall mean square error of 4.18 min for predicting when a specific drowsiness level will be reached |
Prepared their own dataset |
| [37] | EEG, EOG, ECG electrodes, and channels |
Biological-based features and NIRS | Heart rate, alpha and beta bands power, blinking rate, and eye closure duration | Fisher’s linear discriminant analysis method | A new approach that combined EEG and NIRS to detect driver drowsiness. The most informative parameters were the frontal beta band and the oxygenation. As for classification, Fisher’s linear discriminant analysis method was used. Additionally, time series analysis was employed to predict drowsiness. | Accuracy: 79.2% | MIT/BIH polysomnographic database [38] |
| [39] | Multi-channel amplifier with active electrodes, projection screen, and touch screen | Biological-based features and contextual information | EEG signal: power spectra, five frequency characteristics, along with four power ratiosEOG signal: blinking duration and PERCLOS contextual information: the driving conditions (lighting condition and driving environment) and sleep/wake predictor value. | KNN, SVM, case-based reasoning, and RF | Used EOG, EEG, and contextual information. The scheme contained five sub-modules. Overall, the SVM classifier showed the best performance. | Accuracy: SVM multiclass classification: 79% SVM binary classification: 93% Sensitivity: SVM multiclass classification: 74% SVM binary classification: 94%. |
Prepared their own data |
| [40] | Smartphone | Image-based features, as well as voice and touch information | PERCLOS, vocal data, touch response data | Linear SVM | Utilized a smartphone for DDD. The system used three verification stages in the process of detection. If drowsiness is verified, an alarm will be initiated. | Accuracy: 93.33% | Prepared their own dataset called ‘Invedrifac’ [41] |
| [42] | Driving simulator and monitoring system | Biological-, image-, and vehicle-based features | 80 features were extracted: PERCLOS, SWA, LF/HF, etc. | RF and majority voting (logistic regression, SVM, KNN) classifiers | Vehicle-based, physiological, and behavioral signs were used in this system. Two ways for labeling the driver’s drowsiness state were used, slightly drowsy and moderately drowsy. | Accuracy, sensitivity, and precision: RF classifier: Slightly drowsy labeling: 82.4%, 84.1%, and 81.6% Majority voting: Moderately drowsy labeling: 95.4%, 92.9%, and 97.1% |
Prepared their own dataset |
3. Conclusions
Over the past decade, the drowsiness detection field has experienced significant enhancements, due to technological advancements in IoT, sensor miniaturization, and artificial intelligence. Herein has presented a detailed and up-to-date conclusion of the driver drowsiness detection systems that have been implemented in the last ten years. It has described the four main approaches followed in designing DDD systems and categorized them based on the type of drowsiness indicative parameters employed. These four categories are image-, biological-, vehicle-, and hybrid-based systems.
5G networks are expected to play a prominent role in enhancing DDD systems. With 5G connectivity, future DDD systems will be based on real driving scenarios. The data will be obtained from various drivers in actual vehicles, where factors such as ambient light, road surface vibrations, and individual differences among drivers are considered. The use of 5G connectivity will also enable the use of multi-access edge computing power for deep learning, resulting in highly accurate real-time decisions. Vehicles are expected to operate as members of Internet of vehicle networks, enabling the network to warn the drowsy driver, take control of the car (if needed), and contact neighboring vehicles in the network to alert them about the weary driver. These technologies will lead to safer roads and pave the way towards realizing smart cities.
Herein conclude by emphasizing that DDD technology has enormous market potential. Many car manufacturers, such as Toyota and Nissan, have recently installed or upgraded driver assistance devices in their products. The artificial intelligence and deep learning fields are developing tremendously. Soon, the DDD systems will most likely evolve, enabling the formation of smart cities.
Abbreviations
The nomenclature abbreviations, shown in Nomenclature, were used in this manuscript.
| Nomenclature | |
| NHTSA | National highway traffic safety administration |
| DDD | Driver drowsiness detection |
| IoT | Internet of things |
| ML | Machine learning |
| PERCLOS | Percentage of eyelid closure |
| EAR | Eye aspect ratio |
| SVM | Support vector machine |
| KNN | K-nearest neighbor |
| RF | Random forest |
| ANN | Artificial neural networks |
| CNN | Convolutional neural network |
| EEG | Electroencephalography |
| ECG | Electrocardiography |
| PPG | Photoplethysmography |
| HRV | Heart rate variability |
| EOG | Electrooculography |
| EMG | Electromyography |
| HF | High frequency |
| LF | Low frequency |
| LF/HF | Low to high frequency |
| SWA | Steering wheel angle |
| ANFIS | Adaptive neuro-fuzzy inference systems |
| MOL | Multilevel ordered logit |
| BPNN | Back propagation neural network |
| NIRS | Near-infrared spectroscopy |
References
- National Highway Traffic Safety Administration. Drowsy Driving. Available online: https://www.nhtsa.gov/risky-driving/drowsy-driving (accessed on 10 May 2021).
- Tefft, B.C. Prevalence of Motor Vehicle Crashes Involving Drowsy Drivers, United States, 2009–2013; Citeseer: Washington, DC, USA, 2014.
- National Institutes of Health. Drowsiness. Available online: https://medlineplus.gov/ency/article/003208.htm#:~:text=Drowsiness%20refers%20to%20feeling%20abnormally,situations%20or%20at%20inappropriate%20times (accessed on 10 May 2021).
- Arakawa, T. Trends and future prospects of the drowsiness detection and estimation technology. Sensors 2021, 21, 7921.
- National Safety Council. Drivers are Falling Asleep Behind the Wheel. Available online: https://www.nsc.org/road-safety/safety-topics/fatigued-driving (accessed on 10 May 2021).
- National Sleep Foundation. Drowsy Driving. Available online: https://www.sleepfoundation.org/articles/drowsy-driving (accessed on 10 May 2021).
- Fuletra, J.D.; Bosamiya, D. A survey on drivers drowsiness detection techniques. Int. J. Recent Innov. Trends Comput. Commun. 2013, 1, 816–819.
- Pratama, B.G.; Ardiyanto, I.; Adji, T.B. A review on driver drowsiness based on image, bio-signal, and driver behavior. In Proceedings of the 2017 3rd International Conference on Science and Technology-Computer (ICST), Bandung, Indonesia, 25–26 October 2017; pp. 70–75.
- Ramzan, M.; Khan, H.U.; Awan, S.M.; Ismail, A.; Ilyas, M.; Mahmood, A. A survey on state-of-the-art drowsiness detection techniques. IEEE Access 2019, 7, 61904–61919.
- Sikander, G.; Anwar, S. Driver fatigue detection systems: A review. IEEE Trans. Intell. Transp. Syst. 2018, 20, 2339–2352.
- Ukwuoma, C.C.; Bo, C. Deep Learning Review on Drivers Drowsiness Detection. In Proceedings of the 2019 4th Technology Innovation Management and Engineering Science International Conference (TIMES-iCON), Bangkok, Thailand, 11–13 December 2019; pp. 1–5.
- Dong, Y.; Hu, Z.; Uchimura, K.; Murayama, N. Driver inattention monitoring system for intelligent vehicles: A review. IEEE Trans. Intell. Transp. Syst. 2010, 12, 596–614.
- Nordbakke, S.; Sagberg, F. Sleepy at the wheel: Knowledge, symptoms and behaviour among car drivers. Transportation Research Part F: Traffic Psychology and Behaviour 2007, 10, 1–10.
- Machine Learning Crash Course. Classification: Accuracy. Available online: https://developers.google.com/machine-learning/crash-course/classification/accuracy (accessed on 2 March 2022).
- Machine Learning Crash Course. Classification: Precision and Recall. Available online: https://developers.google.com/machine-learning/crash-course/classification/precision-and-recall (accessed on 2 March 2022).
- Leng, L.B.; Giin, L.B.; Chung, W.-Y. Wearable driver drowsiness detection system based on biomedical and motion sensors. In Proceedings of the 2015 IEEE SENSORS, Busan, Korea, 1–4 November 2015; pp. 1–4.
- Mehreen, A.; Anwar, S.M.; Haseeb, M.; Majid, M.; Ullah, M.O. A hybrid scheme for drowsiness detection using wearable sensors. IEEE Sens. J. 2019, 19, 5119–5126.
- Bamidele, A.; Kamardin, K.; Syazarin, N.; Mohd, S.; Shafi, I.; Azizan, A.; Aini, N.; Mad, H. Non-intrusive driver drowsiness detection based on face and eye tracking. Int J. Adv. Comput. Sci. Appl. 2019, 10, 549–569.
- Lin, S.T.; Tan, Y.Y.; Chua, P.Y.; Tey, L.K.; Ang, C.H. Perclos threshold for drowsiness detection during real driving. J. Vis. 2012, 12, 546.
- Rosebrock, A. Eyeblink Detection with OpenCV, Python, and dlib. Available online: https://www.pyimagesearch.com/2017/04/24/eye-blink-detection-opencv-python-dlib/_mjzu4CFQAAAAAdAAAAABAK (accessed on 20 September 2021).
- Moujahid, A.; Dornaika, F.; Arganda-Carreras, I.; Reta, J. Efficient and compact face descriptor for driver drowsiness detection. Expert Syst. Appl. 2021, 168, 114334.
- Popieul, J.C.; Simon, P.; Loslever, P. Using driver’s head movements evolution as a drowsiness indicator. In Proceedings of the IEEE IV2003 Intelligent Vehicles Symposium, Columbus, OH, USA, 9–11 June 2003; pp. 616–621.
- Kumar, J.S.; Bhuvaneswari, P. Analysis of Electroencephalography (EEG) signals and its categorization—A study. Procedia Eng. 2012, 38, 2525–2536.
- Khorovets, A. What Is an Electrocardiogram (ECG)? Internet J. Adv. Nurs. Pract. 1999, 4, 1–4. Available online: https://ispub.com/IJANP/4/2/12928 (accessed on 20 September 2021).
- Castaneda, D.; Esparza, A.; Ghamari, M.; Soltanpur, C.; Nazeran, H. A review on wearable photoplethysmography sensors and their potential future applications in health care. Int. J. Biosens. Bioelectron. 2018, 4, 195.
- Mejía-Mejía, E.; Budidha, K.; Abay, T.Y.; May, J.M.; Kyriacou, P.A. Heart rate variability (HRV) and pulse rate variability (PRV) for the assessment of autonomic responses. Front. Physiol. 2020, 11, 779.
- The McGill Physiology Lab. Biological Signals Acquisition. Available online: https://www.medicine.mcgill.ca/physio/vlab/Other_exps/EOG/eogintro_n.htm (accessed on 20 September 2021).
- Chowdhury, R.; Reaz, M.B.I.; Mohd Ali, M.; Bakar, A.; Ashrif, A.; Chellappan, K.; Chang, T.-G. Surface Electromyography Signal Processing and Classification Techniques. Sensors 2013, 13, 12431–12466.
- Saito, Y.; Itoh, M.; Inagaki, T. Driver assistance system with a dual control scheme: Effectiveness of identifying driver drowsiness and preventing lane departure accidents. IEEE Trans. Hum. Mach. Syst. 2016, 46, 660–671.
- McDonald, A.D.; Schwarz, C.; Lee, J.D.; Brown, T.L. Real-time detection of drowsiness related lane departures using steering wheel angle. In Proceedings of the Human Factors and Ergonomics Society Annual Meeting, Boston, MA, USA, 22–26 October 2012; pp. 2201–2205.
- Ma, J.; Murphey, Y.L.; Zhao, H. Real time drowsiness detection based on lateral distance using wavelet transform and neural network. In Proceedings of the 2015 IEEE symposium series on computational intelligence, Cape Town, South Africa, 7–10 December 2015; pp. 411–418.
- Li, Z.; Li, S.E.; Li, R.; Cheng, B.; Shi, J. Online detection of driver fatigue using steering wheel angles for real driving conditions. Sensors 2017, 17, 495.
- Arefnezhad, S.; Samiee, S.; Eichberger, A.; Nahvi, A. Driver drowsiness detection based on steering wheel data applying adaptive neuro-fuzzy feature selection. Sensors 2019, 19, 943.
- Chai, M. Drowsiness monitoring based on steering wheel status. Transp. Res. Part D Transp. Environ. 2019, 66, 95–103.
- Zhang, C.; Wu, X.; Zheng, X.; Yu, S. Driver drowsiness detection using multi-channel second order blind identifications. IEEE Access 2019, 7, 11829–11843.
- de Naurois, C.J.; Bourdin, C.; Stratulat, A.; Diaz, E.; Vercher, J.-L. Detection and prediction of driver drowsiness using artificial neural network models. Accid. Anal. Prev. 2019, 126, 95–104.
- Nguyen, T.; Ahn, S.; Jang, H.; Jun, S.C.; Kim, J.G. Utilization of a combined EEG/NIRS system to predict driver drowsiness. Sci. Rep. 2017, 7, 1–10.
- Ichimaru, Y.; Moody, G. Development of the polysomnographic database on CD-ROM. Psychiatry Clin. Neurosci. 1999, 53, 175–177.
- Barua, S.; Ahmed, M.U.; Ahlström, C.; Begum, S. Automatic driver sleepiness detection using EEG, EOG and contextual information. Expert Syst. Appl. 2019, 115, 121–135.
- Dasgupta, A.; Rahman, D.; Routray, A. A smartphone-based drowsiness detection and warning system for automotive drivers. IEEE Trans. Intell. Transp. Syst. 2018, 20, 4045–4054.
- NVEDRIFAC—A Video and Image Database of Faces of In-vehicle Automotive Drivers, India. 2019. Available online: https://sites.google.com/site/invedrifac/ (accessed on 20 September 2021).
- Gwak, J.; Hirao, A.; Shino, M. An investigation of early detection of driver drowsiness using ensemble machine learning based on hybrid sensing. Appl. Sci. 2020, 10, 2890.
More
Information
Subjects:
Transportation Science & Technology
Contributor
MDPI registered users' name will be linked to their SciProfiles pages. To register with us, please refer to https://encyclopedia.pub/register
:
View Times:
3.8K
Revisions:
4 times
(View History)
Update Date:
23 Mar 2022
Table of Contents


Notice
You are not a member of the advisory board for this topic. If you want to update advisory board member profile, please contact office@encyclopedia.pub.
OK
Confirm
Only members of the Encyclopedia advisory board for this topic are allowed to note entries. Would you like to become an advisory board member of the Encyclopedia?
Yes
No
${ textCharacter }/${ maxCharacter }
Submit
Cancel
Back
Comments
${ item }
|
${ item.createdUser.fullName }
${ item.createdAt }
${ item.vote }
${ item.reply }
Delete
${ reply.createdUser.fullName }
${ reply.createdAt }
${ reply.vote }
Delete
There is no reply to this comment~
${ item.replyTextCharacter }/${ item.replyMaxCharacter }
Submit
Cancel
More
No more~
There is no comment~
${ textCharacter }/${ maxCharacter }
Submit
Cancel
${ selectedItem.replyTextCharacter }/${ selectedItem.replyMaxCharacter }
Submit
Cancel
Confirm
Are you sure to Delete?
Yes
No