Submitted Successfully!
To reward your contribution, here is a gift for you: A free trial for our video production service.
Thank you for your contribution! You can also upload a video entry or images related to this topic.
Version Summary Created by Modification Content Size Created at Operation
1 + 4677 word(s) 4677 2022-03-04 05:07:26 |
2 formating -386 word(s) 4291 2022-03-14 02:45:00 |

Video Upload Options

Do you have a full video?

Confirm

Are you sure to Delete?
Cite
If you have any further questions, please contact Encyclopedia Editorial Office.
Filippi, F. Paradigm Shift for Transition to Sustainable Urban Transport. Encyclopedia. Available online: https://encyclopedia.pub/entry/20499 (accessed on 21 May 2024).
Filippi F. Paradigm Shift for Transition to Sustainable Urban Transport. Encyclopedia. Available at: https://encyclopedia.pub/entry/20499. Accessed May 21, 2024.
Filippi, Francesco. "Paradigm Shift for Transition to Sustainable Urban Transport" Encyclopedia, https://encyclopedia.pub/entry/20499 (accessed May 21, 2024).
Filippi, F. (2022, March 11). Paradigm Shift for Transition to Sustainable Urban Transport. In Encyclopedia. https://encyclopedia.pub/entry/20499
Filippi, Francesco. "Paradigm Shift for Transition to Sustainable Urban Transport." Encyclopedia. Web. 11 March, 2022.
Paradigm Shift for Transition to Sustainable Urban Transport
Edit

The traffic-engineering methods of planning based on the predict-and-provide principle have self-enforcing effects of induced traffic and an unhealthy environment for humans as well as for the planet. Regardless of the huge negative effects and the recognition that a paradigm shift is emerging as the sum of methods and achievements developed by the community of academics, experts, practitioners, policymakers, and urban communities. Findings can have practical, effective implications as the determinants of a new transport policy paradigm that shows the way out of the trap of path dependency. The originality of the approach lies in having expanded and applied the concept of anomalies of the theory to the adverse effects of technologies and the mismatch between people and the modern urban environment. 

transport planning transport technology sustainability

1. Introduction

The word “paradigm” was first used in scientific debate by Thomas Kuhn in The Structure of Scientific Revolutions italics because it’s a book title [1]. A scientific paradigm is not simply the current theory, but an entire worldview; it refers to the network of conceptual, theoretical, and methodological commitments shared by a scientific community in a given field. It develops when predictions turn out to be accurate.
Kuhn also used the term paradigm in another sense, as a concrete achievement, an exemplar that can replace explicit rules as a basis for the solution of problems in a field. In this second sense, it denotes an element of the network, “the concrete problem-solutions which, employed as models or examples, can replace explicit rules as a basis for the solution of the remaining puzzles (problems)”.
A paradigm shift occurs, according to Kuhn, when scientists encounter anomalies, problems that are not solvable by known rules and procedures or equipment that fails to perform in the expected manner. When enough significant anomalies have accrued against a current paradigm, the scientific discipline is thrown into a state of crisis. During this crisis, new ideas, perhaps ones previously discarded, are tried and new achievements provide model problems and solutions. In the end a new paradigm is formed that gains its own new followers, and an intellectual battle takes place between the followers of the new paradigm and the holdouts of the old paradigm. After a given discipline has changed from one paradigm to another, this is called a scientific revolution or a paradigm shift.
The cycle—anomalies, crisis, paradigm shift—can be applied to all purposed systems that follow the same logic of theories. Whether in science [1], in technology [2], or in institutions [3], the logic of development seems similar.
The first attempts to apply these concepts to urban mobility were made beginning in the 1990s by some economists and urban planners [4][5][6][7]. At that time, researchers and practitioners were sharing a paradigm to deal with the rapid automobilisation of urban transport. The enthusiasm for the new transport mode was lost when the application of the paradigm showed the first anomalies, mainly the side effects of new road infrastructures: induced demand, urban sprawl, increasing travel distance, more congestion. These were anomalies, unintended consequences, or violations of expectations that attracted the increasing attention of researchers, practitioners, and decision makers. The effects were explained through a better articulation of the theory [8][9] and a partial paradigm shift that delivered patchy changes in the applications [10]. How the planners were seeing the problem can be found in a paper based on a case study of the Oslo western ring road [11]. In recent years, the idea of a paradigm shift has focused on innovative technologies (car automation) and digital business models [12], on congestion as a tool to limit traffic [13], and on traffic safety [14].
But urban mobility is more complicated and needs a more comprehensive interdisciplinary approach to find evidence of a paradigm shift. Urban transport is not reserved to a community of researchers and their theories. In this case, the paradigm is not only related to natural phenomena but to the social system, the constant evolution of technology where the citizens, the organisations, and the institutions are directly involved.

2. The Unresolved Problems of the Status Quo

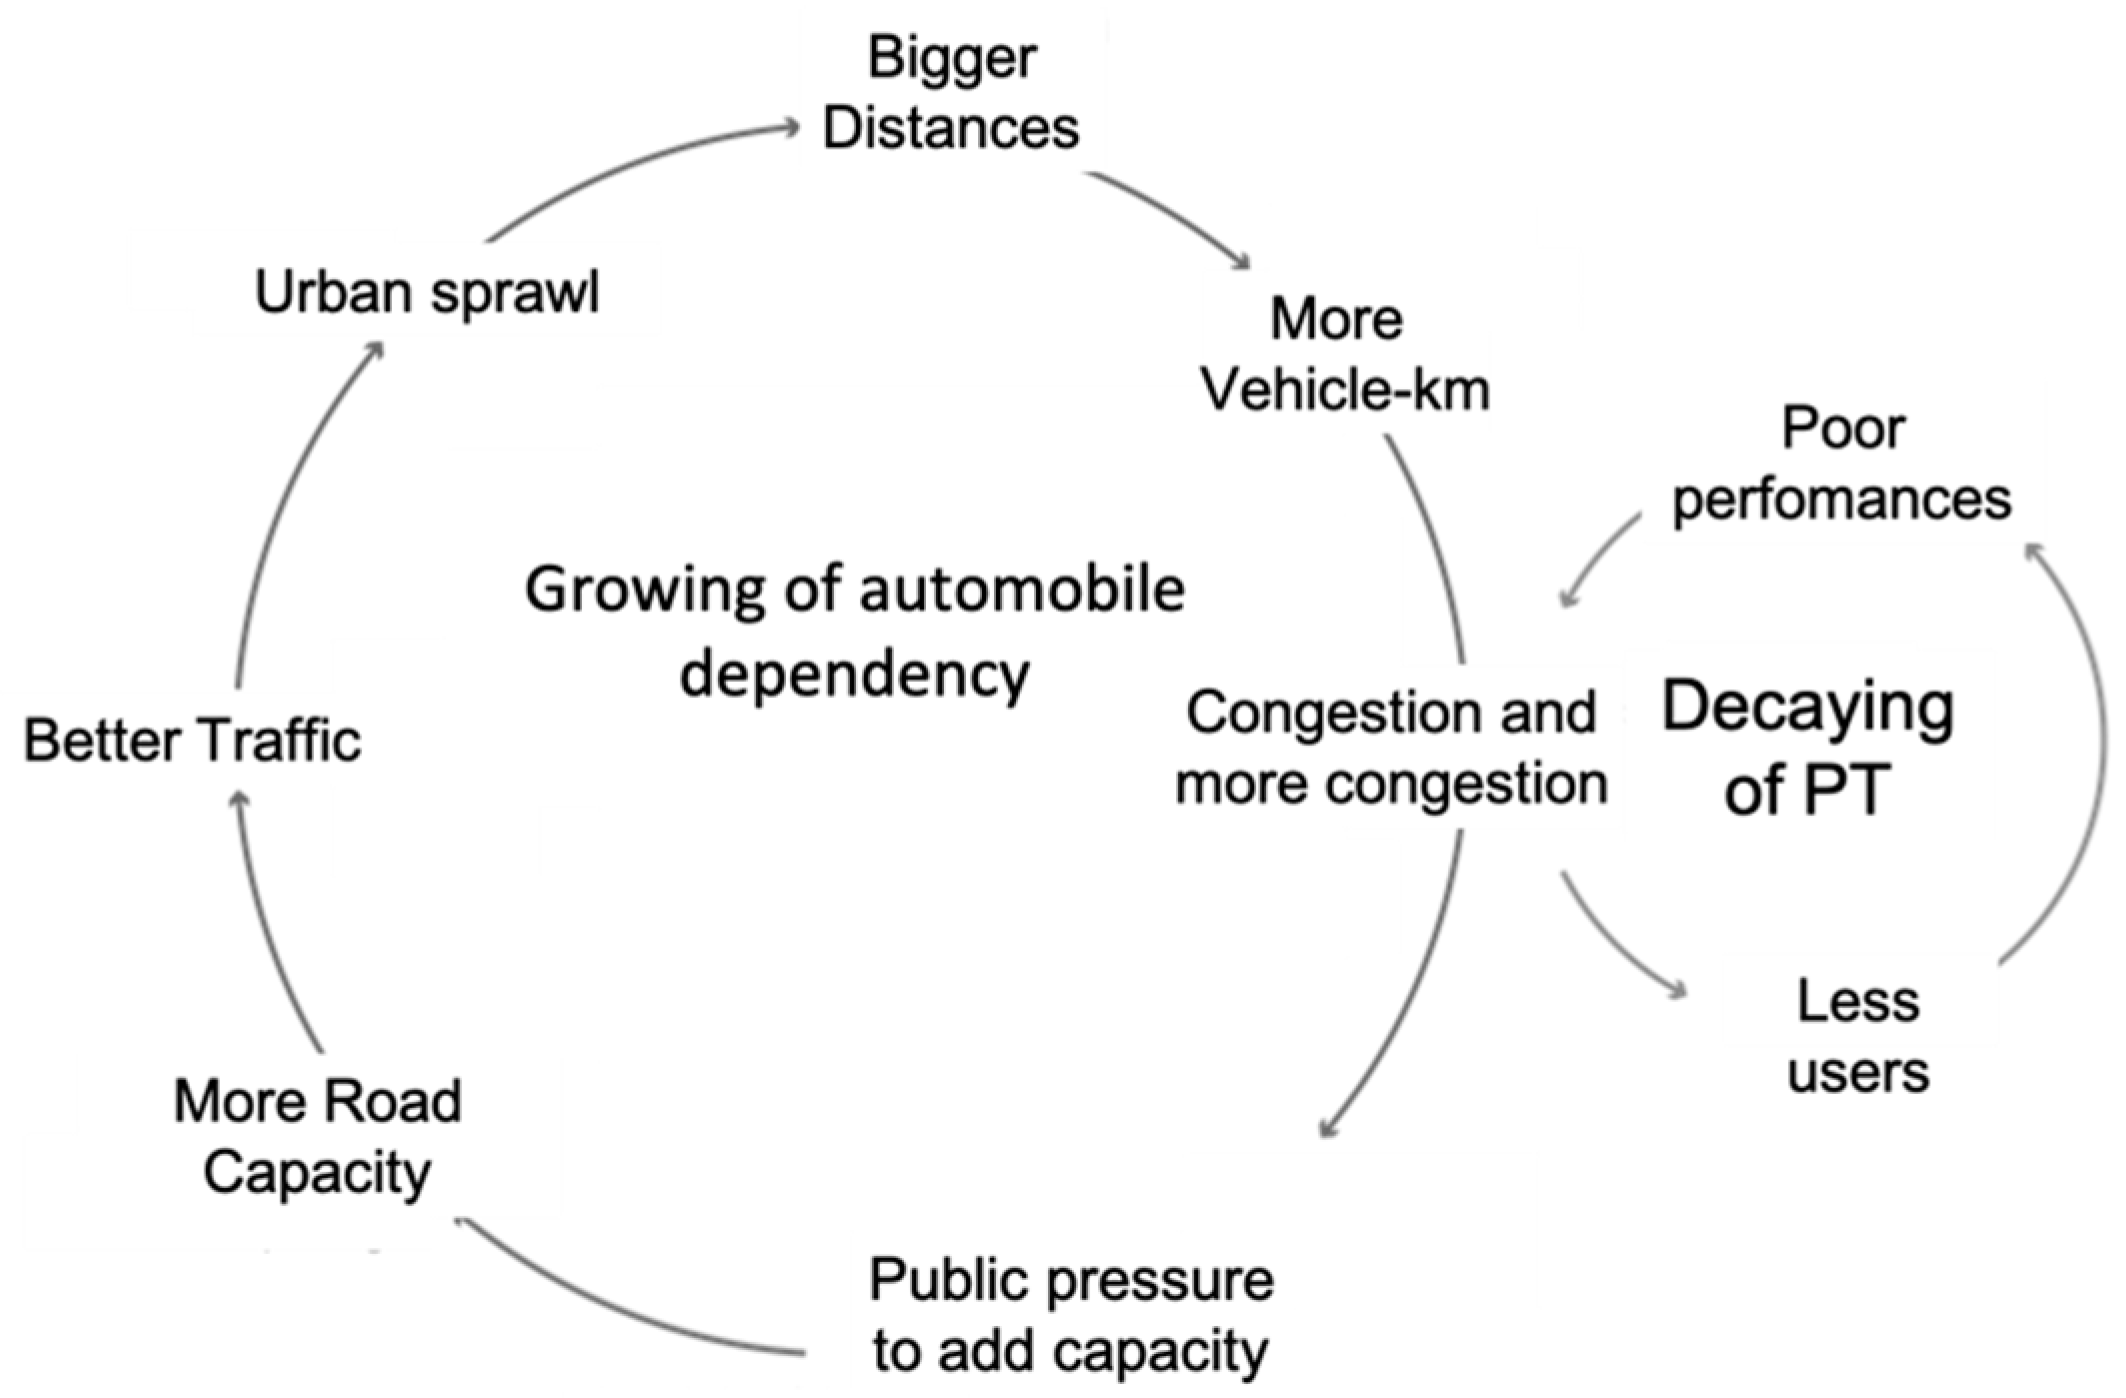
2.1. The Anomalies of the Conventional Paradigm

The automobile began as a curiosity, a new-fangled invention, which soon began to replace the horse-drawn carriage and penetrate the market as a luxury. Within a few years, in 1908, the Ford Model T brought the car to “the great multitude”. It represented freedom and speed—until, with millions of vehicles clamouring for space, everybody was stuck in traffic.
Urban planning made the problem worse. In the second half of the twentieth century, it was marked by the functionalist stance that envisions the city as a collection of uses to be accommodated: residence, work, leisure, and the traffic systems that serve them. Activities should not mix; hence zoning and car-friendly urban planning are key elements of the functionalist city. There was resistance, but despite partial successes the development has been more complex and contradictory [15].
Engineers were called in. Predictably, they took an intuitive, linear, practical approach:
  • Roads were congested; traffic was on the rise and public transport was losing users.
  • The main goal was to meet the growing demands of car traffic.
  • The method was linear and based on the predict-and-provide principle.
The paradigm used was based on the subdivision of an area into zones and on the four-step model with an evaluation procedure based on cost–benefit at the end. The engineers preferred not to think about the complexity of human behaviour. As in classical economics, users of the networks were presumed to be rational, well informed, without history, symmetrical in their evaluation of gains and losses, and able to optimise time and costs. Density of population and jobs and the mix of activities within each zone were assigned a uniformly distributed average value. Land use was an input of urbanists that transport planners transformed into intrazonal trips for the transport system to provide.
The four-step model succeeded because it supplied the response that everyone expected—more roads. Planning was an approach from above, and the pronouncements of experts were accepted more readily than today.
The concept of traffic as a fluid—which even attracted the attention of a Nobel laureate [16]—changed the nature of cities. The results were radically altered allocation of urban space with new expressways, the removal of road space from pedestrians, bicyclists, and public transport, the enormous urban sprawls, the path-dependent developments in oil, the internal combustion engine (ICE) vehicles, with technological lock-in. But traffic keeps growing; cities were (and are) stuck in traffic; and the linear simplistic solution of traffic engineers (“more traffic, more roads”) becomes the problem. Everyone thinks first of the linear interpretation, even engineers. Evolution did not equip humans with the mental ability to handle the complex systems of modern cities [17].
The first interpretations of traffic as a multi-loop non-linear feedback system, and the effects of induced traffic, date to the beginning of the 1960s. They included: the Law of Peak-Hour Expressway Congestion [18] that states that “the opening of an expressway could conceivably cause traffic congestion to become worse instead of better, and automobile commuting times to rise instead of fall”; the vicious circle of growth of the automobile and decline of the bus [19], and the black hole of road investments [20]—a downward spiral (process of cumulative causation) as the quality of road transport gradually deteriorates.
In the end, all policies based on more road capacity seem to differ only in how quickly the congestion returns [8]. The induced traffic compromises any urban transport planning strategy based on increasing road capacity; 40% of new capacity is used up immediately and 100% of it within four years [21]. The same occurs with intelligent transport systems aimed at more efficient use of road capacity [22]. Increasing capacity just increases congestion, due to its impact on public transport (PT) quality, with further worsening of the modal split [9]. It is surprising that Braess’s paradox, according to which the addition of a new link to a road network can result in longer travel times, has received no attention in transport policies. It has figured only in the German theoretical literature [23] and, after 37 years, also in the English-language literature [24].
Figure 1 represents the phenomena described as two circular concatenated processes. The first is a continuous process of growth of dependence on the automobile, which influences the land use and generates the induced demand for more road transport. Consequently, in a second process, a cumulative decaying of PT begins. The four-step model, based on equilibrium assumptions, is unable to account for circular cumulative processes where growth encourages growth and decline leads to further decline.
Figure 1. The vicious cycle of predict and provide.

2.2. Adverse Effects of Transport Technology

The adverse effects of a technology are its negative and unavoidable impacts in the automotive sustainability assessment framework shown in Figure 2.
Figure 2. The automotive sustainability assessment framework. Source: adapted from [25].
When new purposes arise and circumstances change, the existing technologies are pressed to deliver more and differently. Their supporters seek out internal replacement with better components, improved architecture, fine-tuning, and balancing to survive and compete. Additional components are added to work around its limitation. The technology becomes more complex and tends to be locked in. The mature technology performs better than its nascent rivals; it is supported by powerful interests, and so the old technology persists longer than it should. The technology is adapted and elaborated until it is strained beyond its limits. The overall cycle resembles Kuhn’s [2] and represents very clearly the development and tenaciousness of ICE vehicles.
The assessments of impacts listed in Figure 2 are based on the literature and interviews [25], and are considered over the whole life of an automobile. Despite great progress, including the regulation of many of the impacts, the automobile is an inadequate technology and in profound crisis. Car pollutants cause immediate and long-term effects on the environment and are one of the major causes of global warming. Cars affect biodiversity through pervasive, incremental intrusion into the habitat such as that caused massively by urban sprawl. The environmental damage extends to soil, lakes, rivers, flora, fauna, and human health. Nitrous oxide reduces the ozone layer. Sulphur dioxide and nitrogen dioxide combine with rainwater to make acid rain. Particulates, hydrocarbons, carbon monoxide, and other pollutants are harmful to human health. Atmospheric pollution has both acute effects and chronic effects on every organ of the body [26]. Energy, minerals, and land use are most affected. Reuse and recycling help reduce mineral depletion. Energy efficiency per passenger-km is 50 times lower in a car than on a bicycle, and transport consumes 26% of all extracted oil [27].
The industrial complex, the numerous car lovers, and the political-institutional system maintain the status quo without regard to international accords on climate change. A dramatic example of the convergence of the three actors is the enormous increase of greenhouse gases that follows the fatal attraction of the SUV [28], especially in the rich world, without any public reaction.
Mass exacerbates all the impacts: it increases rolling resistance, the need for road maintenance, wear on brakes, fuel consumption, and pollution. The sources of the particulate produced by traffic are mainly resuspension and brake and tire wear; exhaust gases account for only a fraction of the total and improve with the technology. Although electric vehicles (EV) eliminate exhaust gases and partially reduce the particulate with regenerative braking, lightweight EVs emit an estimated 11–13% less non-exhaust PM2.5 and 18–19% less PM10 than conventional vehicles. Heavier EVs reduce PM10 by only 4–7% and increase PM2.5 by 3–8% relative to conventional vehicles [29]
The automobile has altered distances: everything is farther away or less accessible. Walking or cycling to shops, work, or school is often difficult and dangerous. In 2019, EU road accidents with fatalities numbered 22,660 and those with serious injuries 120,000, 38% of them in urban areas [30]. Vulnerable road users accounted for 30% of the victims—yet Europe still boasts the best road safety record of any region in the world. The amount of space cars occupy is unsustainable for an urban environment; cars need more than 10 m2 for parking and more than 100 m2 on the road at 50 km/h [31]. Traffic noise pollution is often underestimated as a health hazard, but the World Health Organization (WHO) ranks it second after atmospheric pollution.
“The paradigm of the modern transport systems is unsustainable in its current outputs of pollutants and GHG, toll on human health and dependence on oil” [32], but it is very well rooted in the economies. It has multiplier effects on economic growth. The costs over the life cycle of the car contribute to profits, to taxes, and definitely to GDP.
The automobile industry represents a relatively small share of the overall size of OECD economies in terms of value added and employment. But this hides large variation across countries. It accounts for almost 4% of total output in Germany and 3% in the USA, whereas it is almost non-existent in several countries; 14 million Europeans work in the auto industry (directly and indirectly), accounting for more than 6% of all EU jobs.
The lifetime cost of driving a car is very high. For low-income groups it can represent an expense equal to that for housing [33]. But citizens, policymakers, and planners underestimate the full private costs of car ownership as well as the social costs. Automobile subsidies and investments tend to be regressive. Those who drive less than average, mostly lower- and moderate-income people, subsidise those who drive more than average, generally high-income people.

2.3. Evolutionary Mismatch of People

A mismatch exists when some feature of the modern environment does not match the ancestral conditions under which bodies and minds slowly evolved over millions of years. Evolutionary psychology helps to identify and examine the mismatch, or wrong combination, between modern and ancestral contexts [34]. Mismatch can arise in modern societies through human-induced changes. Two types of mismatches are “forced”, when a new environment is imposed on an organism, and “hijacked”, when a mechanism favours novel stimuli over stimuli that it evolved. A natural forced mismatch occurred when the ancestral environment changed from forest to savanna. The human lineage originated about 2.5 million years ago, and human bipedalism evolved as a direct result of human ancestors’ transition from an arboreal lifestyle to one on the savannas. To procure food, humans had to walk and run.
Walking, which exploits inverted pendulum motion, is very energy efficient [35]. When humans foraged for food, mobility was not a demand derived to reach a destination, except a spring or a cache of stones. It was needed to eat. The few modern forager women average 9 km a day and men 14 km [36]. Bipedalism made the search for food easier. The eyes were higher, so prey could be sighted and new areas, with less competition, discovered. The hands were free to carry food, use tools, and develop technology.
Despite this intense physical activity, the forager’s goal was to procure the needed calories with the least amount of work [37]. Thus, a tendency to sedentariness has been transmitted as genetic heredity [38], but not to conserve calories. Recent studies have shown a weak relationship between the level of physical activity and total energy consumption, a relatively stable physiological feature, more a product of common genetic inheritance than of lifestyle [39]. A recent hypothesis holds that keeping physical activity at the minimum level needed to procure food favoured survival because it reduced exposure to risks [40]
The adaptive output has always demanded enough physical activity to prevent the so-called noncommunicable diseases (NCDs), such as cardiocirculatory problems, diabetes, and some types of cancer [40][41][42], but that is no longer true today. 
Millions of years from the trees to the wheel, but only a few thousand from horseback and oxcarts to the railroad train and the Model T! The stone-age brains have not had time to adapt to such dramatic changes. Furthermore, because damage to health usually appears only after the reproductive years, the genetic variants that promote sedentariness have no effects on selection. “People become addicted to human-created technologies that exploit evolved preferences, and addiction is associated with a whole battery of adverse psychological and physical outcomes” [43].
Rarely has technology provided as satisfying an answer as the car to the exigencies and motivations deriving from  genetic inheritance. The automobile overcomes the physiological limitations of human locomotion and satisfies the desire to be sedentary and at the same time need to speed. The car is a consummate status symbol, and competing for status is implanted by evolution. It provides protection in environments perceived as unsafe, potentially a key aspect explaining the popularity of SUVs [44].
However, car drivers are physiologically and psychologically inadequate to the act of driving, and the faster they go, the greater the gap. The enormous tribute of deaths and injuries make the automobile an unprecedented example of the mismatch between humans and technology. Running on foot at speeds up to 30 km/h, humans can see a nearby prey or a predator to either side. A driver going 50 km/h cannot see a pedestrian or a bicycle next to the car.
Calculating the distance and speed of a car ahead to observe a safety distance strains depth perception beyond its limit, and the limits may be even lower depending on age and physical condition.

3. The Push for Change

3.1. Preferences Change over Time

The automobile as means of urban transport par excellence, after almost a century of continuous growth, seems to have peaked and begun to decline in cities with medium-high per capita income [45]. At the same time, public transport (PT) and active transport (AT), that is, walking and pedaling, are in a growth phase. Another important tendency is the return of residents and work to the city, in areas where alternative transport to the automobile exists and is competitive. Those who are outside the city, in zones served by rail transport, find it advantageous and are using it more and more. These tendencies began before the 2008 financial crisis and continued with little sign of reversal [46] until the pandemic.

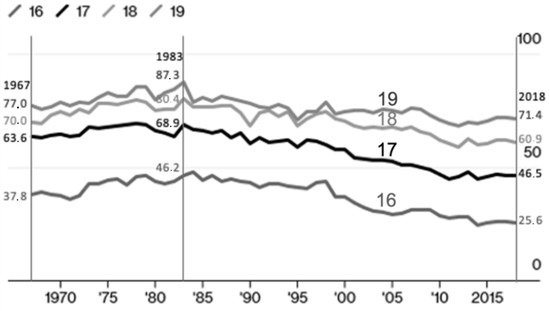
3.1.1. The Car Has Peaked

The use of the automobile grew in the middle of the 20th century, when public transport was in free fall; car use peaked at the beginning of the 21st century and has begun to decline with the revival of PT in dedicated lanes [46].
This phenomenon of stabilisation and successive decline affected all developed countries. An example is the decline of motor vehicle traffic in the main metropolitan counties of the UK, between two and four points in the period 2006–2013, and London, with almost 10 points. The causes of this tendency are multiple: revival of public transport and demographic, economic, cultural, and technological effects. The variations are strongly dependent on age. Whereas persons aged over 60 took 10% more trips per capita on average, those aged 35–59 reduced them by 8%, and younger people by almost 20%. The greatest reductions occurred in the largest towns with the best public transport and highest density [47].

4.1.2. The Demographic Effects

Young people are less likely today to seek a driving license [48][49]. Figure 3 gives the percentage of young people aged 16–19 with driving license from 1967 to 2018 in the United States. After the peak in 1983, there was a decline of tens of percentage points up to 2018. The phenomenon is general in developed countries and results in a reduction in trips. Young people drive less; the maximum of trips occurs at age 50. Car use discriminates by income, age, and gender. Women make only 40% as many trips as men.
Figure 3. Percentage of youths aged 16, 17, 18, and 19 with a driving license in the USA. Source: US Federal Highway Administration data.
Many reasons are cited for this disaffection with the car, such as, in the UK, the decline in private home ownership, increased urbanisation, increased used of information communication technology (ICT), rise of pro-environmental attitudes, decline in cars as status symbols, rise of shared mobility, and social media [50].

3.1.3. The Return of the Bike

The rebirth of the bicycle, after the heavy decline in the years after the end of the Second World War, began in the 1970s in the dense areas of all the great cities of the Western world [51]. The movement spread from the centre to the peripheries of the big cities and to the centre of medium-sized cities. It should also be noted that, despite the increase in cycling, the overall impact has so far been in general relatively modest in terms of long-term changes in transport demand: in 2018, bicycles represented only 2.5% of all trips in London, even though bike trips had increased 2.6 times since 2000.
The tendency is a further sign of the decline in car dependence and contributes with economical and efficacious solutions to sustainability and to overcoming the sedentary epidemic. However, adding an electric motor to the bike can cancel out the advantages of physical exercise and favour speed at the expense of safety. When destinations are near, the choice of AT is favoured, which respects the tendency to have a constant time budget for travel [52][53].

3.1.4. Digital Transformation

Digital technologies allow more socialising at a distance more sustainably [54]. The new places for virtual socialising have become a major component of the popular culture. They dominate life today with infinite interactions. They facilitate relations with anyone in the world via text messages, photos, and videos, all exchanged instantly at minimal cost. They influence the lifestyle of young people, who can share their thoughts and feelings with their contemporaries instantly. This has created a fracture between the rapidity of virtual contact and the slowness of physical contact. The change that is occurring is less car, greater attraction of the neighbourhood, and virtual connections.
A first group of applications utilise the virtual connection for teaching, lectures, meetings, remote working, and many other services that provide certificates, forms, and books. A second group is B2C e-commerce, which brings a sharp reduction of trips for shopping and of distance travelled [55], but increases goods transport.
The gains in time thanks to the constancy of the time dedicated to the trips have rebound effects confirmed by two studies. The first showed that, when teleworkers travel less often for work, they tend to travel more often for other reasons [56]. A tangible consequence of this, and of remote working in particular, is the congestion reduction from Monday to Friday and the spread of congestion to Saturday and Sunday. Another study, in Newark, New Jersey (USA), found that vehicle use has not fallen off at all with the growth of online shopping [57]. The hypothesis is that persons spend the time saved on other things, such as visiting friends. The intervention needed should orient such activity locally and on AT or PT.

3.2. Mobility in the Time of Coronavirus

The tendencies towards decline of automobile dependence were accentuated during the 2020 coronavirus lockdown. In the UK, of 20,000 persons interviewed [58], 22% indicated that after the pandemic they will drive less, 24% of those over age 65; 36% will walk, pedal, and run more; 51% will drive as before; and only 1% will drive more.
At the same time millions of users abandoned public transport. It was a sort of natural experiment to assess equity and auto dependence in urban transport. The ‘access for all’ without discrimination as to income, physical ability, housing location, mode of travel, or any other factor was not respected [59]. All the groups at risk of transport disadvantage, particularly women and old people, were also more likely to report difficulties while avoiding public transit.
The global mayors’ COVID-19 recovery task force, of the C40 cities network, have committed to healthier, more equitable, and more sustainable cities. The coronavirus has been shown to be more aggressive where the air is polluted with fine dust and nitrogen oxide [60][61]. But the newest, most important factor is social media. Young people have been the first to grasp the opportunities revealed by the COVID pandemic. Moreover, the automobile has rightly been seen for what it really is: not a tool for socialising but a cocoon for social distancing.

3.3. The Innovation of the Urban Interventions

Hundreds of professionals, experts, and researchers have combined their efforts to reduce dependence on the automobile and encourage PT and AT. The results are numerous innovative interventions. The four main types are:
  • Redevelopment of neighbourhoods with activities and services nearby, accessible on foot and by disabled people, giving priority to pedestrian and bicycle routes and keeping car routes and parking to the margins;
  • Development of dense and multifunctional settlements: residences, offices, shopping, and cultural venues, around public transport nodes, transit-oriented development, with distances suitable for pedestrians or cyclists;
  • Elimination of large central arteries and redevelopment with green social spaces, cultural and sport activities, priority to public transport, and pedestrian and bike routes;
  • Innovation in the system of urban distribution with non-polluting transport, distribution centres served by rail if possible, and attention to recycling.
Italy has been closing historic centres to traffic since the 1960s. In Europe there are interesting examples in the Nordic capitals of Copenhagen, Helsinki, Oslo, and Stockholm. The interventions emphasised PT accessibility with new metros, trams, and dedicated bus lanes, while keeping traffic at least 250 m from the protected zone and parking areas mostly at the margins. The closing has favoured AT and the distribution of goods, including e-commerce. The result has been a revitalisation of the centre, now a pleasant place to socialise, with shops, cultural activities, services, and offices.
For many years now, major road links in city centres [62] have successfully been eliminated. In the 1990s, San Francisco (USA) removed significant segments of urban roads, the Embarcadero Freeway and the Central Freeway, which launched the revitalisation of the surrounding areas and led to a 60% drop in traffic. New York has removed traffic on parts of Broadway. In Asia, Seoul’s broad Cheonggye freeway was removed between 2003 and 2005. Examples in Europe include (among many others) the Georges Pompidou freeway in Paris, the M-30 in Madrid, the seafront drive in Naples, and the Via dei Fori Imperiali, with the Colosseum, in Rome. Various attempts have been made to return urban freight to rail [63][64]. Paris offers an example of interventions to distribute goods once again by rail and navigable canals [65].

References

  1. Kuhn, T. The Structure of Scientific Revolutions; University of Chicago Press: Chicago, IL, USA, 1962.
  2. Arthur, W.B. The Nature of Technology: What It Is and How It Evolves; Penguin Books: London, UK, 2009.
  3. Hall, P.A. Policy Paradigms, Social Learning, and the State: The Case of Economic Policymaking in Britain. Comp. Politics 1993, 25, 275–296.
  4. Goodwin, P.; Hallett, S.; Kenny, F.; Stokes, G. Transport: The New Realism; Transport Studies Unit: Oxford, UK, 1991.
  5. Cervero, R. Paradigm Shift: From Automobility to Accessibility Planning; Institute of Urban and Regional Development, University of California at Berkeley: Berkeley, CA, USA, 1996.
  6. Litman, T. Reinventing Transportation: Exploring the Paradigm Shift Needed to Reconcile Transportation and Sustainability Objectives; Victoria Transport Policy Institute: Victoria, BC, Canada, 2003.
  7. Banister, D. The sustainable mobility paradigm. Transp. Policy 2008, 15, 73–80.
  8. Goodwin, P. Some Problems in the Transformation of Transport Policy; ESRC Transport Studies Unit Working Paper; University College London: London, UK, 1998.
  9. Mogridge, M.J.H. The self-defeating nature of urban road capacity policy: A review of theories, disputes and available evidence. Transp. Policy 1997, 4, 5–23.
  10. Rye, T. Paradigm shift? In Handbook of Sustainable Transport; Curtis, C., Ed.; Elgar Online: Northampton, MA, USA, 2020.
  11. Tennøy, A. Why we fail to reduce urban road traffic volumes: Does it matter how planners frame the problem? Transp. Policy 2010, 17, 216–233.
  12. Janasz, T. Paradigm Shift in Urban Mobility: Towards Factor 10 of Automobility; Springer Gabler: Wiesbaden, Germany, 2016.
  13. Knoflacher, H.; Frey, H. Congestion as a Tool to Avoid Congestion: Breaking Away from the Traditional Transport Paradigm. In Proceedings of the Future of Transportation World Conference, Vienna, Austria, 10–11 December 2019.
  14. Litman, T. New Traffic Safety Paradigm; Victoria Transport Policy Institute: Victoria, BC, Canada, 2020.
  15. Engler, H. Social movement and the failure of car-friendly city projects: East and West Berlin (1970s and 1980s). J. Transp. Hist. 2020, 41, 353–380.
  16. Prigogine, I.; Herman, R. Kinetic Theory of Vehicular Traffic; American Elsevier: New York, NY, USA, 1971.
  17. Forrester, J.W. Counterintuitive Behavior of Social Systems. Technol. Rev. 1971, 73, 52–68. Available online: http://www.virtualadjacency.com/wp-content/uploads/2008/01/42c-MIT-Prof-Forrester-Counterintuitive-Behavior-of-Social-Systems-TechRvw-Jan-1971.pdf (accessed on 11 January 2022).
  18. Downs, A. The law of peak-hour expressway congestion. Traffic Q. 1962, 6, 393–409.
  19. Goodwin, P.B. Car and bus journeys to and from Central London in peak hours. Traffic Eng. Control 1969, 11, 376–378.
  20. Plane, D.A. Urban transportation: Policy alternatives. In The Geography of Urban Transportation; Hanson, S., Ed.; Guilford Press: London, UK, 1986; pp. 386–414.
  21. Speck, J. Walkable City Rule; Island Press: Washington, DC, USA, 2018.
  22. Bell, M. Solutions to urban traffic problems: Towards a new realism. Traffic Eng. Control 1995, 36, 78–81.
  23. Braess, D. Über ein Paradoxon aus der Verkehrsplanung. Unternehmensforschung 1968, 12, 258–268.
  24. Braess, D.; Nagurney, A.; Wakolbinger, T. On a paradox of traffic planning. Transp. Sci. 2005, 39, 446–450.
  25. Jasiński, D.; Meredith, J.; Kirwan, K. A comprehensive framework for automotive sustainability assessment. J. Clean. Prod. 2016, 135, 1034–1044.
  26. Alessandrini, E.R.; Faustini, A.; Chiusolo, M.; Stafoggia, M.; Gandini, M.; Demaria, M.; Antonelli, A.; Arena, P.; Biggeri, A.; Canova, C.; et al. Gruppo collaborativo EpiAir2. Inquinamento atmosferico e mortalità in venticinque città italiane: Risultati del progetto EpiAir2 . Epidemiol. Prev. 2013, 37, 220–229.
  27. International Energy Association (IEA). World Energy Outlook. 2016. Available online: www.worldenergyoutlook.org/publications/weo-2016/ (accessed on 11 January 2022).
  28. International Energy Association (IEA). Carbon Emissions Fell across All Sectors in 2020 Except for One—SUVs. 2021. Available online: https://www.iea.org/commentaries/carbon-emissions-fell-across-all-sectors-in-2020-except-for-one-suvs (accessed on 22 February 2022).
  29. OECD. Non-Exhaust Particulate Emissions from Road Transport: An Ignored Environmental Policy Challenge; OECD Publishing: Paris, France, 2020.
  30. European Transport Safety Council (ETSC). Ranking EU Progress on Road Safety 14th Road Safety Performance Index Report. 2020. Available online: https://etsc.eu/wp-content/uploads/14-PIN-annual-report-FINAL.pdf (accessed on 11 January 2022).
  31. Knoflacher, H. Understanding Professionals, Politicians and The Society in The Motorized World—And How to Help Them. Int. J. New Technol. Res. (IJNTR) 2017, 3, 60–65.
  32. Glover, L.; Low, N. Unsustainable transport. In Handbook of Sustainable Transport; Curtis, C., Ed.; Elgar Online: Northampton, MA, USA, 2020.
  33. Gössling, S.; Kees, J.; Litman, T. The lifetime cost of driving a car. Ecol. Econ. 2022, 194, 107335.
  34. Li, N.P.; van Vugt, M.; Colarelli, S.M. The Evolutionary Mismatch Hypothesis: Implications for Psychological Science. Curr. Dir. Psychol. Sci. 2018, 27, 38–44.
  35. Kuo, A.D.; Donelan, J.M.; Ruina, A. Energetic consequences of walking like an inverted pendulum: Step-to-step transitions. Exerc. Sport Sci. Rev. 2005, 33, 88–97.
  36. Marlowe, F.W. Hunter-gatherers and human evolution. Evol. Anthropol. 2005, 14, 5467.
  37. Kelly, R. The Fifth Beginning: What Six Million Years of Human History Can Tell Us about Our Future; University of California Press: Berkeley, CA, USA, 2016.
  38. Cheval, B.; Tipura, E.; Burra, N.; Frossard, J.; Chanal, J.; Orsholits, D.; Radel, R.; Boisgontier, M.P. Avoiding sedentary behaviors requires more cortical resources than avoiding physical activity: An EEG study. Neuropsychologia 2018, 119, 68–80.
  39. Pontzer, H.; Raichlen, D.A.; Wood, B.M.; Mabulla, A.Z.; Racette, S.B.; Marlowe, F.W. Hunter-gatherer energetics and human obesity. PLoS ONE 2012, 7, e40503.
  40. Speakman, J.R. An Evolutionary Perspective on Sedentary Behavior; BioEssays; Wiley Online Library: Hoboken, NJ, USA, 2019.
  41. Celis-Morales, C.; Lyall, D.M.; Welsh, P.; Anderson, J.; Steell, L.; Guo, Y.; Maldonado, R.; Mackay, D.F.; Pell, J.P.; Sattar, N.; et al. Association between active commuting and accident cardiovascular disease, cancer, and mortality: Prospective Cohort Study. Br. Med. J. 2017, 357, j1456.
  42. Leitzmann, M.F.; Jochem, C.; Schmid, D. (Eds.) 25.3.4 Transport and Urban Design. In Sedentary Behaviour Epidemiology; Springer: Berlin/Heidelberg, Germany, 2018.
  43. Geher, G.; Wedberg, N. Positive Evolutionary Psychology; Oxford University Press: Oxford, UK, 2020.
  44. Gössling, S. The Psychology of the Car: Automobile Admiration, Attachment, and Addiction; Elsevier: Amsterdam, The Netherlands, 2017.
  45. Goodwin, P.; Van Dender, K. ‘Peak car’: Themes and issues. Transp. Rev. 2013, 33, 243–254.
  46. Newman, P.; Kenworthy, J. The End of Automobile Dependence: How Cities Are Moving beyond Car-Based Planning; Springer: Berlin/Heidelberg, Germany, 2015.
  47. Goodwin, P. Main trends in car use, travel demand and policy thinking on how to deal with uncertainties. In Proceedings of the International Transport Forum: ITF Round Table on Zero Car Growth? Managing Urban Traffic, Paris, France, 16–17 December 2019.
  48. Rérat, P. A decline in youth licensing: A simple delay or the decreasing popularity of automobility? Appl. Mobilities 2018, 6, 71–91.
  49. Fox, J. Lots of Teens Are Still Shunning Cars. Bloomberg Quint. 9 January 2020. Available online: https://www.bloombergquint.com/gadfly/percentage-of-teenage-drivers-falls-again-in-sign-of-peak-cars (accessed on 11 January 2022).
  50. Chatterjee, K.; Goodwin, P.; Schwanen, T.; Clark, B.; Jain, J.; Melia, S.; Middleton, J.; Plyushteva, A.; Ricci, M.; Santos, G.; et al. Young People’s Travel: What’s Changed and Why? Review and Analysis. Report to Department for Transport; UWE Bristol: Bristol, UK, 2018. Available online: https://www.gov.uk/government/publications/young-peoples-travel-whats-changed-and-why (accessed on 11 January 2022).
  51. Héran, F. Éléments Statistiques Sur L’essor De L’usage du Vélo Dans le Monde Occidental et en Particulier en France; Université de Lille: Lille, France, 2020.
  52. Marchetti, C. Anthropological invariants in travel behavior. Technol. Forecast. Soc. Chang. 1994, 47, 75–88.
  53. Metz, D. The myth of travel time saving. Transp. Rev. 2008, 28, 321–336.
  54. Crosier, B.S.; Webster, G.D.; Dillon, H.M. Wired to connect: Evolutionary psychology and social networks. Rev. Gen. Psychol. 2012, 16, 230–239.
  55. Weltevreden, J.; Mindali, R.O. Mobility effects of b2c and c2c e-commerce in the Netherlands: A quantitative assessment. J. Transp. Geogr. 2009, 17, 83–92.
  56. Budnitz, H.; Tranos, E.; Chapman, L. Telecommuting and Other Trips: An English case study. J. Transp. Geogr. 2020, 85, 102713.
  57. Laghaei, J.; Faghri, A.; Li, M. Impacts of home shopping on vehicle operations and greenhouse gas emissions: Multi-year regional study. Int. J. Sustain. Dev. World Ecol. 2015, 23, 381–391.
  58. Moran, M. Fifth of Drivers Will Use Car Less after Lockdown Lifted. TransportXtra. 29 April 2020. Available online: https://www.transportxtra.com/publications/evolution/news/65239/fifth-of-drivers-will-use-car-less-after-lockdown-lifted/ (accessed on 10 January 2022).
  59. Matthew, P.; Allen, J.; Liu, B.; Zhang, Y.; Widener, M.; Farber, S. Riders Who Avoided Public Transit During COVID-19. J. Am. Plan. Assoc. 2021, 87, 455–469.
  60. Wu, X.; Nethery, R.C.; Sabath, M.B.; Braun, D.; Dominici, F. Air pollution and COVID-19 mortality in the United States: Strengths and limitations of an ecological regression analysis. Sci. Adv. 2020, 6.
  61. Fiasca, F.; Minelli, M.; Maio, D.; Minelli, M.; Vergallo, I.; Necozione, S.; Mattei, A. Associations between COVID-19 incidence rates and the exposure to PM2.5 and NO2: A nationwide observational study in Italy. Int. J. Environ. Res. Public Health 2020, 17, 9318.
  62. Khalaj, F.; Pojani, D.; Sipe, N.; Corcoran, J. Why are cities removing their freeways? A systematic review of the literature. Transp. Rev. 2020, 40, 557–580.
  63. Alessandrini, A.; Delle Site, P.; Filippi, F.; Salucci, M.V. Using rail to make urban freight distribution more sustainable. In European Transport/Trasporti Europei; Issue 50, Paper no. 5; Università degli Studi di Firenze: Firenze, Italy, 2012.
  64. De Langhe, K. Analysing the role of rail in urban freight distribution. In Next Generation Supply Chains: Trends and Opportunities. Proceedings of the Hamburg International Conference of Logistics (HICL), Hamburg, Germany, 18–19 September 2014; Kersten, W.B., Blecker, W., Thorsten Ringle, C.M., Eds.; Econstor: Kiel, Germany, 2014; Volume 18, pp. 223–244.
  65. Dablanc, L. Logistics Hotels and Rail Freight Logistics in French Cities. Paper Presentation, Berlin-Brandebourg Logistics Cluster. 21 November 2019. Available online: https://www.lvmt.fr/wp-content/uploads/2019/11/Logistics-hotels-Berlin-presentation-Dablanc-Nov-2019_cp.pdf (accessed on 11 January 2022).
More
Information
Subjects: Transportation
Contributor MDPI registered users' name will be linked to their SciProfiles pages. To register with us, please refer to https://encyclopedia.pub/register :
View Times: 923
Revisions: 2 times (View History)
Update Date: 14 Mar 2022
1000/1000
Video Production Service