Your browser does not fully support modern features. Please upgrade for a smoother experience.
Submitted Successfully!
 +1 credit
Thank you for your contribution! You can also upload a video entry or images related to this topic.
For video creation, please contact our Academic Video Service.
| Version | Summary | Created by | Modification | Content Size | Created at | Operation |
|---|---|---|---|---|---|---|
| 1 | Elaine Ruth Carnegie | + 1602 word(s) | 1602 | 2022-03-01 09:10:17 | | | |
| 2 | Catherine Yang | Meta information modification | 1602 | 2022-03-14 02:47:00 | | |
Video Upload Options
We provide professional Academic Video Service to translate complex research into visually appealing presentations. Would you like to try it?
Cite
If you have any further questions, please contact Encyclopedia Editorial Office.
Carnegie, E. Associations between Population Density and Health Outcomes. Encyclopedia. Available online: https://encyclopedia.pub/entry/20486 (accessed on 27 July 2026).
Carnegie E. Associations between Population Density and Health Outcomes. Encyclopedia. Available at: https://encyclopedia.pub/entry/20486. Accessed July 27, 2026.
Carnegie, Elaine. "Associations between Population Density and Health Outcomes" Encyclopedia, https://encyclopedia.pub/entry/20486 (accessed July 27, 2026).
Carnegie, E. (2022, March 11). Associations between Population Density and Health Outcomes. In Encyclopedia. https://encyclopedia.pub/entry/20486
Carnegie, Elaine. "Associations between Population Density and Health Outcomes." Encyclopedia. Web. 11 March, 2022.
Copy Citation
Both density of population and proximity to man-made activities, as well as the natural environment, concentrate risk for humans. Population density is therefore a measure of “the degree of pressure on natural resources” as well as an indicator reflecting the level of human activity within a specific bounded landscape. Exposure to contaminants from soil, water or air coupled with social or economic vulnerability and population density may increase potential harm to health at a subclinical or clinical level.
population density
environmental health
non-communicable diseases
cancers
1. All-Cause Mortality
All-cause mortality was also associated with high population density (Figure 1). Spanning Europe, the United Kingdom and the USA, five of seven all-cause mortality studies reported a consistent pattern of NCDs being associated with high population density [1][2][3][4][5] (Figure 2). A high-quality multilevel study investigated simultaneous effects of area level socioeconomic status (ALSES) and population density on mortality over a 10-year period [4]. They found that there was no gradient for the population density effect. Concentration of risk was only in the most populated areas. However, in the over-50 age group, the proportion of unemployed reduced the effect of population density. In contrast, across all levels of deprivation for British constituencies there was a positive correlation observed between population density and mortality rates, except in the 7th–10th most deprived deciles where there was a negative correlation [5]. Against the overall positive trend, one study found no association with high population density [6], while another described an inverse association, with ‘rural’ areas having higher excess mortality [7]. The higher mortality rates in low population density areas could be explained by urban areas having better access to resources. All studies adjusted for socioeconomic status.
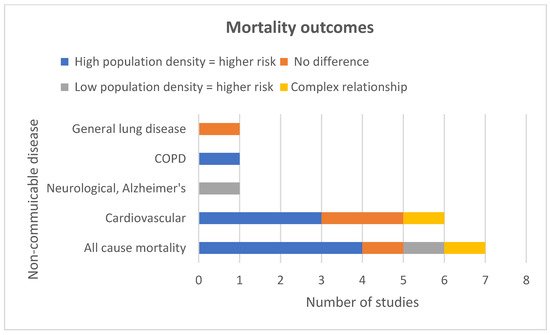
Figure 1. Mortality study outcomes.
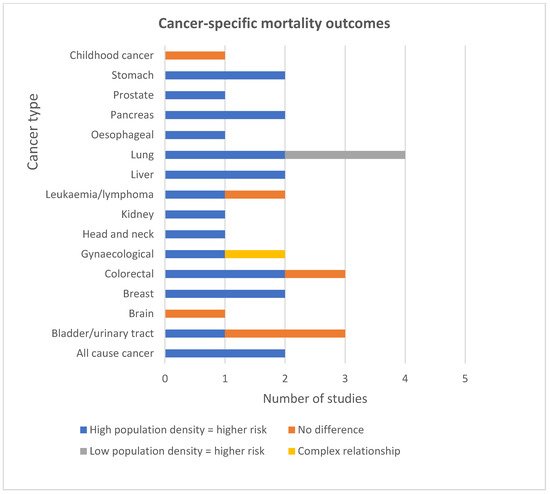
Figure 2. Cancer-specific mortality outcomes.
2. Cause Specific Mortality
The conditions that were most consistently associated with high population density and mortality were colorectal, gynaecological, breast, stomach, liver, oesophageal, pancreatic, head and neck, kidney cancers, all-cause cancer, COPD and cardiovascular disease (Figure 1 and Figure 2). The NCDs that were not consistently associated with high population density were Alzheimer’s, testicular cancer, lung cancer, brain cancer, bladder cancer, leukaemia and general lung disease. Findings were from 14 mortality studies, indicating an association between high population density and a range of NCDs [8][9][10][1][11][12][13][14][15][3][16][17][18][19]. Findings for all the specific types of cancer were extracted from seven studies—five high-quality and two medium-quality [8][9][11][12][15][17][18]. Three adjusted for socioeconomic status. For some cancers, mortality was only associated with a specific sex. For example, one study (high-quality) from the USA reported a significant linear relationship between increasing population density and deaths for cancers of the oral cavity and pharynx and oesophagus in men and for liver cancer in women [17]. The same study reported a significant association between higher population density and higher rates of death from head and neck, kidney and pancreatic cancer in men only. For women, the same study revealed a U-shaped pattern of mortality across population quintiles for cervical and rectal cancer [17]. Explanations could include metastasis from cervical to rectal sites related to delay in diagnosis, and/or level of access to health services in these geographical areas. Another high-quality study reported an association between SES and Ischaemic Heart Disease (IHD); mortality was much stronger in densely populated areas, with the 50–64-year-old age group being most affected [13].
3. Morbidity
The NCDs that were most consistently associated with high population density and morbidity were lung, colorectal, gynaecological, breast, stomach, liver, oesophageal, head and neck, bladder, kidney, skin cancers, all-cause cancer, club foot and asthma (Figure 3 and Figure 4).
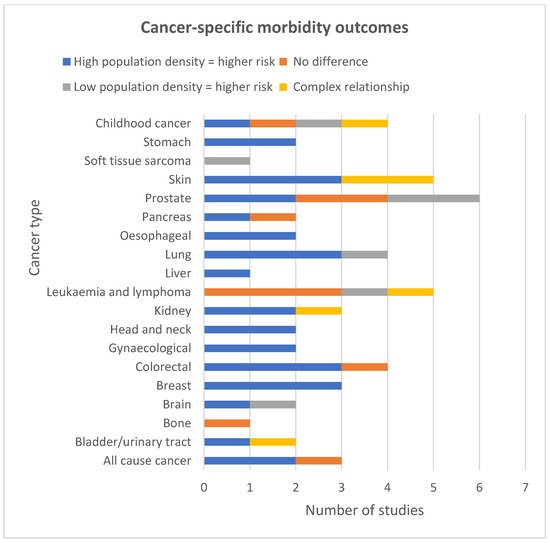
Figure 3. Cancer-specific morbidity study outcomes.
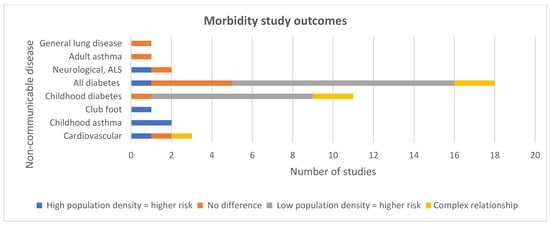
Figure 4. Morbidity study outcomes.
Cancers
Three studies consistently reported an association with high population density and high rates of breast cancer [20][21][22] (Figure 3). One study reported a significant linear association between liver cancer and increasing population density in women but not in men [17]. Another study reported a monotonic association between high population density and oral cavity cancer, but only in white women [20]. They found a significant non-monotonic association between population density and oral cavity cancer in black men and white men, with the highest risk of oral cavity cancer in the most densely populated quintile. They did not adjust for SES. Another study that adjusted for SES reported a significant association between high population density and increased rates of head and neck cancer in both men and women [22]. One study reported a significant monotonic association in white men and women and a non-monotonic association between population density and increased risk of stomach cancer in black men, and no association in women [20].
From the USA, Ireland and Denmark, three of four studies investigating lung cancer found an association between high population density and lung cancer incidence [20][21][22]; however, in contrast, one study from France reported that incidence was higher in areas of low population density, and in men [14]. Five studies reported on skin cancer. A significant risk for both sexes of non-melanoma was found in urban areas for men and women [22]. A high-quality study found that, after adjusting for ALSES, risk of basal cell skin cancer was associated with high population density in areas of least deprivation for both sexes. This differed for squamous cell where there was no significant relationship with population density for men [23]. A medium-quality study found that incidence of melanoma was associated with living in areas of high population density and in areas of high SES. However, tumours were diagnosed at an earlier stage in individuals living in areas of high SES rather than those from low SES areas [24]. In contrast, two studies observed an inverted V shaped pattern across population density quintiles for malignant melanoma [20][17]. One of these studies found that this association was only statistically significant in white men [20].
Asthma
Two childhood studies reported on whether there was an association between population density and asthma after adjusting for SES [25][26]. One study found that as well as the association with high population density, asthma admission-rate variation was strongly associated with underlying differences in neighbourhood-level characteristics [25]. Neighbourhoods with the highest admission rates had the lowest neighbourhood SES and an aggregated household income close to the federal poverty line. An urban study utilised census data to measure ALSES, ethnicity, population density, proximity to pollution sources and street tree density [26]. They reported that, as well as the association with high population density, street tree density was highest in the most densely populated areas and was associated with a lower prevalence of childhood asthma. The only adult study found no association between population density and asthma incidence, but reported a significant association between income, unemployment and asthma, with those on low incomes and unemployed at a higher risk of developing asthma [27]. Adjusting for age and sex, they found that asthma risk increased with age.
Club foot
One study considered population density and club foot [28]. They found a significant positive correlation between club foot and population density. Both club foot and population density had increased across Denmark over the course of the data they included in the study (16 years). Sex was also a risk marker for club foot, with boys being significantly more likely than girls to develop club foot. Potential confounding factors such as individual or ALSES affecting parental health were not included in the analysis.
Diabetes
As shown in Figure 4, in contrast to the above trends, only one study reported a correlation between diabetes incidence and high population density (48). Eleven studies reported that people living in areas with low population density were more likely to be diagnosed with type 1 diabetes (T1D) [29][30][31][32][33][34][7][35][36][37][38]. Ten of these 11 studies had adjusted for SES, suggesting that low population density could be a useful marker for risk of type 1 diabetes. However, an Australian high-quality study using generalised additive models observed that although increasing levels of ambient UVR led to decreasing incidence of T1D, in areas of high population density an inverse association was observed [39]. The relationship became null prior to increasing, with rising levels of UVR. The authors surmised that this may be due to shading in urban areas leading to reduced UVR exposure and a lower production of vitamin D. In contrast, another study calculated population weighted daily mean sunshine and annual mean UVR over 25 years across England [37]. Neither were associated with T1D incidence.
Having adjusted for physical activity, a longitudinal study of diabetes risk markers observed a decrease in post-challenge-glucose in adults, aged 45 and over, by 3% in high density and low SES neighbourhoods. In medium and high SES neighbourhoods, blood glucose remained stable or with no change, indicating that high population density may be of greatest advantage for low SES individuals [40].
From the Northern hemisphere, a study conducted at county-level measured age, sex and ALSES indicators annually over a 13-year period [29]. Areas of low population density and high green index were associated with T1D incidence. The green index included forests and grasslands and was thus differing from the definition of urban greenspace. Another state-level study found that counties with higher percentage of rural areas were associated with poorer health outcomes, including obesity, diabetes, premature mortality, and physical inactivity [7]. Counties with more grassland were associated with obesity and physical inactivity but lower levels of self-rated mental and physical distress. Associations were smaller with population density than with their rural indicator. Findings from an urban study revealed an association between T1D and low ALSES, but not with population density [41]. The proportion of green space did not attenuate this finding, suggesting that ALSES may influence health behaviours rather than the availability of “urban” green space.
A high-quality UK study measured spatial, temporal and time interaction effects, comparing incidence of childhood T1D and population density at small area level [34]. Incidence rates increased over time. Lower incidence rates were associated with more densely populated areas, deprivation and population mixing.
References
- Beenackers, M.A.; Oude Groeniger, J.; Kamphuis, C.B.M.; Van Lenthe, F.J. Urban population density and mortality in a compact Dutch city: 23-year follow-up of the Dutch GLOBE study. Health Place 2018, 53, 79–85.
- Erwin, P.C.; Fitzhugh, E.C.; Brown, K.C.; Looney, S.; Forde, T. Health Disparities in Rural Areas: The Interaction of Race, Socioeconomic Status, and Geography. J. Health Care Poor Underserved 2010, 21, 931–945.
- Fecht, D.; Fortunato, L.; Morley, D.; Hansell, A.L.; Gulliver, J. Associations between urban metrics and mortality rates in England. Environ. Health 2016, 15 (Suppl. 1), 34.
- Meijer, M.; Kejs, A.M.; Stock, C.; Bloomfield, K.; Ejstrud, B.; Schlattmann, P. Population density, socioeconomic environment and all-cause mortality: A multilevel survival analysis of 2.7 million individuals in Denmark. Health Place 2012, 18, 391–399.
- Tunstall, H.; Mitchell, R.; Gibbs, J.; Platt, S.; Dorling, D. Socio-demographic diversity and unexplained variation in death rates among the most deprived parliamentary constituencies in Britain. J. Public Health 2012, 34, 296–304.
- Villanueva, V.; Garcia, A.M. Mortality and socioeconomic indicators in Spain 1962–1991. Eur. J. Public Health 2000, 10, 268–273.
- Nguyen, Q.C.; Khanna, S.; Dwivedi, P.; Huang, D.; Huang, Y.; Tasdizen, T.; Brunisholz, K.D.; Li, F.; Gorman, W.; Nguyen, T.T. Using Google Street View to examine associations between built environment characteristics and US health outcomes. Prev. Med. Rep. 2019, 14, 100859.
- Agovino, M.; Aprile, M.C.; Garofalo, A.; Mariani, A. Cancer mortality rates and spillover effects among different areas: A case study in Campania (southern Italy). Soc. Sci. Med. 2018, 204, 67–83.
- Gomez, S.L.; Glaser, S.L.; McClure, L.A.; Shema, S.J.; Kealey, M.; Keegan, T.H.M.; Satariano, W.A. The California Neighborhoods Data System: A new resource for examining the impact of neighborhood characteristics on cancer incidence and outcomes in populations. Cancer Causes Control 2011, 22, 631–647.
- Balamurugan, A.; Delongchamp, R.; Bates, J.H.; Mehta, J.L. The neighborhood where you live is a risk factor for stroke. Circ. Cardiovasc. Qual. Outcomes 2013, 6, 668–673.
- Canchola, A.J.; Shariff-Marco, S.; Yang, J.; Albright, C.; Hertz, A.; Park, S.-Y.; Shvetsov, Y.B.; Monroe, K.R.; Le Marchand, L.; Gomez, S.L.; et al. Association between the neighborhood obesogenic environment and colorectal cancer risk in the Multiethnic Cohort. Cancer Epidemiol. 2017, 50, 99–106.
- Chaix, B.; Rosvall, M.; Lynch, J.; Merlo, J. Disentangling contextual effects on cause-specific mortality in a longitudinal 23-year follow-up study: Impact of population density or socioeconomic environment? Int. J. Epidemiol. 2006, 35, 633–643.
- Chaix, B.; Rosvall, M.; Merlo, J. Assessment of the magnitude of geographical variations and socioeconomic contextual effects on ischaemic heart disease mortality: A multilevel survival analysis of a large Swedish cohort. J. Epidemiol. Community Health 2007, 61, 349–355.
- Chouaïd, C.; Debieuvre, D.; Durand-Zaleski, I.; Fernandes, J.; Scherpereel, A.; Westeel, V.; Blein, C.; Gaudin, A.-F.; Ozan, N.; Leblanc, S.; et al. Survival inequalities in patients with lung cancer in France: A nationwide cohort study (the TERRITOIRE Study). PLoS ONE 2017, 12, e0182798.
- Colli, J.; Lee, B.R.; Thomas, R. Population densities in relation to bladder cancer mortality rates in America from 1950 to 1994. Int. Urol. Nephrol. 2012, 44, 443–449.
- Hallberg, Ö. Adverse health indicators correlating with sparsely populated areas in Sweden. Eur. J. Cancer Prev. 2007, 16, 71–76.
- Mahoney, M.C.; LaBrie, D.S.; Nasca, P.C.; Wolfgang, P.E.; Burnett, W.S. Population density and cancer mortality differentials in New York State, 1978-1982. Int. J. Epidemiol. 1990, 19, 483–490.
- McNally, R.J.Q.; Basta, N.O.; Errington, S.; James, P.W.; Norman, P.D.; Hale, J.P.; Pearce, M.S. Socioeconomic patterning in the incidence and survival of teenage and young adult men aged between 15 and 24 years diagnosed with non-seminoma testicular cancer in northern england. Urol. Oncol. 2015, 33, 506-e9.
- Phillips, D.I.W.; Osmond, C.; Williams, M.L.; Jones, A. Air pollution in early life and adult mortality from chronic rheumatic heart disease. Int. J. Epidemiol. 2017, 46, 1107–1114.
- Howe, H.L.; Keller, J.E.; Lehnherr, M. Relation between population density and cancer incidence, Illinois, 1986–1990. Am. J. Epidemiol. 1993, 138, 29–36.
- Meijer, M.; Bloomfield, K.; Engholm, G. Neighbourhoods matter too: The association between neighbourhood socioeconomic position, population density and breast, prostate and lung cancer incidence in Denmark between 2004 and 2008. J. Epidemiol. Community Health 2013, 67, 6–13.
- Sharp, L.; Donnelly, D.; Hegarty, A.; Carsin, A.-E.; Deady, S.; McCluskey, N.; Gavin, A.; Comber, H. Risk of several cancers is higher in urban areas after adjusting for socioeconomic status. Results from a two-country population-based study of 18 common cancers. J. Urban Health 2014, 91, 510–525.
- Carsin, A.E.; Sharp, L.; Comber, H. Geographical, urban/rural and socioeconomic variations in nonmelanoma skin cancer incidence: A population-based study in Ireland. Br. J. Dermatol. 2011, 164, 822–829.
- van der Aa, M.A.; de Vries, E.; Hoekstra, H.J.; Coebergh, J.W.W.; Siesling, S. Sociodemographic factors and incidence of melanoma in the Netherlands, 1994–2005. Eur. J. Cancer 2011, 47, 1056–1060.
- Beck, A.F.; Moncrief, T.; Huang, B.; Simmons, J.M.; Sauers, H.; Chen, C.; Kahn, R.S. Inequalities in neighborhood child asthma admission rates and underlying community characteristics in one US county. J. Pediatrics 2013, 163, 574–580.
- Lovasi, G.S.; Quinn, J.W.; Neckerman, K.M.; Perzanowski, M.S.; Rundle, A. Children living in areas with more street trees have lower prevalence of asthma. J. Epidemiol. Community Health 2008, 62, 647–649.
- Wickrama, K.A.T.; Wickrama, K.A.S.; Romas, J.A. The relationship of individual, family, and community characteristics with physical health: An adult study in 27 rural Minnesota counties. J. Rural Health 2005, 21, 378–382.
- Krogsgaard, M.R.; Jensen, P.K.; Kjaer, I.; Husted, H.; Lorentzen, J.; Hvass-Christensen, B.; Christensen, S.B.; Larsen, K.; Sonne-Holm, S. Increasing incidence of club foot with higher population density: Incidence and geographical variation in Denmark over a 16-year period--an epidemiological study of 936,525 births. Acta Orthop. 2006, 77, 839–846.
- Gopinath, S.; Ortqvist, E.; Norgren, S.; Green, A.; Sanjeevi, C.B. Variations in incidence of type 1 diabetes in different municipalities of stockholm. Ann. N. Y. Acad. Sci. 2008, 1150, 200–207.
- Drewnowski, A.; Rehm, C.D.; Moudon, A.V.; Arterburn, D. The geography of diabetes by census tract in a large sample of insured adults in King County, Washington, 2005–2006. Prev. Chronic Dis. 2014, 11, E125.
- du Prel, J.B.; Icks, A.; Grabert, M.; Holl, R.W.; Giani, G.; Rosenbauer, J. Socioeconomic conditions and type 1 diabetes in childhood in North Rhine-Westphalia, Germany. Diabetologia 2007, 50, 720–728.
- Holmqvist, B.M.; Lofman, O.; Samuelsson, U. A low incidence of Type 1 diabetes between 1977 and 2001 in south-eastern Sweden in areas with high population density and which are more deprived. Diabet. Med. A J. Br. Diabet. Assoc. 2008, 25, 255–260.
- Liese, A.D.; Lamichhane, A.P.; Garzia, S.C.A.; Puett, R.C.; Porter, D.E.; Dabelea, D.; D’Agostino, R.B., Jr.; Standiford, D.; Liu, L. Neighborhood characteristics, food deserts, rurality, and type 2 diabetes in youth: Findings from a case-control study. Health Place 2018, 50, 81–88.
- Manda, S.O.M.; Feltbower, R.G.; Gilthorpe, M.S. Investigating spatio-temporal similarities in the epidemiology of childhood leukaemia and diabetes. Eur. J. Epidemiol. 2009, 24, 743–752.
- Rogers, M.A.M. Onset of type 1 diabetes mellitus in rural areas of the USA. J. Epidemiol. Community Health 2019, 73, 1136–1138.
- Samuelsson, U.; Westerberg, L.; Aakesson, K.; Birkebæk, N.H.; Bjarnason, R.; Drivvoll, A.K.; Skrivarhaug, T.; Svensson, J.; Thorsson, A.; Hanberger, L. Geographical variation in the incidence of type 1 diabetes in the Nordic countries: A study within NordicDiabKids. Pediatric Diabetes 2020, 21, 259–265.
- Sheehan, A.; Freni Sterrantino, A.; Fecht, D.; Elliott, P.; Hodgson, S. Childhood type 1 diabetes: An environment-wide association study across England. Diabetologia 2020, 63, 964–976.
- Staines, A.; Bodansky, H.J.; McKinney, P.A.; Alexander, F.E.; McNally, R.J.; Law, G.R.; Lilley, H.E.; Stephenson, C.; Cartwright, R.A. Small area variation in the incidence of childhood insulin-dependent diabetes mellitus in Yorkshire, UK: Links with overcrowding and population density. Int. J. Epidemiol. 1997, 26, 1307–1313.
- Elliott, J.C.; Lucas, R.M.; Clements, M.S.; Bambrick, H.J. Population density determines the direction of the association between ambient ultraviolet radiation and type 1 diabetes incidence. Pediatric Diabetes 2010, 11, 394–402.
- Van Cauwenberg, J.; Dunstan, D.; Cerin, E.; Koohsari, M.J.; Sugiyama, T.; Owen, N. Population density is beneficially associated with 12-year diabetes risk marker change among residents of lower socio-economic neighborhoods. Health Place 2019, 57, 74–81.
- Faka, A.; Chalkias, C.; Montano, D.; Georgousopoulou, E.N.; Tripitsidis, A.; Koloverou, E.; Tousoulis, D.; Pitsavos, C.; Panagiotakos, D.B. Association of Socio-Environmental Determinants with Diabetes Prevalence in the Athens Metropolitan Area, Greece: A Spatial Analysis. Rev. Diabet. Stud. RDS 2018, 14, 381–389.
More
Information
Contributor
MDPI registered users' name will be linked to their SciProfiles pages. To register with us, please refer to https://encyclopedia.pub/register
:
View Times:
3.0K
Revisions:
2 times
(View History)
Update Date:
14 Mar 2022
Table of Contents


Notice
You are not a member of the advisory board for this topic. If you want to update advisory board member profile, please contact office@encyclopedia.pub.
OK
Confirm
Only members of the Encyclopedia advisory board for this topic are allowed to note entries. Would you like to become an advisory board member of the Encyclopedia?
Yes
No
${ textCharacter }/${ maxCharacter }
Submit
Cancel
Back
Comments
${ item }
|
${ item.createdUser.fullName }
${ item.createdAt }
${ item.vote }
${ item.reply }
Delete
${ reply.createdUser.fullName }
${ reply.createdAt }
${ reply.vote }
Delete
There is no reply to this comment~
${ item.replyTextCharacter }/${ item.replyMaxCharacter }
Submit
Cancel
More
No more~
There is no comment~
${ textCharacter }/${ maxCharacter }
Submit
Cancel
${ selectedItem.replyTextCharacter }/${ selectedItem.replyMaxCharacter }
Submit
Cancel
Confirm
Are you sure to Delete?
Yes
No