Your browser does not fully support modern features. Please upgrade for a smoother experience.
Submitted Successfully!
 +1 credit
Thank you for your contribution! You can also upload a video entry or images related to this topic.
For video creation, please contact our Academic Video Service.
| Version | Summary | Created by | Modification | Content Size | Created at | Operation |
|---|---|---|---|---|---|---|
| 1 | Kayiranga Alphonse | + 1224 word(s) | 1224 | 2022-02-24 07:10:14 | | | |
| 2 | Yvaine Wei | -7 word(s) | 1217 | 2022-03-08 06:58:40 | | |
Video Upload Options
We provide professional Academic Video Service to translate complex research into visually appealing presentations. Would you like to try it?
Cite
If you have any further questions, please contact Encyclopedia Editorial Office.
Alphonse, K. Spatiotemporal Variation in Gross Primary Productivity. Encyclopedia. Available online: https://encyclopedia.pub/entry/20294 (accessed on 19 June 2026).
Alphonse K. Spatiotemporal Variation in Gross Primary Productivity. Encyclopedia. Available at: https://encyclopedia.pub/entry/20294. Accessed June 19, 2026.
Alphonse, Kayiranga. "Spatiotemporal Variation in Gross Primary Productivity" Encyclopedia, https://encyclopedia.pub/entry/20294 (accessed June 19, 2026).
Alphonse, K. (2022, March 07). Spatiotemporal Variation in Gross Primary Productivity. In Encyclopedia. https://encyclopedia.pub/entry/20294
Alphonse, Kayiranga. "Spatiotemporal Variation in Gross Primary Productivity." Encyclopedia. Web. 07 March, 2022.
Copy Citation
Carbon uptake through the photosynthesis process by a terrestrial ecosystem termed gross primary productivity (GPP) is the way CO2 enters into the biosphere from the atmosphere. GPP not only drives the ecosystem functioning but also takes part in terrestrial carbon sequestration through phenological and physiological processes.
gross primary productivity
light-use efficiency
Carnegie-Ames-Stanford Approaches (CASA) model
vegetation photosynthesis model (VPM)
1. Introduction
During the few past decades, some research has indicated that the accumulation rate of atmospheric CO2 has significantly increased and land and ocean sinks have exhibited a higher inter-annual variability. These changes in CO2 and sinks were significantly associated with the continuous major global climate change [1][2]. However, different diagnostic and prognostic models were developed and operated to estimate the spatial and temporal patterns of gross primary productivity (GPP) variability [1][3][4][5].
These models are grouped into four categories based on their fundamental theories: enzymes kinetic process-based model, the light-use efficiency (LUE) or production efficiency models, machine learning models based on eddy covariance (EC), and other measurements statistically based on sun-induced chlorophyll fluorescence (SIF) models, respectively [5][6][7][8]. Among these approaches (models), the LUE models are widely used because of their simplicity of using the satellite-based production efficiency models (PEMs) and the capability of offering a relative balance at different spatial–temporal scales (hourly, daily, 8 days, 16 days, monthly and yearly; 250, 500 and 1000 m) [9][10][11].
LUE models are well understood at the leaf level and defined as the slope of the photosynthesis curve in the light-limited section [8]; hence, their initialization depends on variations from fractional photosynthesis active radiation (FPAR) through canopy and chlorophyll processes [4]. However, an accurate GPP estimation itself cannot provide accurate information about the ecosystem services to extreme climatic events but can help to predict future carbon cycle dynamics and their relationship to climate change [2][12]. Although the LUE models proved to be indispensable in GPP estimation, the comparison of different GPP-based models is more important to indicate the more reliable and higher accurate models for GPP simulations [13][14].
The application of GPP-based LUE models, especially in well-watered areas, provides a good understanding of how photosynthetic processes are regulated by ecosystem factors (biotic and abiotic) and climate factors, i.e., water availability (rainfall), temperature and other climate factors [4][5][14][15].
Over the past decades, multiple observations on the enhancement of seasonal and annual exchanges of CO2 and GPP variations, especially in the ecosystems induced by CO2 fertilization and with a limited extent of the growing season, were carried out from global to local scales. These variations of GPP indicated distinctive spatial pattern changes with climate in the hotspot ecosystems such as arid and grassland ecosystems [3][16][17]. Several research studies associated these changes with gradual variations in water availability and precipitation patterns [18][19].
2. Model Validation and GPP Simulation Stability
The model performance validation against GPP-EC indicated that the estimated GPP outputs were significantly correlated with GPP-EC (the verifier) with higher R2 values (p < 0.05), lesser RMSE and RE values and tolerable BIAS values according to O’Hara [20]. This assessment indicated a strong correlation (R2 = 0.88) between GPP–EC and GPP-CASA (Carnegie–Ames–Stanford Approaches), followed by vegetation photosynthetic model (VPM) Canopy model with the correction of R2 = 0.85 between GPP-EC and GPP–VPM Canopy. GPP-VPMChl and MOD17A2H values exhibited optimal and fair correlations with GPP-EC at R2 = 0.72 and R2 = 0.59, respectively. The CASA model indicated the lowest simulation error values among all the other employed LUE models, which indicates the indispensability of the CASA model to simulate GPP in the GLR-SSA and other tropical-related ecosystems. The model validation results and LUE models’ stability assessment results are illustrated in Figure 1.
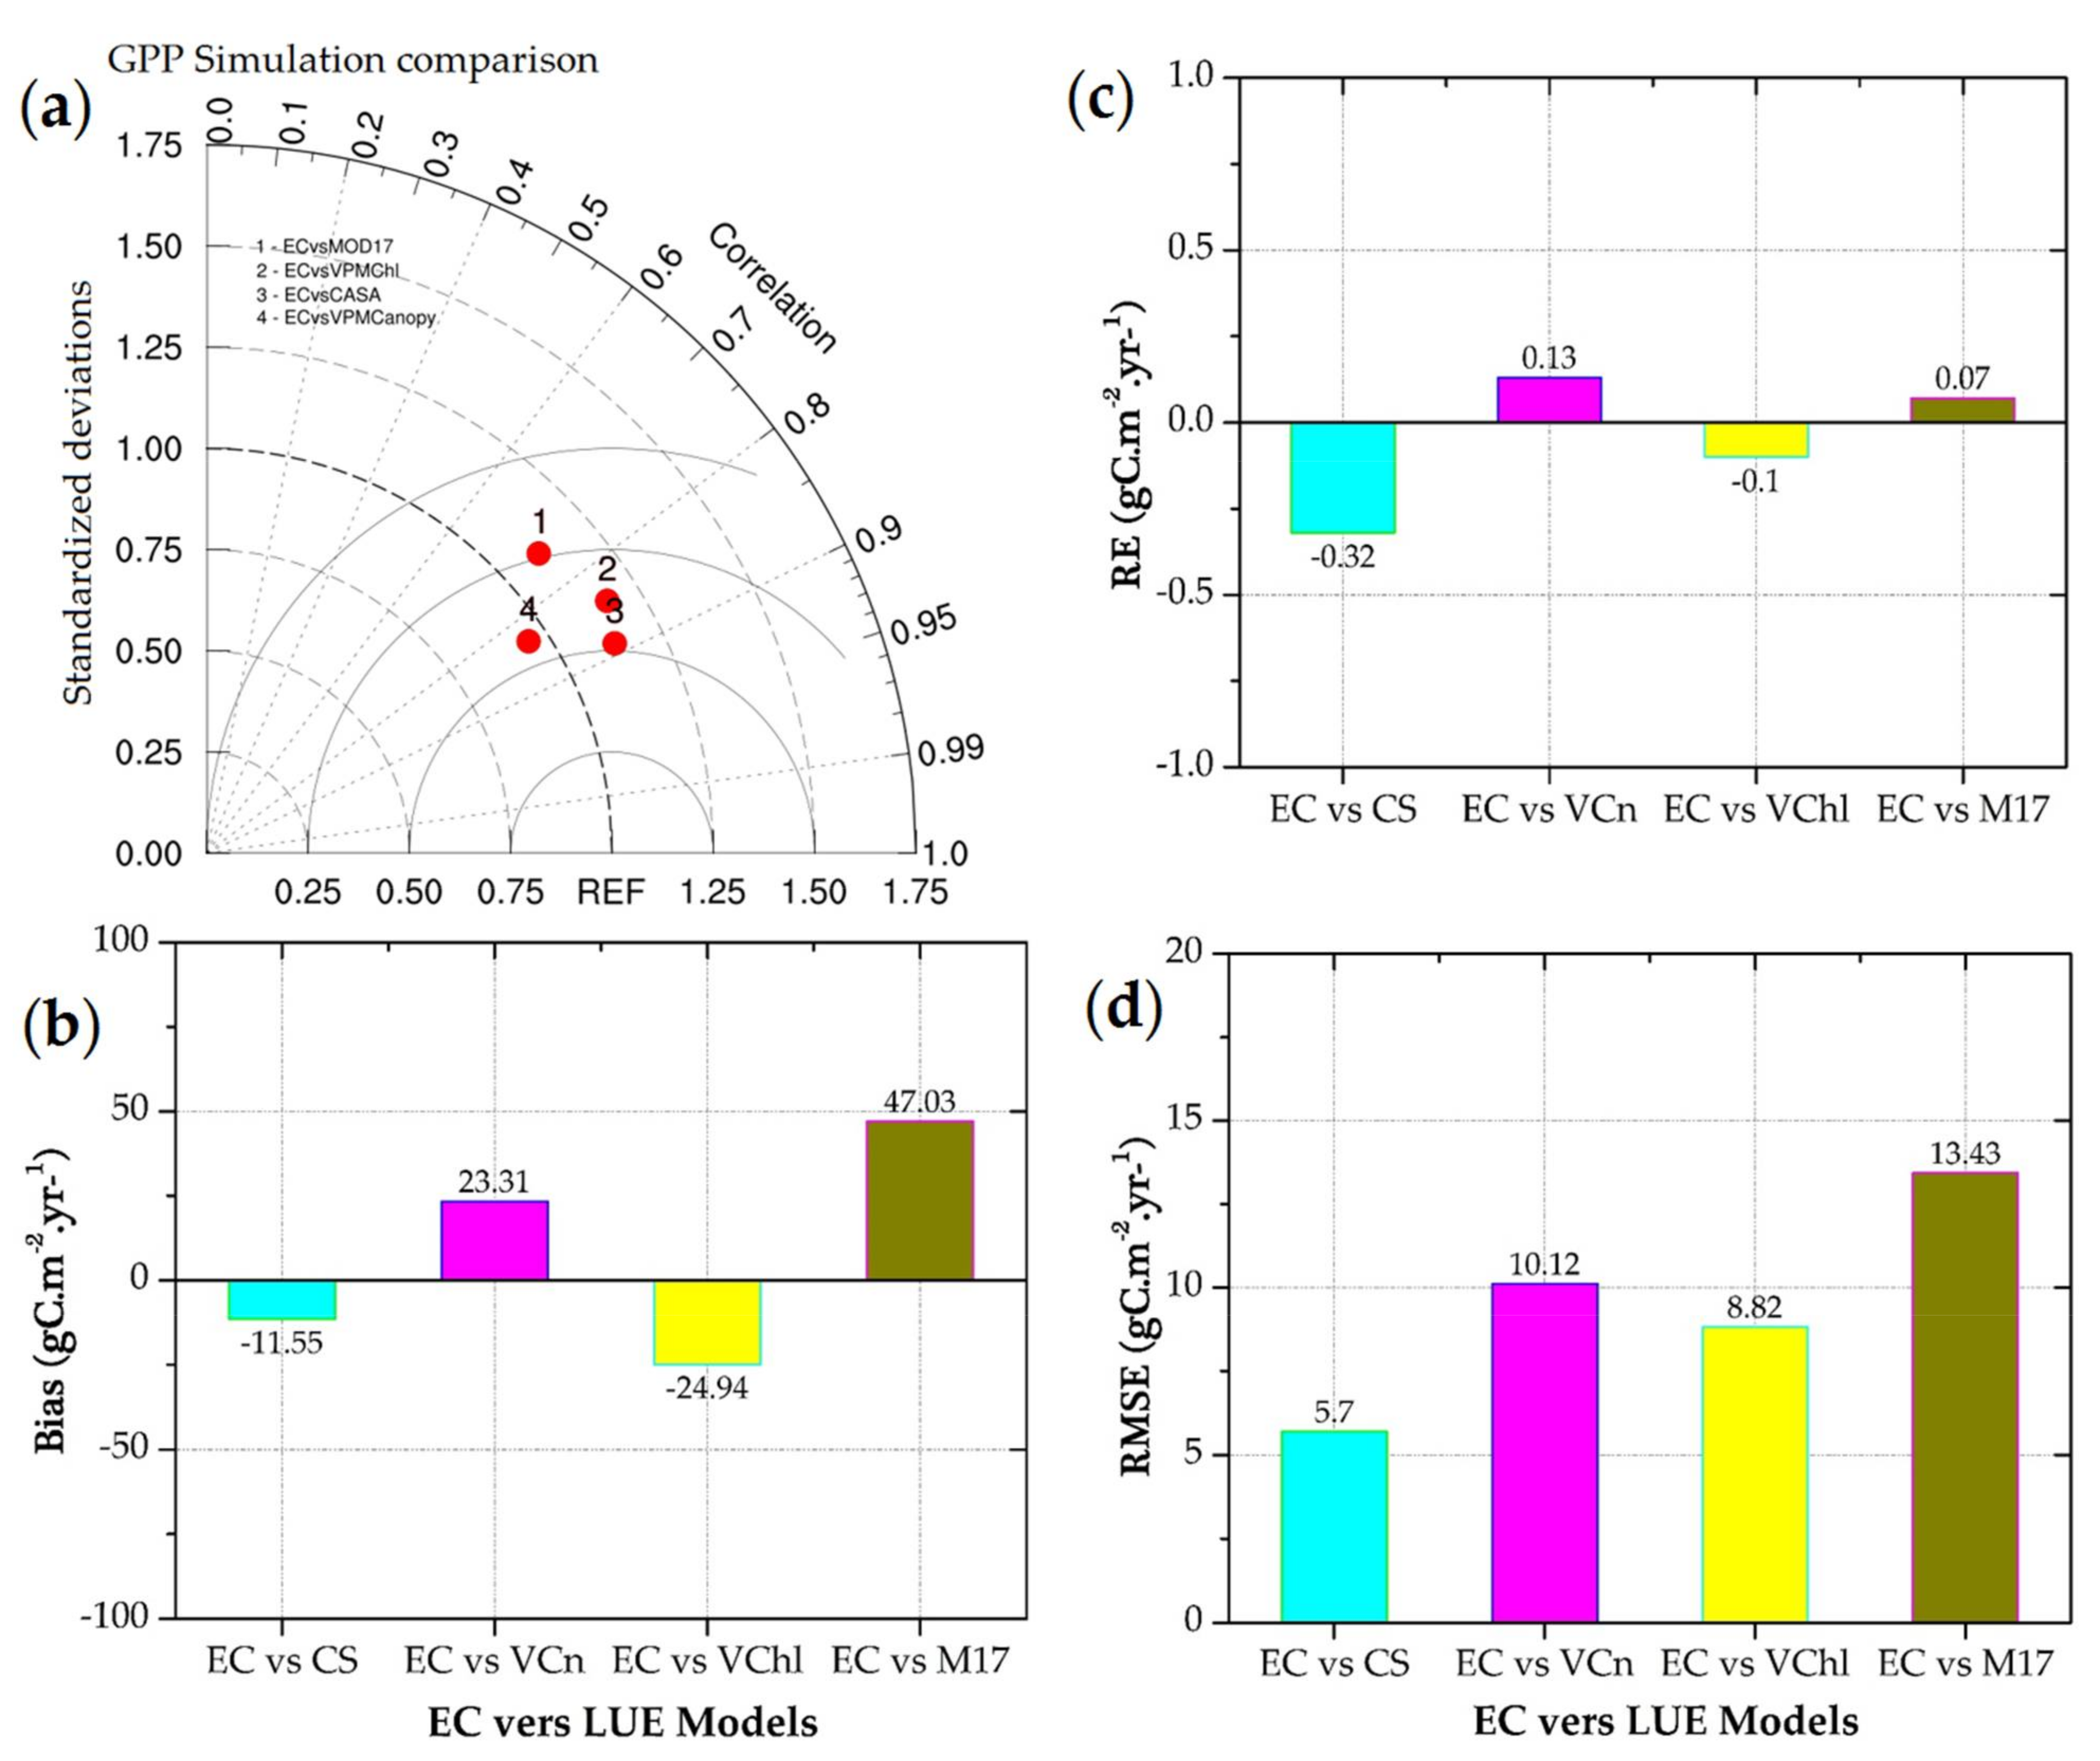
Figure 1. The overall accuracy between the observed and simulated GPP results and LUE models simulation stability assessment results. (a) Taylor diagram indicating the standard deviation and correlation between the observed GPP-based on FLUXCOM (GPP-EC) and the simulated GPP-based on CASA, VPMCanopy, VPMChl and the observed MOD17A2H at significant level p < 0.05, (b) root mean square errors, (c) relative errors and (d) bias values between the observed GPP values and the simulated values. EC stands for GPP-EC; CS for CASA; VChl for VPMchl; Vcn for VPM canopy; and M17 for MOD17A2H.
3. Seasonal and Inter-Annual Variations in GPP during 2001–2016
An analysis of the seasonal and inter-annual GPP variations revealed that the mean monthly GPP varied between 15 and 180 g C·m−2·month−1. The seasons between December and May (Dec-Jan-Feb and Mar-Apr-May) were characterized by higher GPP values (≥80 g C·m−2·month−1). This analysis also indicted that seasonal–monthly GPP variation reached the peak values in February-March (≥160 g C·m−2·month−1). The mean annual GPP varied between 1000 and 1600 g C·m−2·yr−1. The optimal increases were observed during 2002–2003, 2011–2013 and 2015–2016: while decreasing trends were detected during 2006–2007, 2010–2011 and 2013–2014, the other periods were characterized by interchanges of decreases and increases over both the modelled and observed GPP estimates (Figure 2).
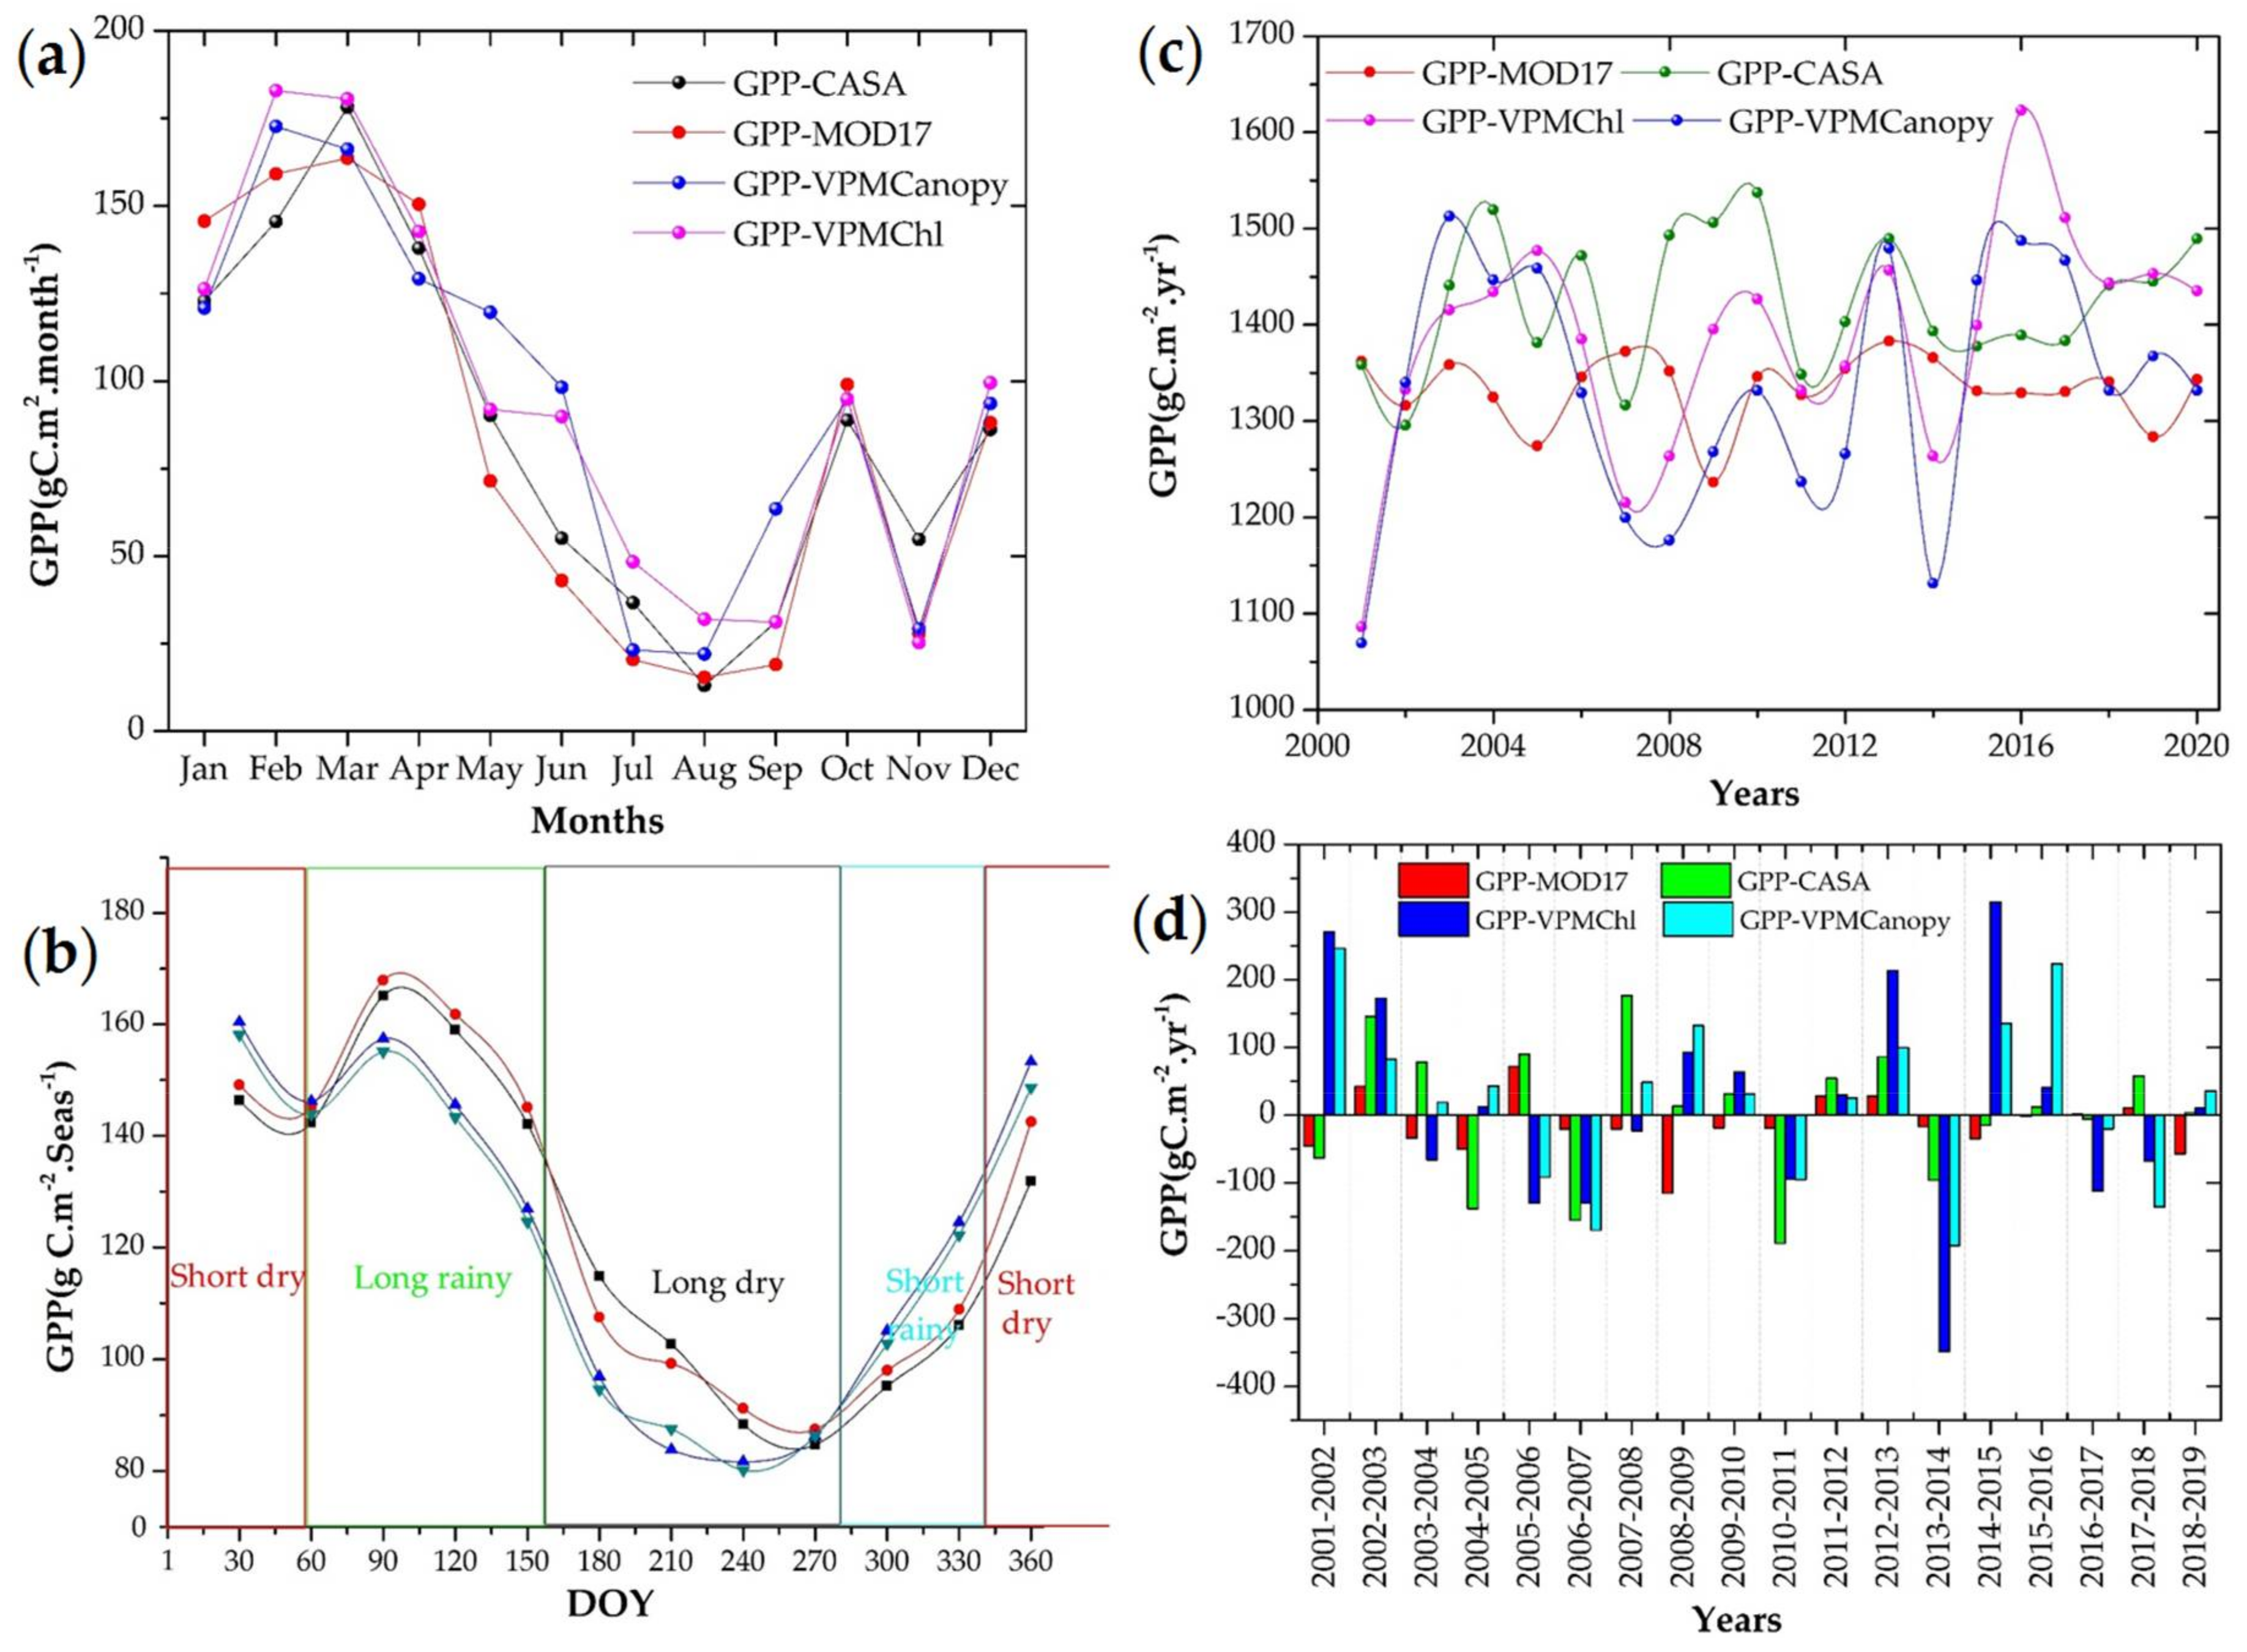
Figure 2. Monthly, seasonal and inter-annual variations of GPP in different LUE models, (a) monthly variations; (b) seasonal variations; (c) annual variations; and (d) inter-annual GPP changes during 2001–2020.
4. Spatiotemporal Dynamics in GPP and GPP-LUE Models’ Performance Reliability
The combined of vegetation indices and climate factors have been often used to simulate seasonal and annual GPP dynamics [15]. The vegetation phenology APAR at canopy level and APAR at chlorophyll were highly suggested to separate GPP estimates [4][21]. The distinctions between APAR canopy and APAR chlorophyll reactions and the PAR absorbed photosynthetic components were considered as fundamental components and main datasets to run the employed LUE models. Given that, the ecosystems characterized by high vegetation cover (high EVI and NDVI values) indicated high GPP values [6][7][8][17].
The performance of four GPP–LUE models (CASA, VPM canopy, VPM Chl and MOD17) were highly consistent in their predictions of dynamics and magnitude changes in seasonal and annual GPPs based on their comparison with the field based GPP observations (GPP-EC) (Figure 1). According to the results, CASA and VPM Canopy models indicated more reliability to track the magnitude annual and seasonal GPP dynamics. As supported by the comparison of GPP-CASA and GPP-VPM canopy simulations against the field based GPP observations (GPP-EC), these two LUE models indicated strong positive relationships (R2 = 0.88 and R2 = 0.85) with GPP-EC (Figure 1).
5. Seasonal and Inter-Annual Variability of GPP and Its Relationship with Climate
Vegetation growth is constrained by growing season length. Rising temperature and higher precipitation rates could extend the growing season length and significantly increase GPP [22]. In rainy seasons, the temperature sensitivity to GPP becomes high, while respiration becomes low. By contrast, respiration cost is as high as GPP. This argument was obviously supported by the results, where the highest GPP values from both modelled GPP and observed GPP were obtained in rainy seasons (GPP increased from short to long rainy seasons), while they declined more sharply with long dry seasons (Figure 2b).
This may prove the sensitivity of precipitation and temperature to the GPP variations. The general incline of GPP in wet conditions and the decline of GPP in dry conditions are consistent with the results found in previous studies at regional and global scales [1][22][23][24]. The previous research indicated a future high dependency of water-related control on GPP variations specifically in the tropical and temperate (humid and semi-humid) climates [11][12][25]. Figure 2b indicates that GPP increases trend starts by the short rainy period and being affected by the end of short dry season. It resurges with the long rainy season and starts its decline towards the onset of the long dry season (Figure 2b).
References
- He, Y.; Piao, S.; Li, X.; Chen, A.; Qin, D. Global patterns of vegetation carbon use efficiency and their climate drivers deduced from MODIS satellite data and process-based models. Agric. For. Meteorol. 2018, 256, 150–158.
- Niu, S.; Fu, Z.; Luo, Y.; Stoy, P.C.; Keenan, T.F.; Poulter, B.; Zhang, L.; Piao, S.; Zhou, X.; Zheng, H.; et al. Interannual variability of ecosystem carbon exchange: From observation to prediction. Glob. Ecol. Biogeogr. 2017, 26, 1225–1237.
- Madani, N.; Kimball, J.S.; Ballantyne, A.P.; Affleck, D.L.; Bodegom, P.M.; Reich, P.B.; Kattge, J.; Sala, A.; Nazeri, M.; Jones, M.O.; et al. Future global productivity will be affected by plant trait response to climate. Sci. Rep. 2018, 8, 2870.
- Wagle, P.; Gowda, P.H.; Xiao, X.; Anup, K. Parameterizing ecosystem light use efficiency and water use efficiency to estimate maize gross primary production and evapotranspiration using MODIS EVI. Agric. For. Meteorol. 2016, 222, 87–97.
- Wang, X.; Tan, K.; Chen, B.; Du, P. Assessing the spatiotemporal variation and impact factors of net primary productivity in China. Sci. Rep. 2017, 7, 44415.
- Wei, S.; Yi, C.; Fang, W.; Hendrey, G. A global study of GPP focusing on light-use efficiency in a random forest regression model. Ecosphere 2017, 8, e01724.
- Liu, L.; Guan, L.; Liu, X. Directly estimating diurnal changes in GPP for C3 and C4 crops using far-red sun-induced chlorophyll fluorescence. Agric. For. Meteorol. 2017, 232, 1–9.
- Wu, Z.; Boke-Olen, N.; Fensholt, R.; Ardö, J.; Eklundh, L.; Lehsten, V. Effect of climate dataset selection on simulations of terrestrial GPP: Highest uncertainty for tropical regions. PLoS ONE 2018, 13, e0199383.
- Cramer, W.; Kicklighter, D.W.; Bondeau, A.; Iii, B.M.; Churkina, G.; Nemry, B.; Ruimy, A.; Schloss, A.L. Comparing global models of terrestrial net primary productivity (NPP): Overview and key results. Glob. Change Biol. 1999, 5, 1–15.
- Sannigrahi, S. Modeling terrestrial ecosystem productivity of an estuarine ecosystem in the Sundarban Biosphere Region, India using seven ecosystem models. Ecol. Model. 2017, 356, 73–90.
- Kayiranga, A.; Chen, B.; Trisurat, Y.; Ndayisaba, F.; Sun, S.; Tuankrua, V.; Wang, F.; Karamage, F.; Measho, S.; Nthangeni, W.; et al. Water Use Efficiency-Based Multiscale Assessment of Ecohydrological Resilience to Ecosystem Shifts Over the Continent of Africa During 1992–2015. J. Geophys. Res. Biogeosci. 2020, 125, e2020JG005749.
- Kayiranga, A.; Chen, B.; Guo, L.; Measho, S.; Hirwa, H.; Liu, S.; Bofana, J.; Sun, S.; Wang, F.; Karamage, F.; et al. Spatiotemporal variations of forest ecohydrological characteristics in the Lancang-Mekong region during 1992–2016 and 2020–2099 under different climate scenarios. Agric. For. Meteorol. 2021, 310, 108662.
- Wang, L.; Zhu, H.; Lin, A.; Zou, L.; Qin, W.; Du, Q. Evaluation of the latest MODIS GPP products across multiple biomes using Global Eddy Covariance Flux Data. Remote Sens. 2017, 9, 418.
- Wagle, P.; Zhang, Y.; Jin, C.; Xiao, X. Comparison of solar-induced chlorophyll fluorescence, light-use efficiency, and process-based GPP models in maize. Ecol. Appl. 2016, 26, 1211–1222.
- Wang, J.; Xiao, X.; Wagle, P.; Ma, S.; Baldocchi, D.; Carrara, A.; Zhang, Y.; Dong, J.; Qin, Y. Canopy and climate controls of gross primary production of Mediterranean-type deciduous and evergreen oak savannas. Agric. For. Meteorol. 2016, 226, 132–147.
- Liu, X.; Chen, X.; Li, R.; Long, F.; Zhang, L.; Zhang, Q.; Li, J. Water-use efficiency of an old-growth forest in lower subtropical China. Sci. Rep. 2017, 7, 42761.
- Czubaszek, R. Exchange of Carbon Dioxide Between the Atmosphere and the Maize Field Fertilized with Digestate from Agricultural Biogas Plant. J. Ecol. Eng. 2019, 20, 145–151.
- Measho, S.; Chen, B.; Trisurat, Y.; Pellikka, P.; Guo, L.; Arunyawat, S.; Tuankrua, V.; Ogbazghi, W.; Yemane, T. Spatio-Temporal Analysis of Vegetation Dynamics as a Response to Climate Variability and Drought Patterns in the Semiarid Region, Eritrea. Remote Sens. 2019, 11, 724.
- Qu, C.; Hao, X.; Qu, J.J. Monitoring Extreme Agricultural Drought over the Horn of Africa (HOA) Using Remote Sensing Measurements. Remote Sens. 2019, 11, 902.
- O’Hara, R.; Merilä, J. Bias and precision in QST estimates: Problems and some solutions. Genetics 2005, 171, 1331–1339.
- Wagle, P.; Xiao, X.; Torn, M.S.; Cook, D.R.; Matamala, R.; Fischer, M.L.; Jin, C.; Dong, J.; Biradar, C. Sensitivity of vegetation indices and gross primary production of tallgrass prairie to severe drought. Remote Sens. Environ. 2014, 152, 1–14.
- Kang, X.; Hao, Y.; Cui, X.; Chen, H.; Huang, S.; Du, Y.; Li, W.; Kardol, P.; Xiao, X.; Cui, L.; et al. Variability and changes in climate, phenology, and gross primary production of an alpine wetland ecosystem. Remote Sens. 2016, 8, 391.
- Kwon, Y.; Larsen, C.P. Effects of forest type and environmental factors on forest carbon use efficiency assessed using MODIS and FIA data across the eastern USA. Int. J. Remote Sens. 2013, 34, 8425–8448.
- Zhang, Y.; Yu, G.; Yang, J.; Wimberly, M.C.; Zhang, X.; Tao, J.; Jiang, Y.; Zhu, J. Climate-driven global changes in carbon use efficiency. Glob. Ecol. Biogeogr. 2014, 23, 144–155.
- Kayiranga, A.; Chen, B.; Zhang, H.; Nthangeni, W.; Measho, S.; Ndayisaba, F. Spatially explicit and multiscale ecosystem shift probabilities and risk severity assessments in the greater Mekong subregion over three decades. Sci. Total Environ. 2021, 798, 149281.
More
Information
Subjects:
Area Studies
Contributor
MDPI registered users' name will be linked to their SciProfiles pages. To register with us, please refer to https://encyclopedia.pub/register
:
View Times:
1.0K
Entry Collection:
Environmental Sciences
Revisions:
2 times
(View History)
Update Date:
10 Mar 2022
Table of Contents


Notice
You are not a member of the advisory board for this topic. If you want to update advisory board member profile, please contact office@encyclopedia.pub.
OK
Confirm
Only members of the Encyclopedia advisory board for this topic are allowed to note entries. Would you like to become an advisory board member of the Encyclopedia?
Yes
No
${ textCharacter }/${ maxCharacter }
Submit
Cancel
Back
Comments
${ item }
|
${ item.createdUser.fullName }
${ item.createdAt }
${ item.vote }
${ item.reply }
Delete
${ reply.createdUser.fullName }
${ reply.createdAt }
${ reply.vote }
Delete
There is no reply to this comment~
${ item.replyTextCharacter }/${ item.replyMaxCharacter }
Submit
Cancel
More
No more~
There is no comment~
${ textCharacter }/${ maxCharacter }
Submit
Cancel
${ selectedItem.replyTextCharacter }/${ selectedItem.replyMaxCharacter }
Submit
Cancel
Confirm
Are you sure to Delete?
Yes
No