Your browser does not fully support modern features. Please upgrade for a smoother experience.
Submitted Successfully!
 +1 credit
Thank you for your contribution! You can also upload a video entry or images related to this topic.
For video creation, please contact our Academic Video Service.
| Version | Summary | Created by | Modification | Content Size | Created at | Operation |
|---|---|---|---|---|---|---|
| 1 | Gun Yong Sung | + 2594 word(s) | 2594 | 2022-02-25 04:54:41 | | | |
| 2 | Rita Xu | -43 word(s) | 2551 | 2022-03-07 03:07:40 | | |
Video Upload Options
We provide professional Academic Video Service to translate complex research into visually appealing presentations. Would you like to try it?
Cite
If you have any further questions, please contact Encyclopedia Editorial Office.
Sung, G.Y. Interleukin-4 and Interleukin-13 Induced Atopic Dermatitis. Encyclopedia. Available online: https://encyclopedia.pub/entry/20231 (accessed on 23 July 2026).
Sung GY. Interleukin-4 and Interleukin-13 Induced Atopic Dermatitis. Encyclopedia. Available at: https://encyclopedia.pub/entry/20231. Accessed July 23, 2026.
Sung, Gun Yong. "Interleukin-4 and Interleukin-13 Induced Atopic Dermatitis" Encyclopedia, https://encyclopedia.pub/entry/20231 (accessed July 23, 2026).
Sung, G.Y. (2022, March 04). Interleukin-4 and Interleukin-13 Induced Atopic Dermatitis. In Encyclopedia. https://encyclopedia.pub/entry/20231
Sung, Gun Yong. "Interleukin-4 and Interleukin-13 Induced Atopic Dermatitis." Encyclopedia. Web. 04 March, 2022.
Copy Citation
Atopic dermatitis (AD) is a chronic inflammatory skin disease associated with widespread barrier dysfunction and T helper 2 (Th2) cytokines. AD is an imbalance in the Th2 immune response where there is an increase in the gene expression levels of major Th2 cytokines during the acute phase.
atopic dermatitis
skin-on-a-chip
human skin equivalent
interleukin-4
interleukin-13
1. Introduction
It is characterized by dry erythema and severe itching. At the histological level, acute AD exhibits spongiosis in the basal epidermal layer [1]. Spongiosis is a morphology where the intercellular space of the skin tissue expands as edema liquid accumulates due to changes in cohesion between skin normal human epidermal keratinocytes (NHEKs). Atopic dermatitis in the chronic phase, lichenificated lesions, typically shows epidermal hyperplasia and parakeratotic hyperkeratosis. Stratum basal expansion, stratum spinosum and stratum granulosum (SG) reduction and stratum corneum (SC) thickening are observed because of terminal keratin cell differentiation defects [2][3][4]. Currently, the etiopathogenesis of AD is not well understood, at least partially because there is no physiologically appropriate disease model in terms of disease complexity and multifactorial nature. AD is likely caused by epidermal barrier alteration and Th2 immune response dysregulation [5][6].
The formation of skin barriers and the effects of cytokines on selected targets during differentiation processes in cell culture and animal studies have been studied [7]. In the stratum basale layer, cytokines including IL-4, IL-13, IL-20, IL-24, IL-22, IL-1α and tumor necrosis factor inhibit keratin synthesis, which affects profilaggrin synthesis in the next layer. These cytokines suppress the formation of the filaggrin/keratin network and weaken the function of the barrier. In the SC layer, desquamation is promoted by IL-4 and IL-13. During the differentiation process, IL-4, IL-13 and IL-22 suppress the expression of involucrin and loricrin and the formation of the cornified envelope [7].
In skin lesions in patients with AD, the Th2 cytokines IL-4 and IL-13 are expressed at much higher levels. Barrier dysfunction in AD is associated with downregulation of barrier-related molecules such as filaggrin (FLG), loricrin (LOR) and involucrin (IVL) [8]; Figure 1 shows a schematic diagram summarizing this.
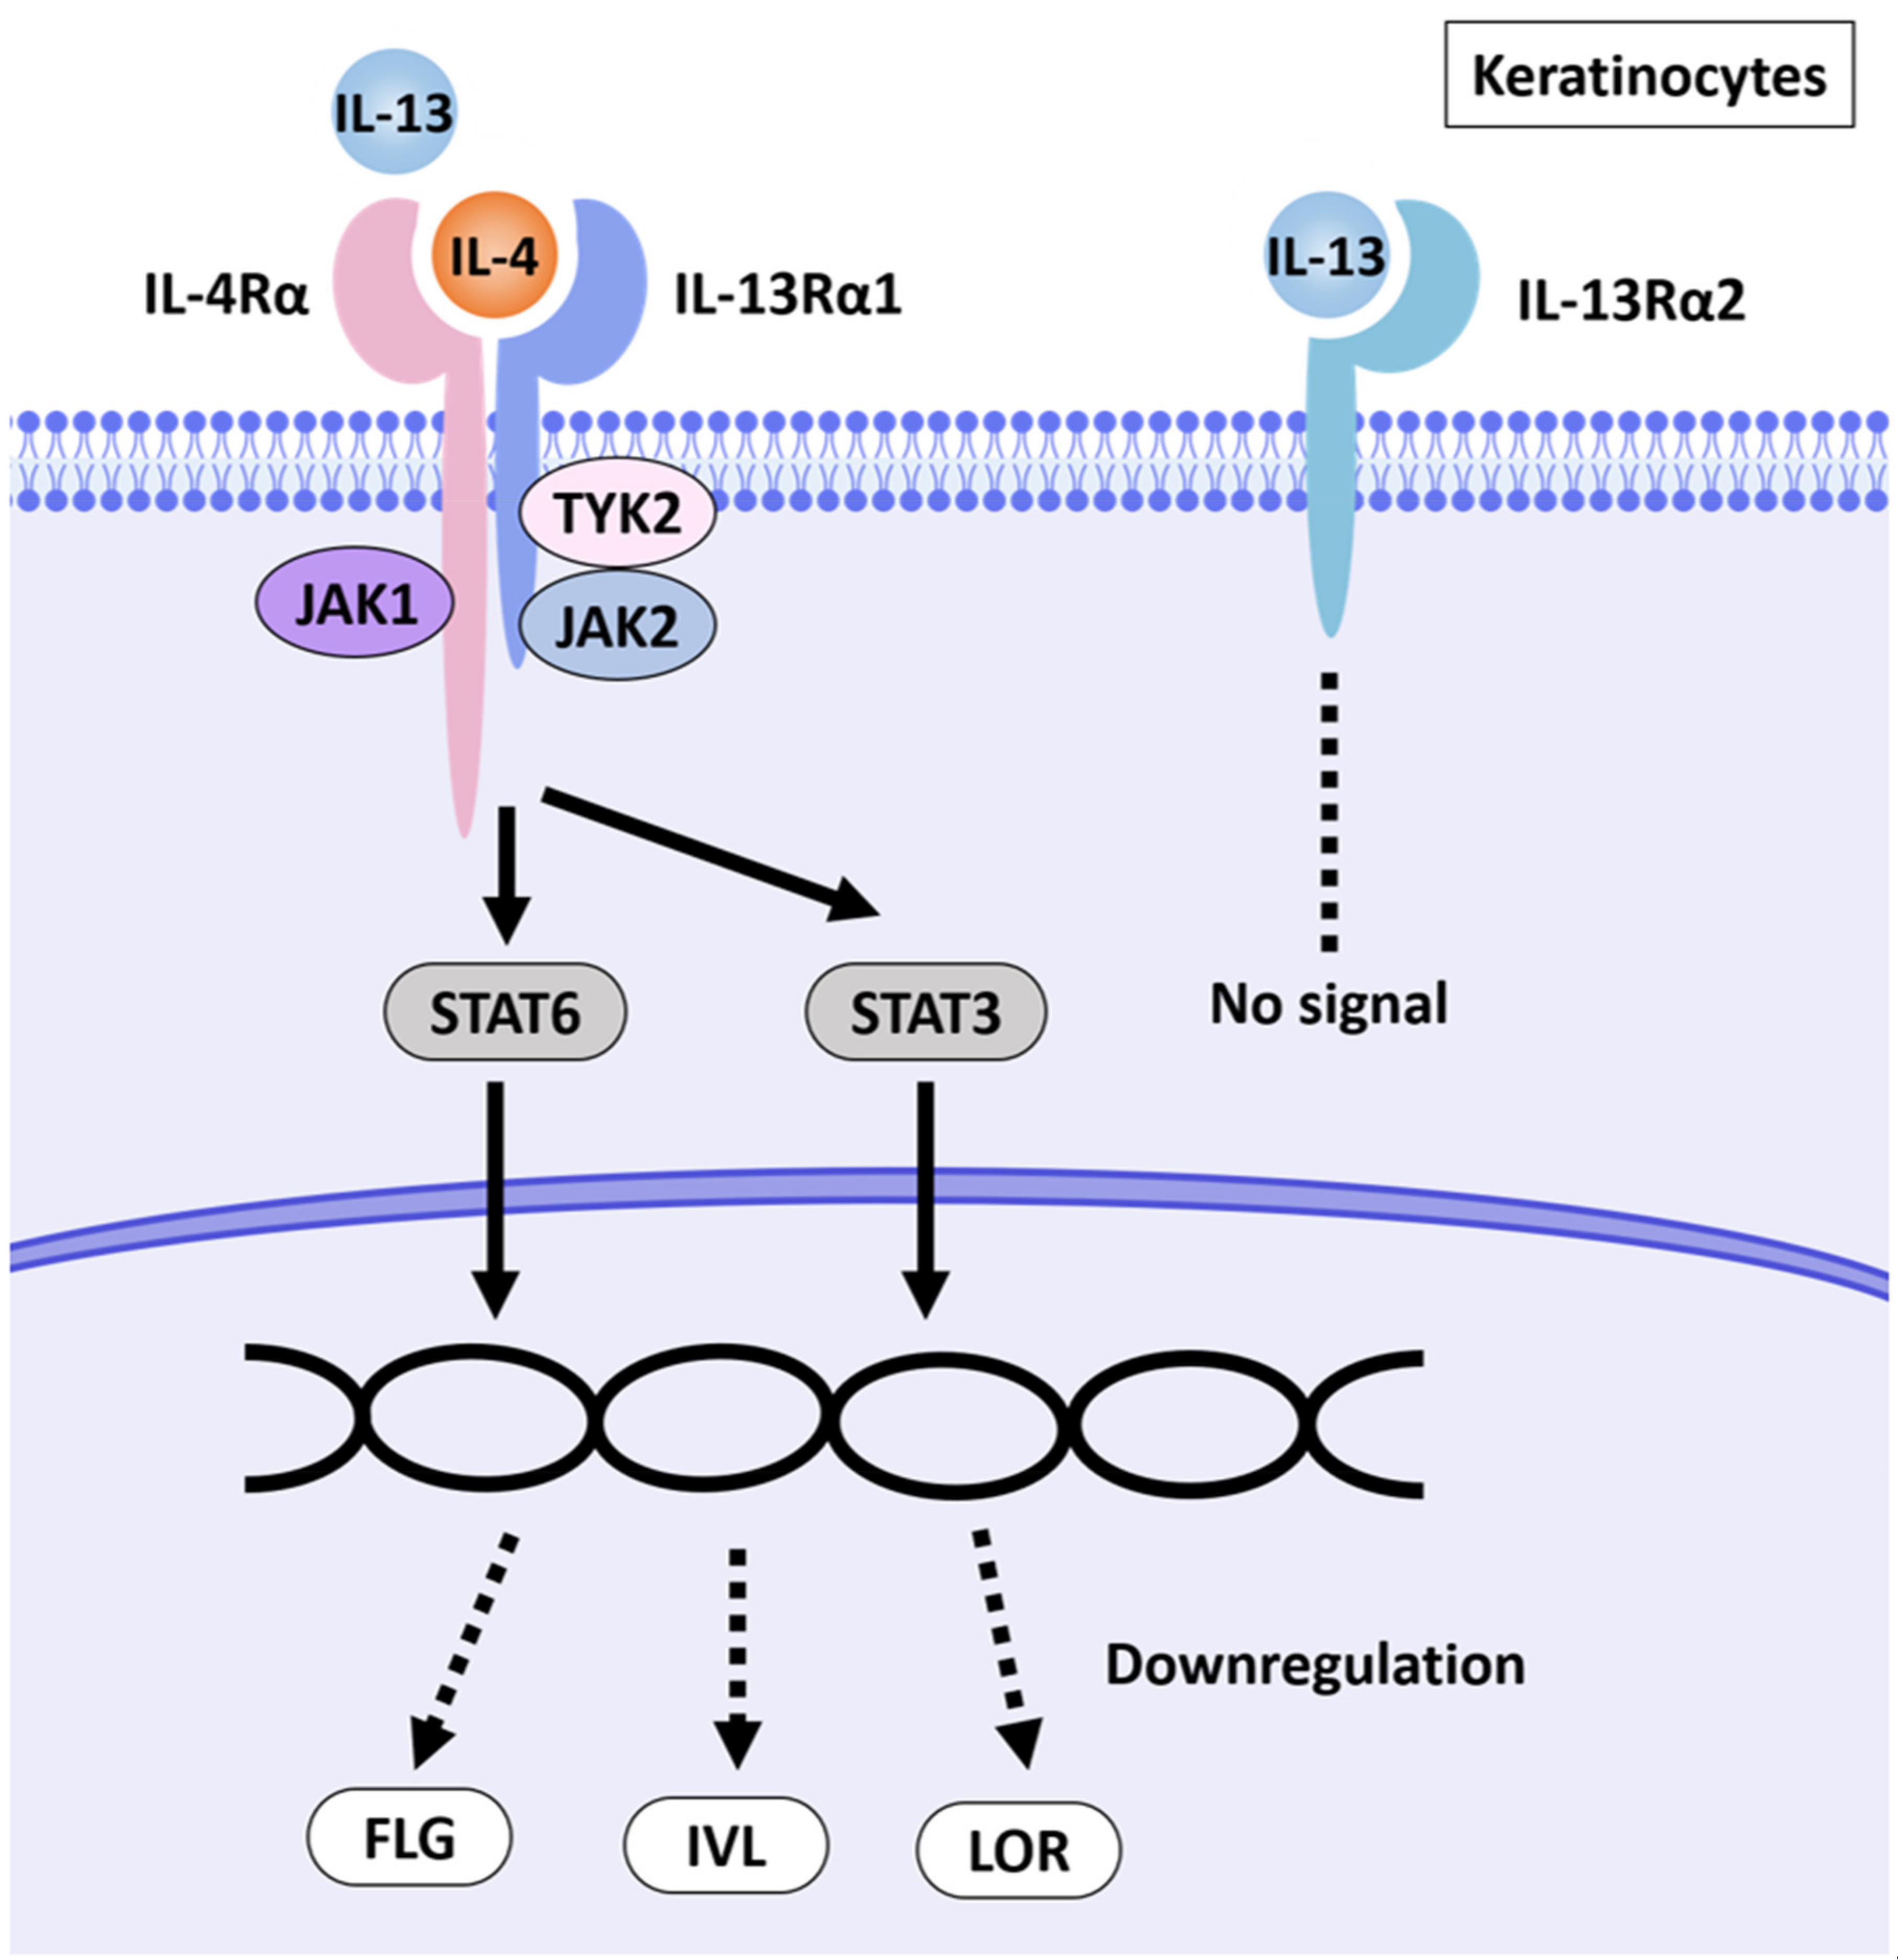
Figure 1. Schematic illustration of AD pathways induced by IL-4 and IL-13. IL-4 and IL-13 have partly shared receptor systems. Corneocytes express the IL-4Rα/IL-13Rα1 complex. IL-4 and IL-13 share IL-4Rα/IL-13Rα1 in NHEKs, activate the JAK1/JAK2/TYK2-STAT6 and -STAT3 pathways and inhibit the expression of EDC molecules such as FLG, LOR and IVL. NHEKs also express IL-13Rα2, a prey receptor for IL-13. IL-13Rα2 binds to IL-13 with high affinity but does not transmit a signal [9][10][11].
Recently, regulation of animal testing has increased interest in alternative models [12], which either do not use animals or reduce the number of animals or reduce pain (3Rs; replacement, reduction and refinement) [13]. Existing animal models are expensive and bear ethical concerns. In addition, the structure of the skin and the immune response in animals differ from those of humans [14]. To overcome this limitation, three-dimensional (3D) cell culture models for culturing human-derived cells using extracellular matrix (ECM) scaffolds are being investigated. Three-dimensional culture has the advantage of creating an environment that is similar to complex in vivo conditions [15][16]. Treatment of AD currently requires a viable in vitro model to test new molecules [17].
Skin-on-a-chip (SOC), a microphysiological system technology in 3D culture, utilizes human skin equivalent (HSE), which has the same characteristics as human skin, as it allows drug screening to be performed quickly and easily [18][19]. A pumpless SOC can be operated more simply and can be tested on drugs using a microphysiological system [20][21]. This system can create a biomimetic environment that reproduces various physiological functions, such as the supply of nutrients to cells via microfluidic channels and the removal of cell waste without a pump.
2. Alteration of Tissue Morphology of the AD-like HSE Model
Morphological changes in the AD-like HSE model were examined by hematoxylin and eosin (H&E) staining (Figure 2a–l). From the results of H&E staining, five regions were randomly designated, and the total thickness of epidermis and the thickness of SC only were measured and quantified (Figure 2m,n).
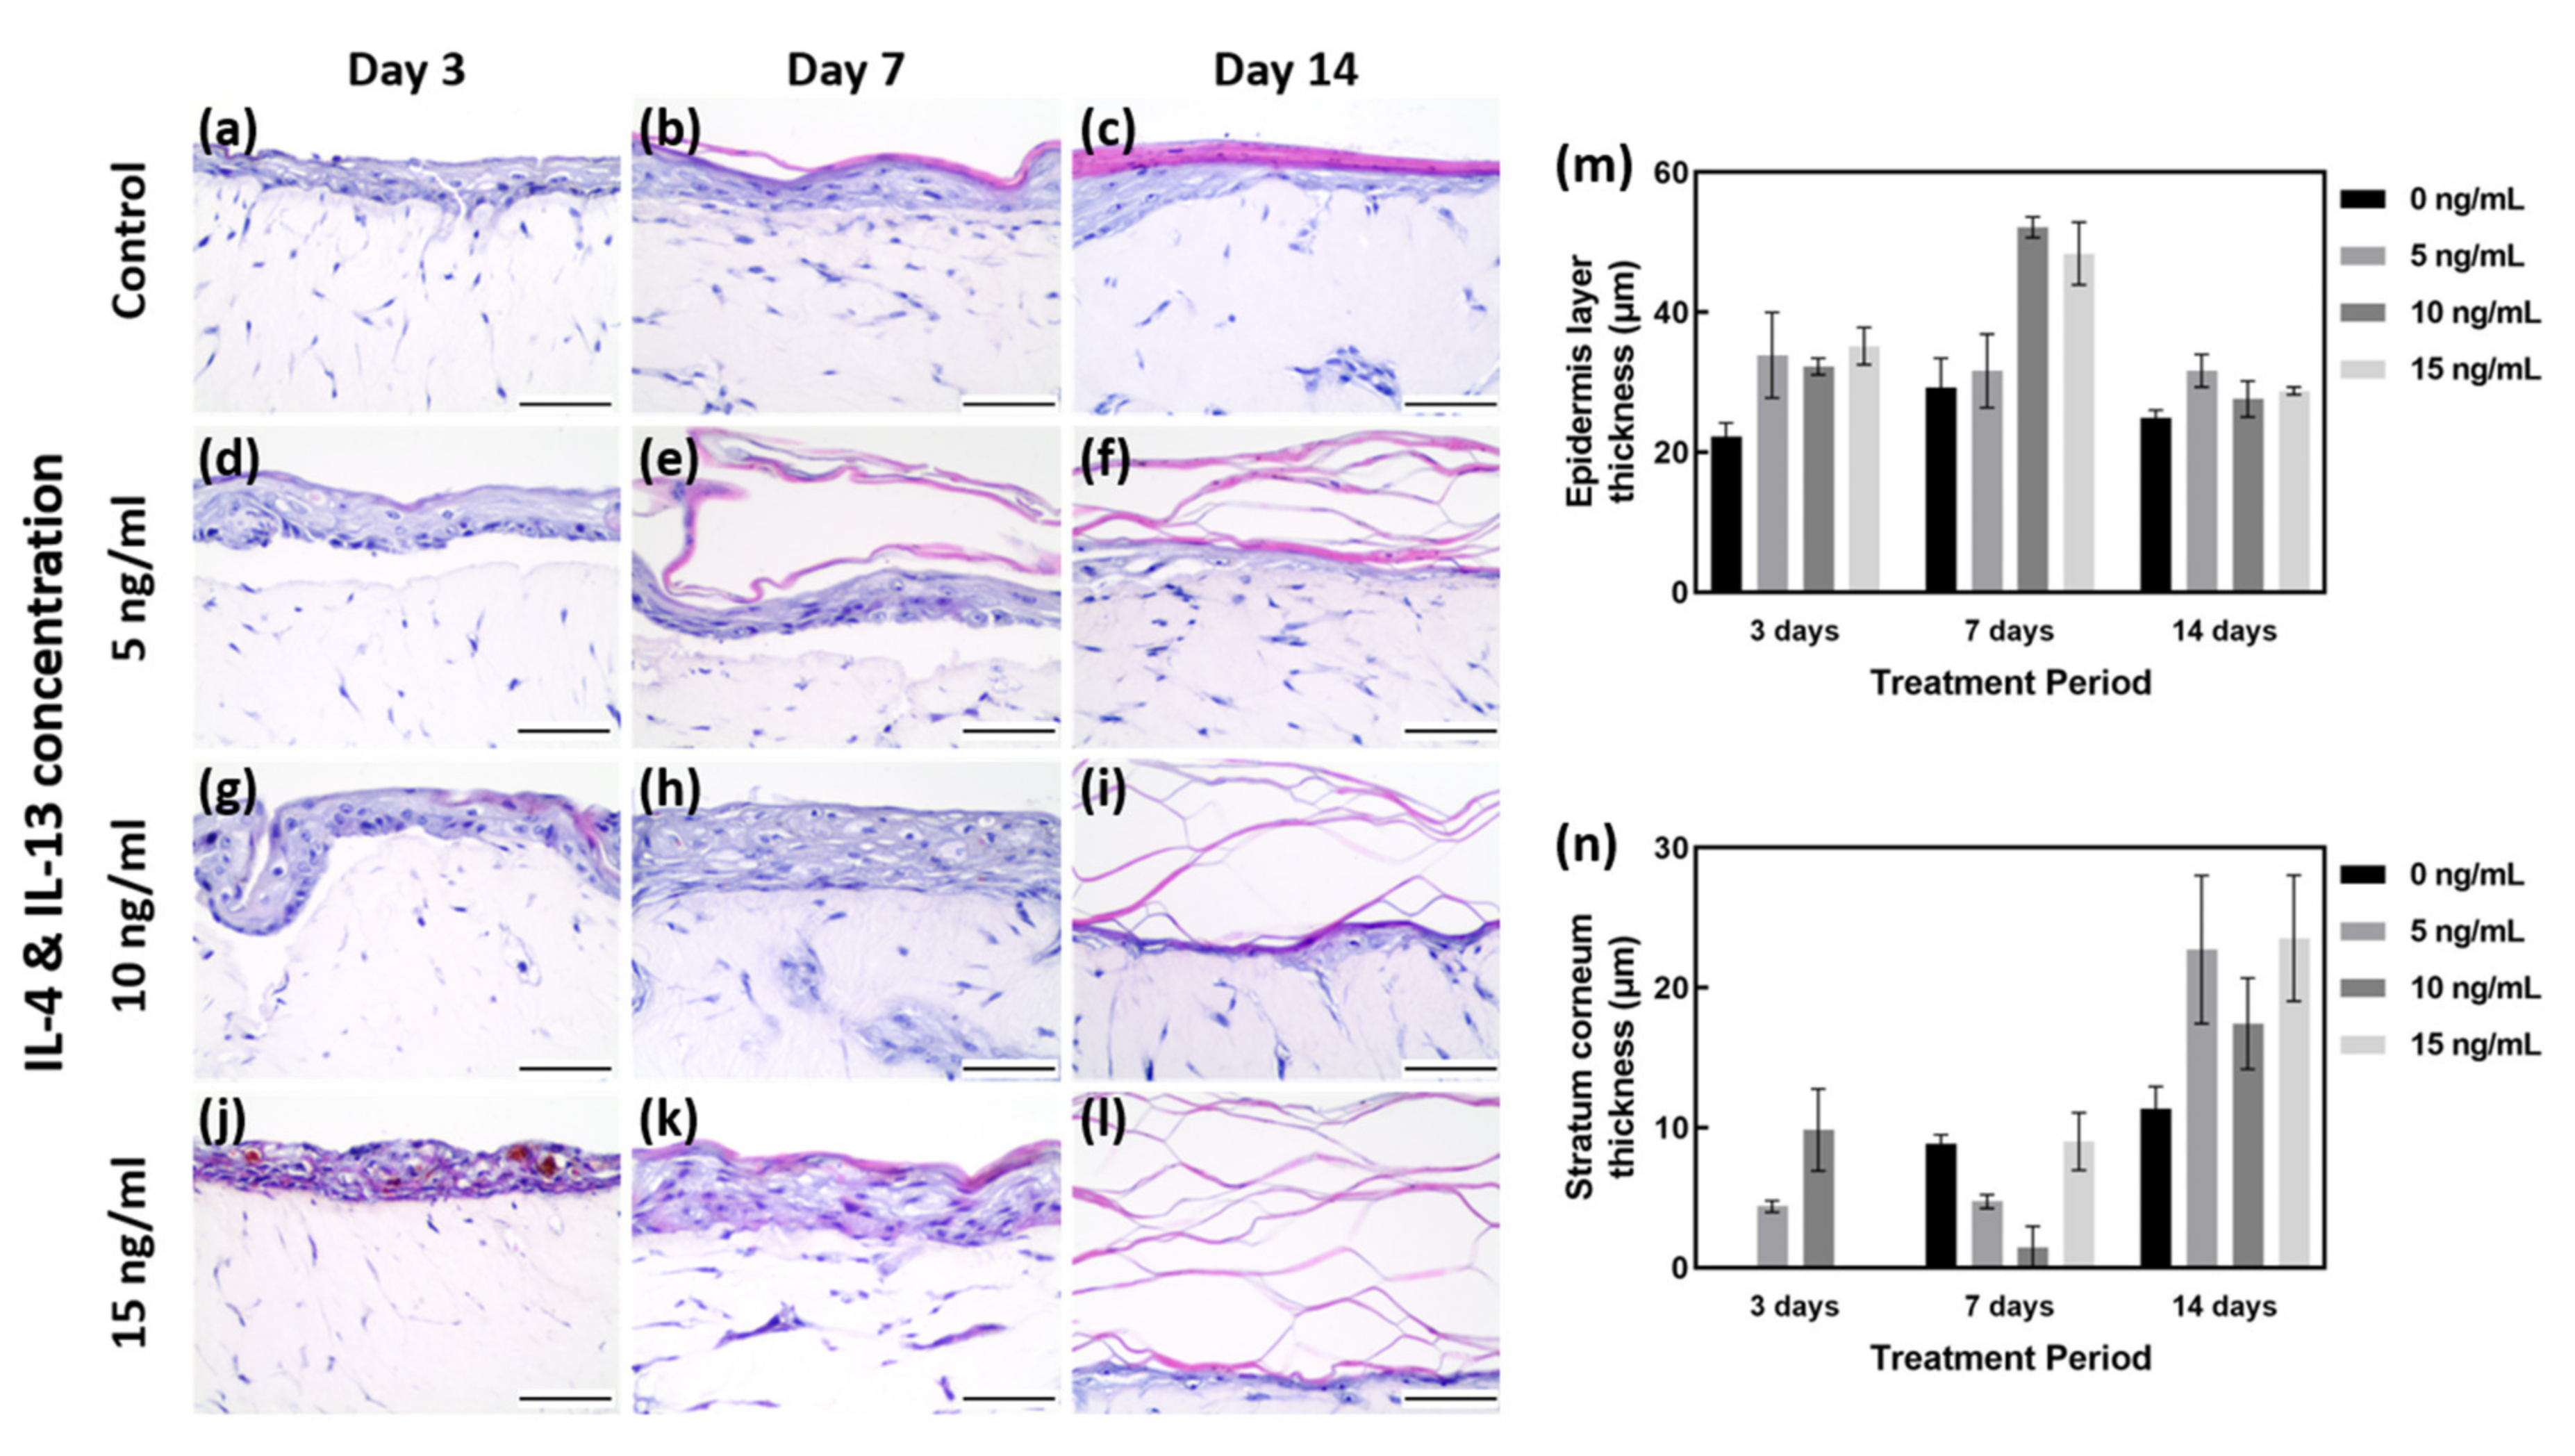
Figure 2. H&E staining of AD-HSE. (a–c) H&E staining of HSE cultured in general medium (without IL-4/IL-13 stimulation) for 3, 7 and 14 days as a baseline control. (d–f) H&E staining of AD-HSE stimulated with 5 ng/mL IL-4/IL-13 for 3, 7 and 14 days. (g–i) H&E staining of AD-HSE stimulated with 10 ng/mL IL-4/IL-13 for 3, 7 and 14 days. (j–l) H&E results of AD-HSE stimulated with 15 ng/mL IL-4/IL-13 for 3, 7 and 14 days. Scale bar is 50 μm. (m) Graph quantified by measuring the thickness of all epidermis layers, including stratum corneum. (n) Graph quantified by measuring only the thickness of stratum corneum.
As shown in Figure 2m,n, the EDL thickness on days 3, 7 and 14 under the 0 ng/mL IL-4/IL-13 (control) condition was 22.20 to 29.22 μm. The SC layer was shown to gradually increase with the culture period (0 to 11.34 μm). Among the controls cultured for 7 days, the total thickness of EDL was measured to be 29.22 μm on average, and the SC layer was measured to be 8.83 μm on average. Although the EDL except for the SC was maintained at a level similar to that of 3 days of culture, it can be considered as the most well formed tissue because the SC layer was formed properly. With 7 days of culture at 0 ng/mL IL-4/IL-13, the SC was well formed (Figure 2a–c). With 3 days of treatment, there was insufficient time for differentiation, and the plurality of layers constituting the epidermal layer (EDL) was not clearly formed; in particular, the SC layer was not clearly differentiated (Figure 2a). With H&E staining, the HSE control cultured for 7 days showed the most distinctive differentiation and thickness of various layers of EDL (Figure 2b,m,n).
Samples treated with 15 ng/mL IL-4/IL-13 for 3 days showed poorly differentiated EDL, along with severe intercellular spongiosis and a tremendous amount of intercellular spaces. Due to the poorly differentiated EDL, SC was not formed and only the thickness of the unstable EDL increased (Figure 2j,m,n). The higher the concentration of IL-4/IL-13 treatment for 7 days, the thicker the EDL formed (Figure 2e,h,k). Compared with the control group, IL-4/IL-13 treatment yielded very thick EDL, even hyperkeratosis. More intercellular space was formed by AD-HSE stimulated for 7 days than for 3 days (Figure 2d,g,j). The thickness after 7 days was measured to be approximately 29.22 μm at 0 ng/mL, 31.62 μm at 5 ng/mL, 52.14 μm at 10 ng/mL and 48.40 μm at 15 ng/mL. Compared to the control group, a significant increase in EDL thickness was observed in the experimental groups treated with 10 and 15 ng/mL. Proper differentiation of each layer of EDL did not occur; however, there was acanthosis in which the stratum spinosum layer formed was abnormally thick (Figure 2e,h,k,m). Figure 2c shows the control cultured for 14 days, in which SC formation is evident, and the remaining layers form a thinned EDL. Figure 2f,i,l shows the increase in the thickness of all layers, including SC, when treated with IL-4/IL-13. The SC layer is also scattered without being firmly connected. In the 15 ng/mL group, SC could not adhere and showed a scattered morphology (Figure 2l). The degree of skin lesions depended on the duration of stimulation, with the maximum effect achieved with 7 days of stimulation (Figure 2k).
3. Downregulation of Barrier Function-Related Proteins in AD-HSE Stimulated with IL-4 and IL-13
Immunohistochemistry (IHC) staining was performed to investigate the expression of barrier function-related proteins (Figure 3). LOR is expressed in the SG of the epidermis. As shown in Figure 3d, there was no obvious change in LOR expression by treatment with IL-4/IL-13 for 3 days, but the test group treated for 7 and 14 days showed less LOR staining than the control group. On 7 days, IL-4/IL-13-treated AD-HSE showed LOR expression 0.75 to 0.49 times that of the control group, and a significant decrease in LOR expression was observed in AD-HSE treated with 15 ng/mL IL-4/IL-13 (p < 0.01). On day 14, the IL-4/IL-13 treatment group showed LOR expression 0.85 to 0.54 times that of the control group. There was significant inhibition of expression at 5 ng/mL (p < 0.05) and 10 ng/mL (p < 0.01).
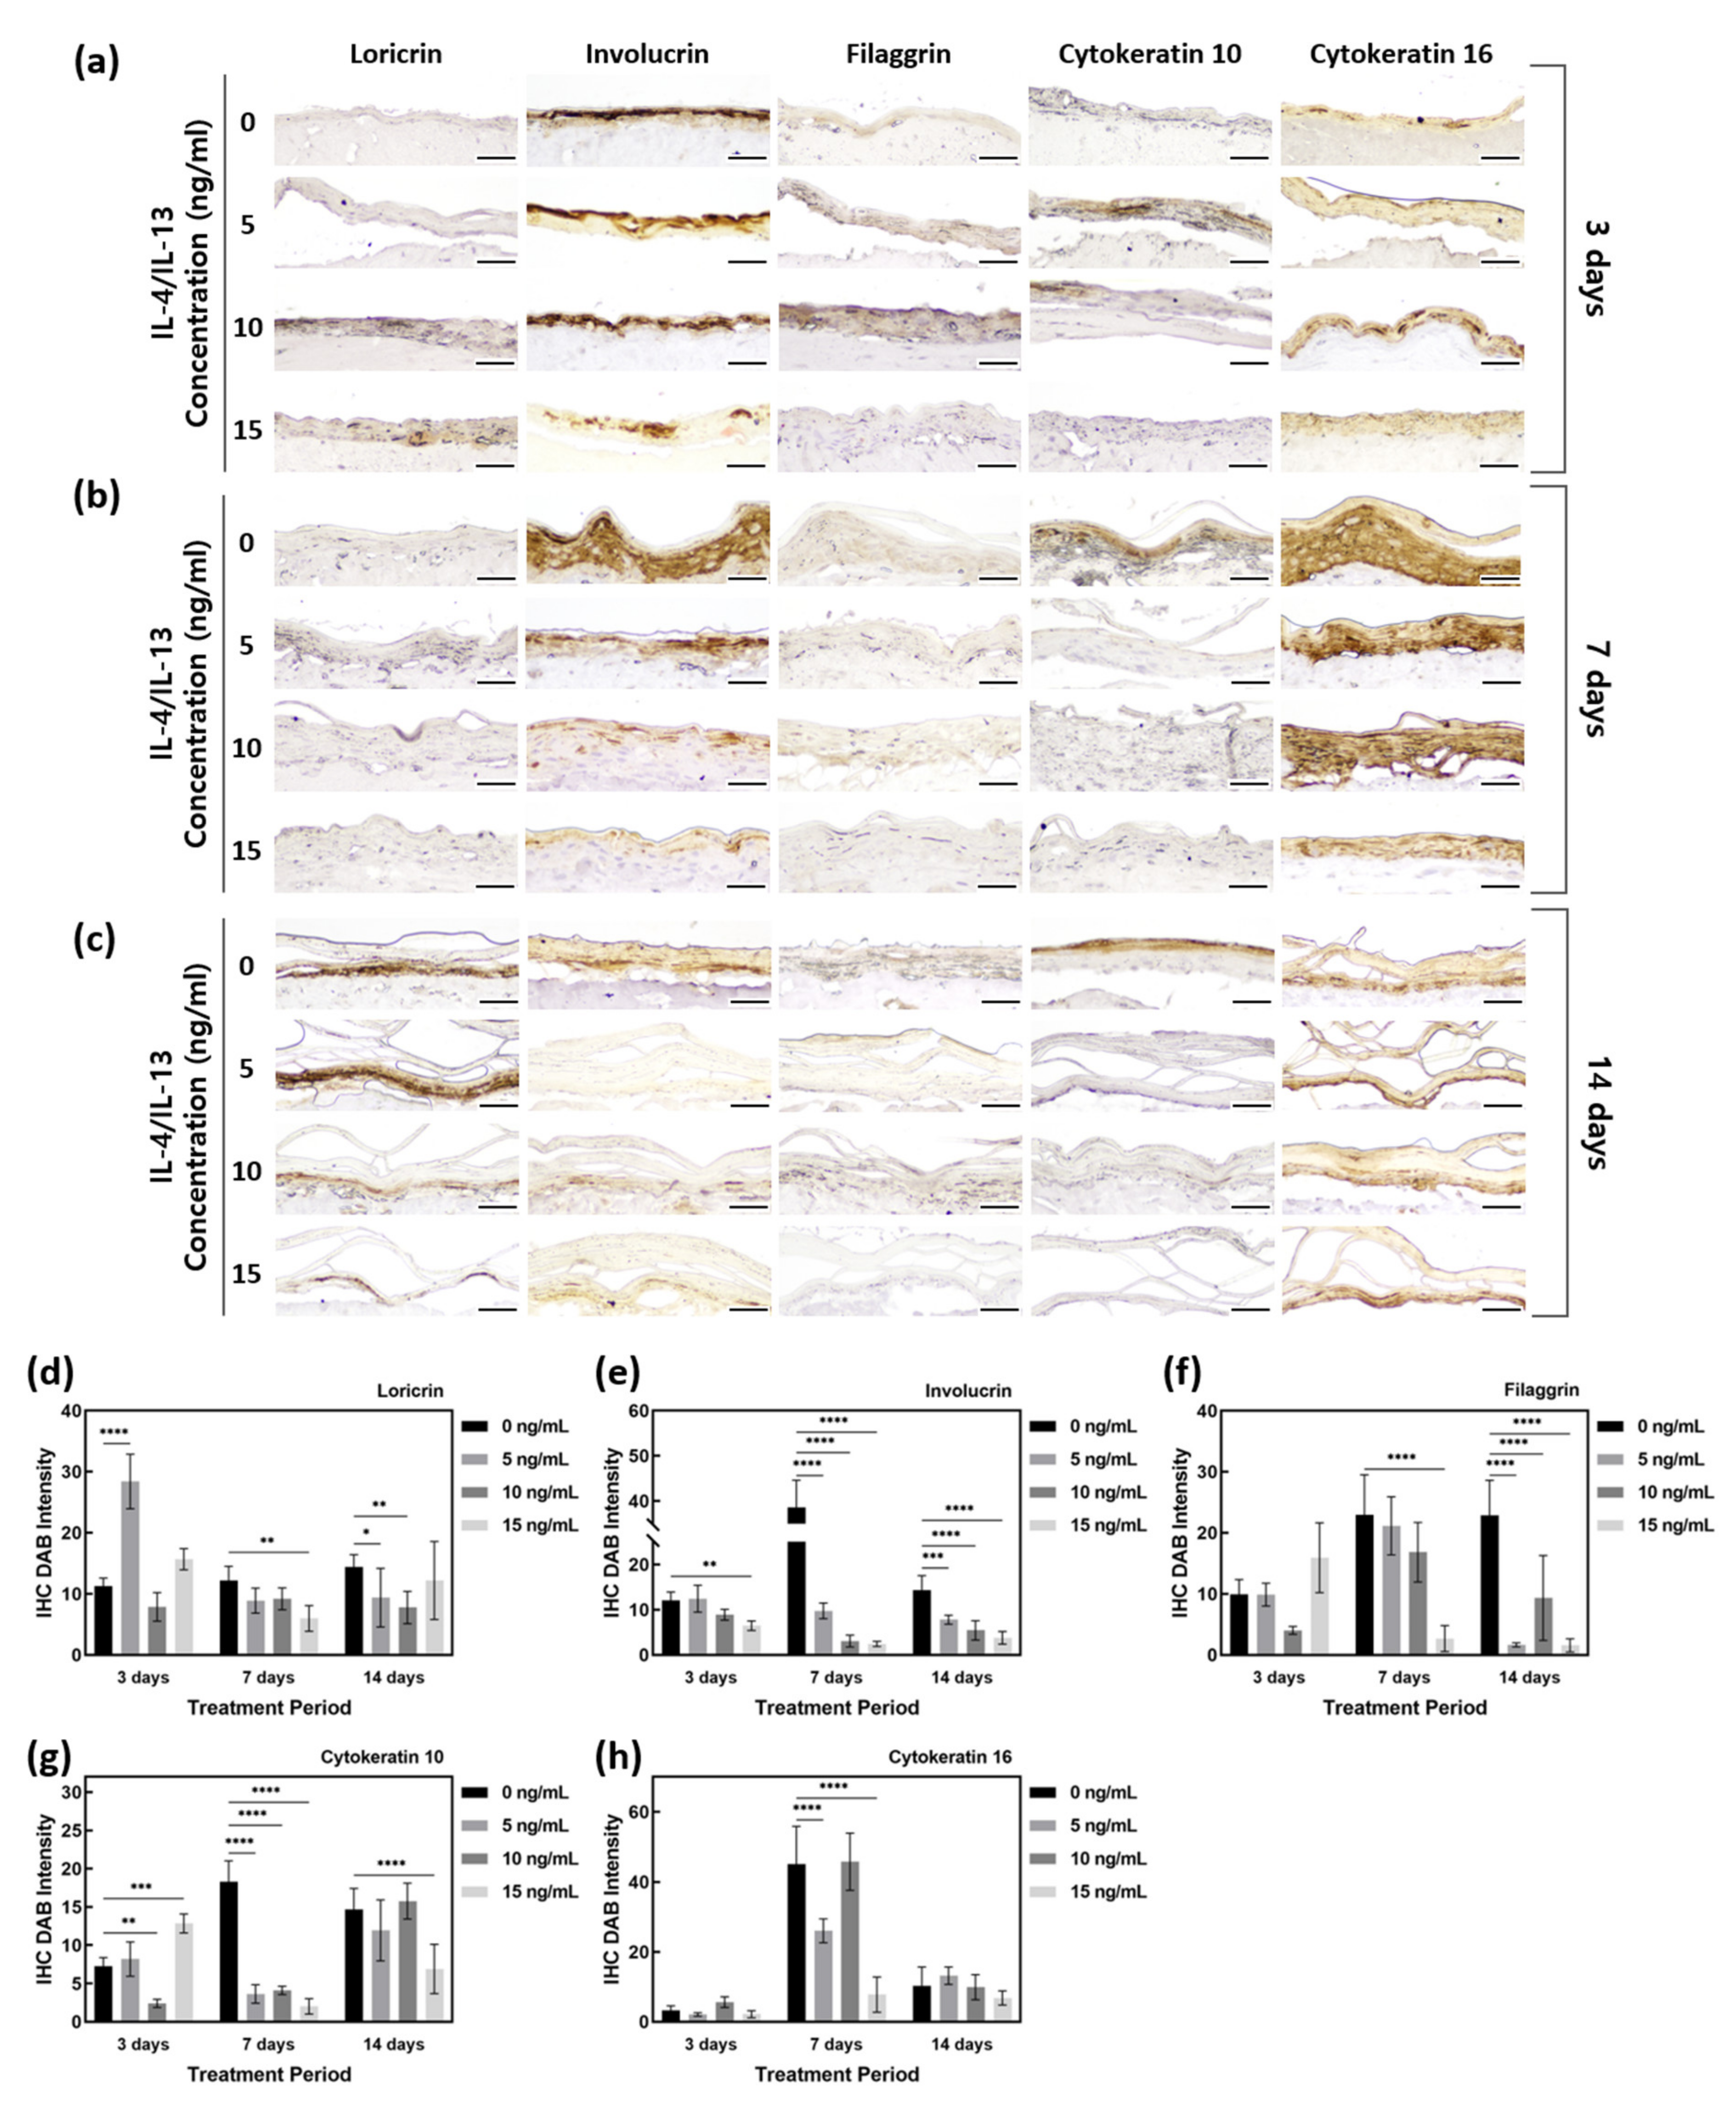
Figure 3. Quantification of IHC staining of AD-HSE stimulated with IL-4/IL-13. (a) IHC-stained images of epidermis-forming proteins of AD-HSE stimulated with IL-4/IL-13 for 3 days. (b) IHC-stained images of epidermis-forming proteins of AD-HSE stimulated with IL-4/IL-13 for 7 days. (c) IHC-stained images of epidermis-forming proteins of AD-HSE stimulated with IL-4/IL-13 for 14 days. (The scale bar sizes of a, b and c are 50 μm.) (d–h) Epidermis-forming proteins loricrin, involucrin, filaggrin, cytokeratin 10 and cytokeratin 16 (n = 5; *, p < 0.05; **, p < 0.01; ***, p < 0.001; ****, p < 0.0001).
IVL, expressed in the SS layer, showed a decrease in AD-HSE induced by IL-4/IL-13. The expression of IVL was 1 to 0.54 times that of the control group for AD-HSE on 3 days, 0.25 to 0.06 times that of the control group for AD-HSE on 7 days and 0.54 to 0.85 times that of the control group for AD-HSE on 14 days. The higher the IL-4/IL-13 concentration for 7 and 14 days, the greater the decrease in protein expression (Figure 3e). There was a significant decrease in the 15 ng/mL IL-4/IL-13 treatment group for 3 days (p < 0.01) and 7 days (p < 0.0001). There was also a significant decrease in 14 days treatment group (p < 0.001, 0.0001).
FLG is expressed in the SG and at the interface between the SG and SC. In the control group, FLG showed increased protein expression with longer epidermal differentiation. However, IL-4/IL-13-induced AD-HSE showed reduced FLG expression. In AD-HSE induced for 7 days, the expression was 0.92–0.12 times that of the control group, and there was a significant decrease (p < 0.0001) in the 15 ng/mL. AD-HSE induced for 14 days showed a significant expression (p < 0.0001) of 0.41–0.07 times that of the control group. In particular, there was a large decrease in its expression with 15 ng/mL IL-4/IL-13 (Figure 3f).
To confirm that skin damage and psoriasis were induced in their AD-HSE, researchers examined KRT10 and KRT16 expression. The expression of KRT10 protein increased as the period of induction of epidermal differentiation in the control group increased. There was a significant decrease (p < 0.001) of 0.05 times compared to the control group in 10 ng/mL AD-HSE induced for 3 days. AD-HSE induced for 7 days showed a significantly reduced (p < 0.0001) expression (expression of 0.11–0.22 times that of the control group). The expression of KRT10 was decreased in AD-HSE induced by IL-14 and IL-13, and the greatest decrease in expression was observed in AD-HSE induced for 7 days (Figure 3g). KRT16 protein, in contrast, did not show a significant difference in expression between the control and IL-14- and IL-13-induced AD-HSE (Figure 3h).
4. Alteration of Epidermal Morphologies in AD-HSE Stimulated with IL-4 and IL-13
IL-4 and IL-13 stimulation weakens the epidermal barrier and changes the epidermal morphology. Researchers thus analyzed the epidermal morphology of AD-HSE by SEM. Figure 4 shows the 500 magnification result of the SEM. The cross-sectional view of AD-HSE confirmed the proper formation of the stratum corneum. The SC stratum of cytokine-treated AD-HSE was in an unstable form. When compared with control, unevenness and rough morphology of the epidermal topography were commonly observed in AD-HSE treated with IL-4/IL-13.
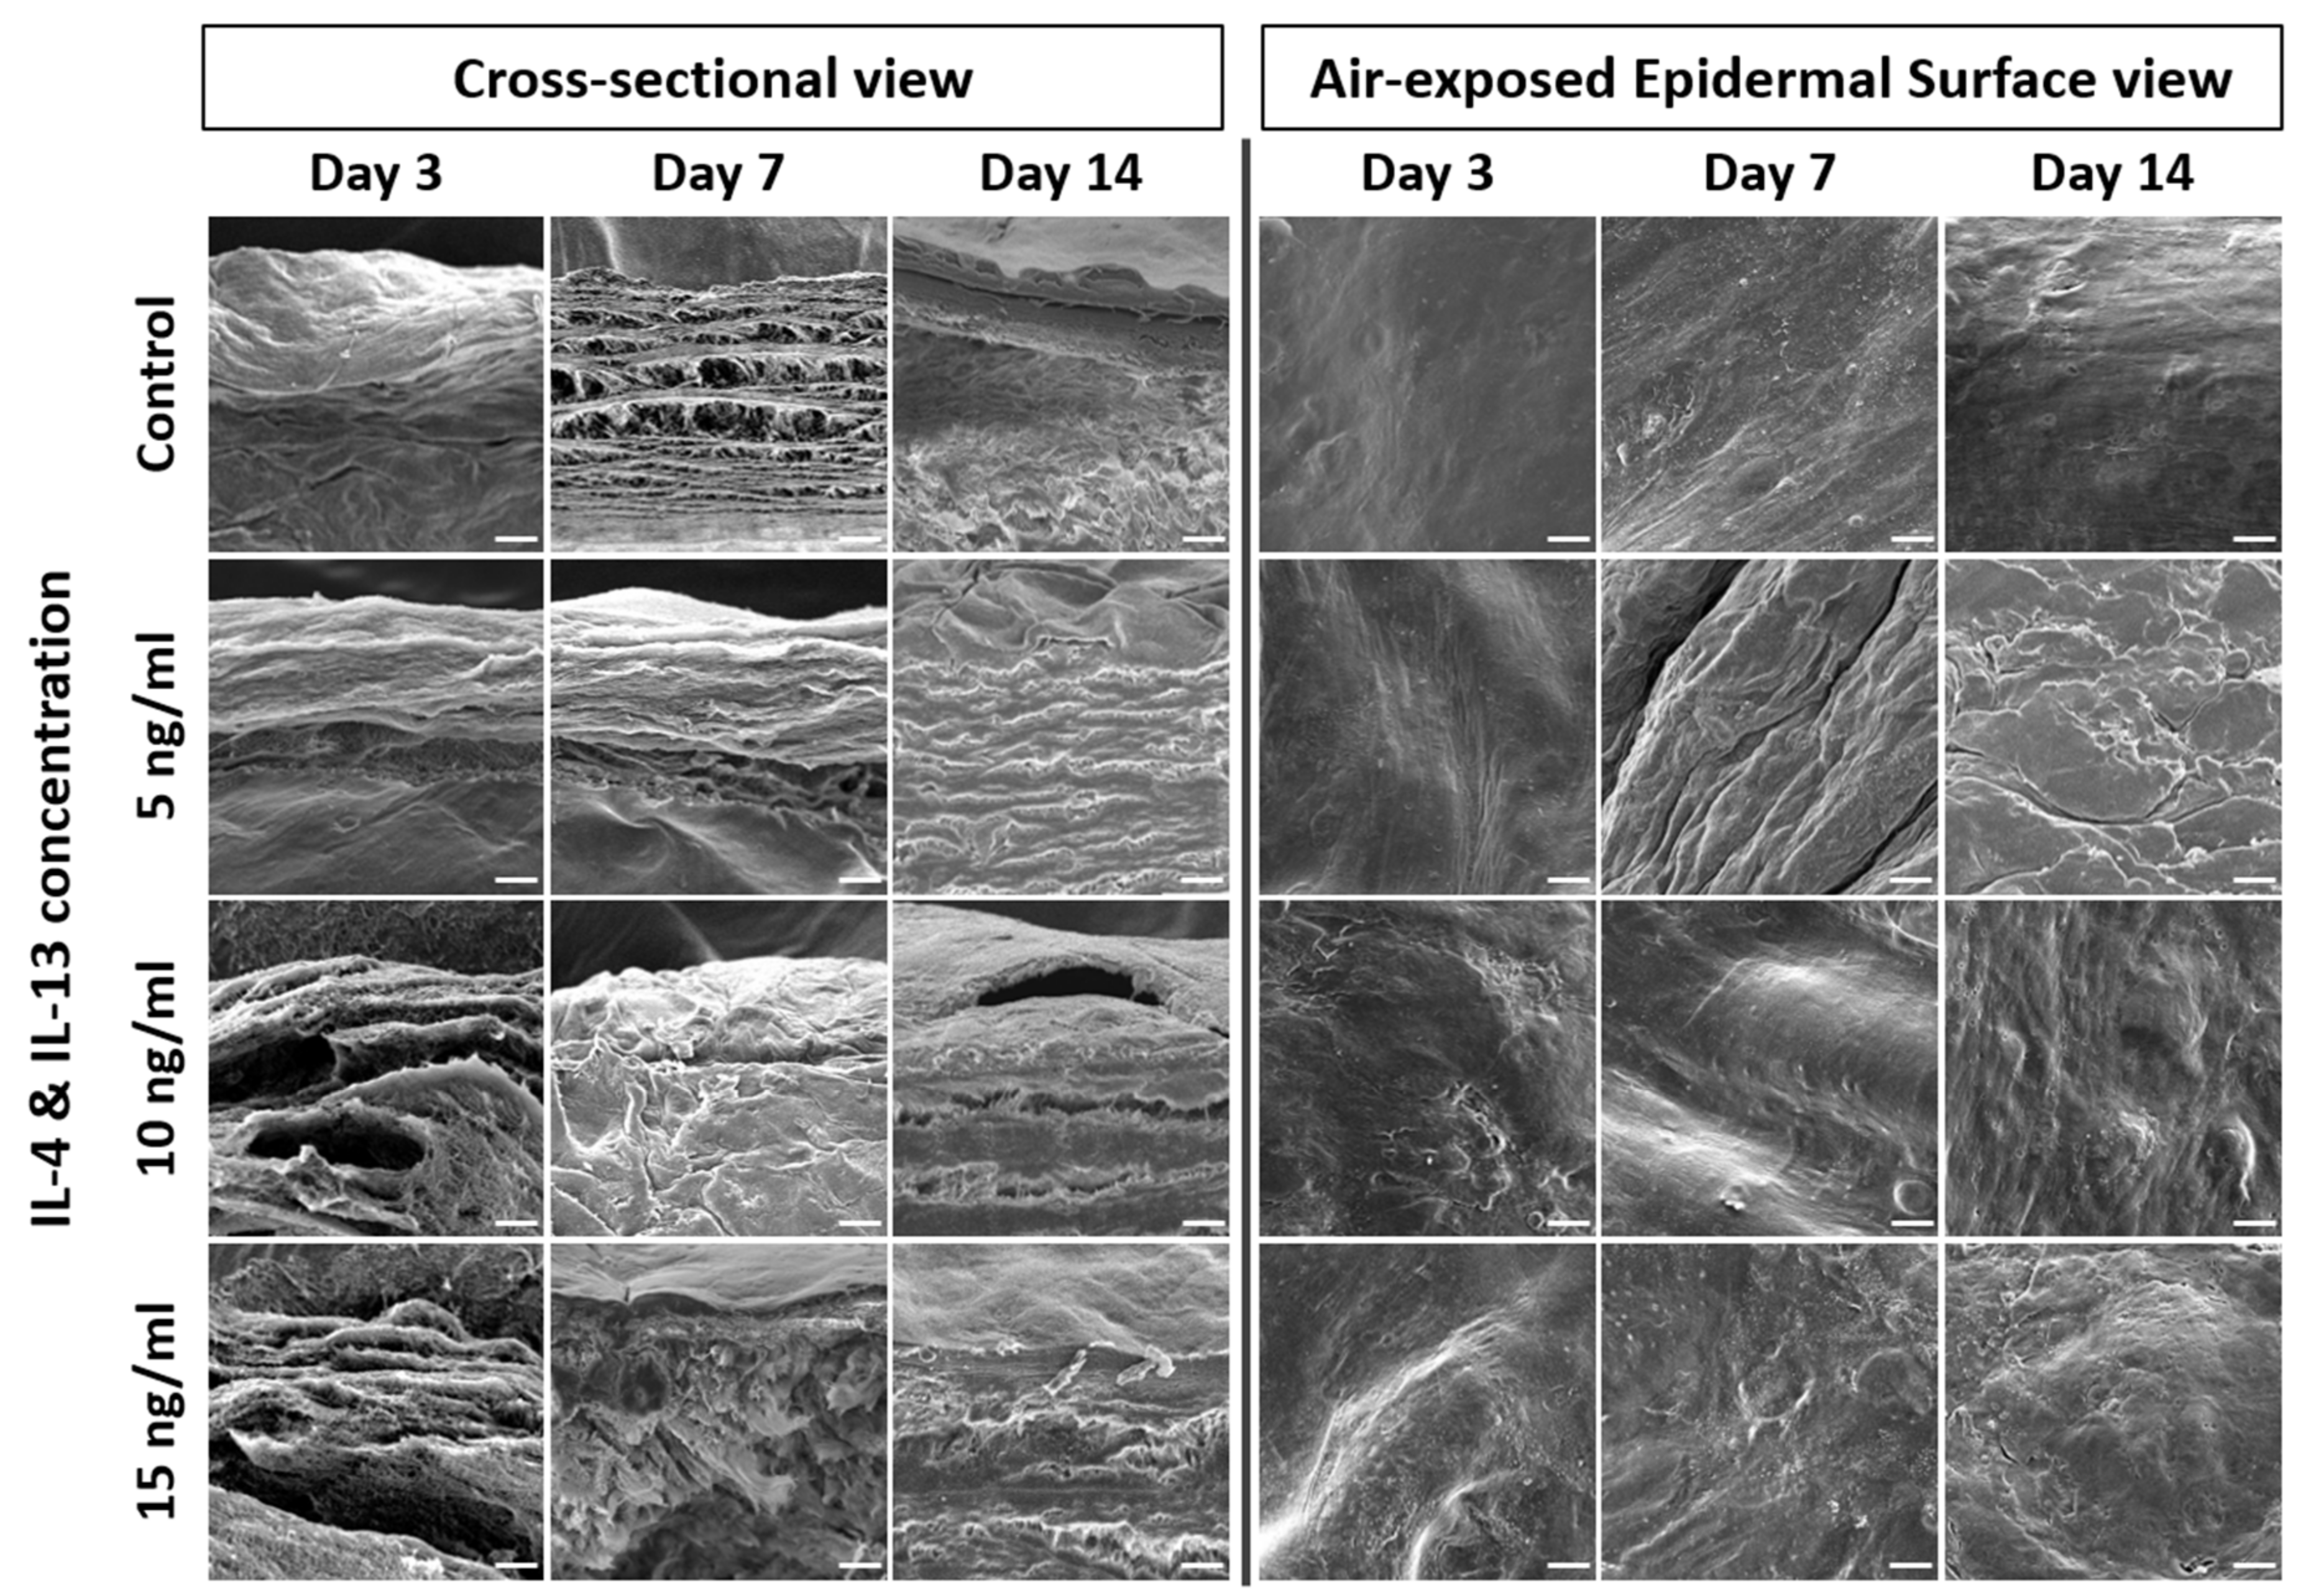
Figure 4. SEM of AD-HSE. SEM of cross-sectional and air-exposed epidermal surface views of AD-HSE stimulated with IL-4/IL-13 for 3, 7 and 14 days. Scale bar is 20 μm.
5. AD-Related Gene Expression in AD-HSE Stimulated with IL-4 and IL-13
Treatment of AD-HSE with IL-4 and IL-13 was shown to reduce FLG and IVL gene expression in all experimental groups except those stimulated at 10 ng/mL for 14 days. In particular, the expression of FLG (p < 0.05) and IVL genes (p < 0.01) was most significantly suppressed in AD-HSE stimulated with IL-4/IL-13 at 15 ng/mL (Figure 5a,c). The expression of FLG decreased in AD-HSE stimulated for 3 days was 0.28-fold (5 ng/mL), 0.26-fold (10 ng/mL) and 0.14-fold (15 ng/mL) of the control group. In the AD-HSE stimulated for 7 days the expression of FLG was significantly decreased 0.10-fold of the control group (p < 0.01) (Figure 5a). Expression of LOR decreased when stimulated with IL-4/IL-13 for 3 days, but increased when stimulated with 10 ng/mL for 7 and 14 days (Figure 5b). In AD-HSE stimulated for 7 days, the expression of IVL decreased was 0.48-fold (5 ng/mL), 0.56-fold (10 ng/mL) and 0.12-fold (15 ng/mL) of the control group. Significance was shown at p < 0.01, 0.05 and 0.0001, respectively (Figure 5c). At 15 ng/mL, the expression of FLG, IVL and LOR genes was significantly reduced. This is consistent with previously reported in vitro results for IL-4 and IL-13 [22][23][24][25]. As shown in Figure 5d, researchers found that IL-4 and IL-13 strongly increased CAII gene expression. In AD-HSE stimulated for 3 days, the expression of CAII was 2.92-fold (5 ng/mL), 13.69-fold (10 ng/mL) and 17.30-fold (15 ng/mL) that of the control group. There was a significant difference (p < 0.001, 0.0001) from the control at 10 and 15 ng/mL. In AD-HSE stimulated for 7 days, the expression of CAII was 9.68-fold (10 ng/mL) and 11.77-fold (15 ng/mL) that of the control group. There was a significant difference (p < 0.0001) from the control at 10 and 15 ng/mL on 7 days (Figure 5d).
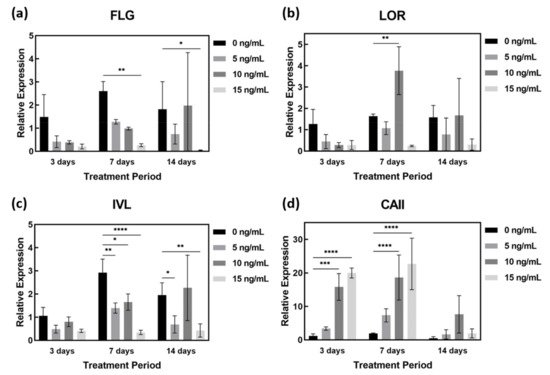
Figure 5. qPCR of IL-4- and IL-13-stimulated AD-HSE. AD-HSE treated with IL-4/IL-13 by concentration and period and controls: (a) FLG, (b) LOR, (c) IVL, (d) CAII (n = 3; *, p < 0.05; **, p < 0.01; ***, p < 0.001; ****, p < 0.0001).
6. Secreted Cytokines in AD-HSE Stimulated with IL-4 and IL-13
Figure 6a shows the ELISA results of AD-HSE stimulated with 15 ng/mL of IL-4/IL-13 for 3, 7 and 14 days. The expression levels of IL-4/IL-13 were highest in AD-HSE stimulated for 14 days and lowest in AD-HSE stimulated for 7 days. Treatment was performed at the same concentration, but different numerical values were expressed depending on the treatment period. Cytokine expression was observed to change most when AD-HSE was cultured for 14 days. Several concentrations of IL-4/IL-13 were used for 14 days to assess the response of other cytokines (Figure 6b). HSE not treated with the IL-4/IL-13 had the lowest expression of most cytokines. GCSF and stem cell factor (SCF) were the least expressed at 5 ng/mL IL-4/IL-13, and plasminogen activator inhibitor-1 (PAI-1) was the lowest at 10 ng/mL IL-4/IL-13. Figure 6c displays a comparison of the experimental groups in Figure 6a,b with a heat map. TNF-α, IFN-γ, GM-CSF, IL-1α, IL-8, interferon-inducible protein 10 (IP-10), RANTES, vascular endothelial growth factor (VEGF), epidermal growth factor (EGF), resistin, IL-12, IL-13, platelet-derived growth factor BB (PDGF-BB), placental growth factor-1 (PIGF-1), beta-nerve growth factor (β-NGF), monocyte chemoattractant protein-1 (MCP-1), macrophage inflammatory protein-1α (MIP-1α), IL-4, IL-10, basic fibroblast growth factor gene (FGFb), leptin, insulin-like growth factor I (IGF-1), transforming growth factor-β (TGF-β), Adipo, IL-17A and IL-1β were upregulated in IL-4/IL-13-induced AD-HSE. In the case of IL-2 and IL-6, the ELISA results exceeded the linear range of the kit, so researchers were unable to accurately compare the expression of these two cytokines.
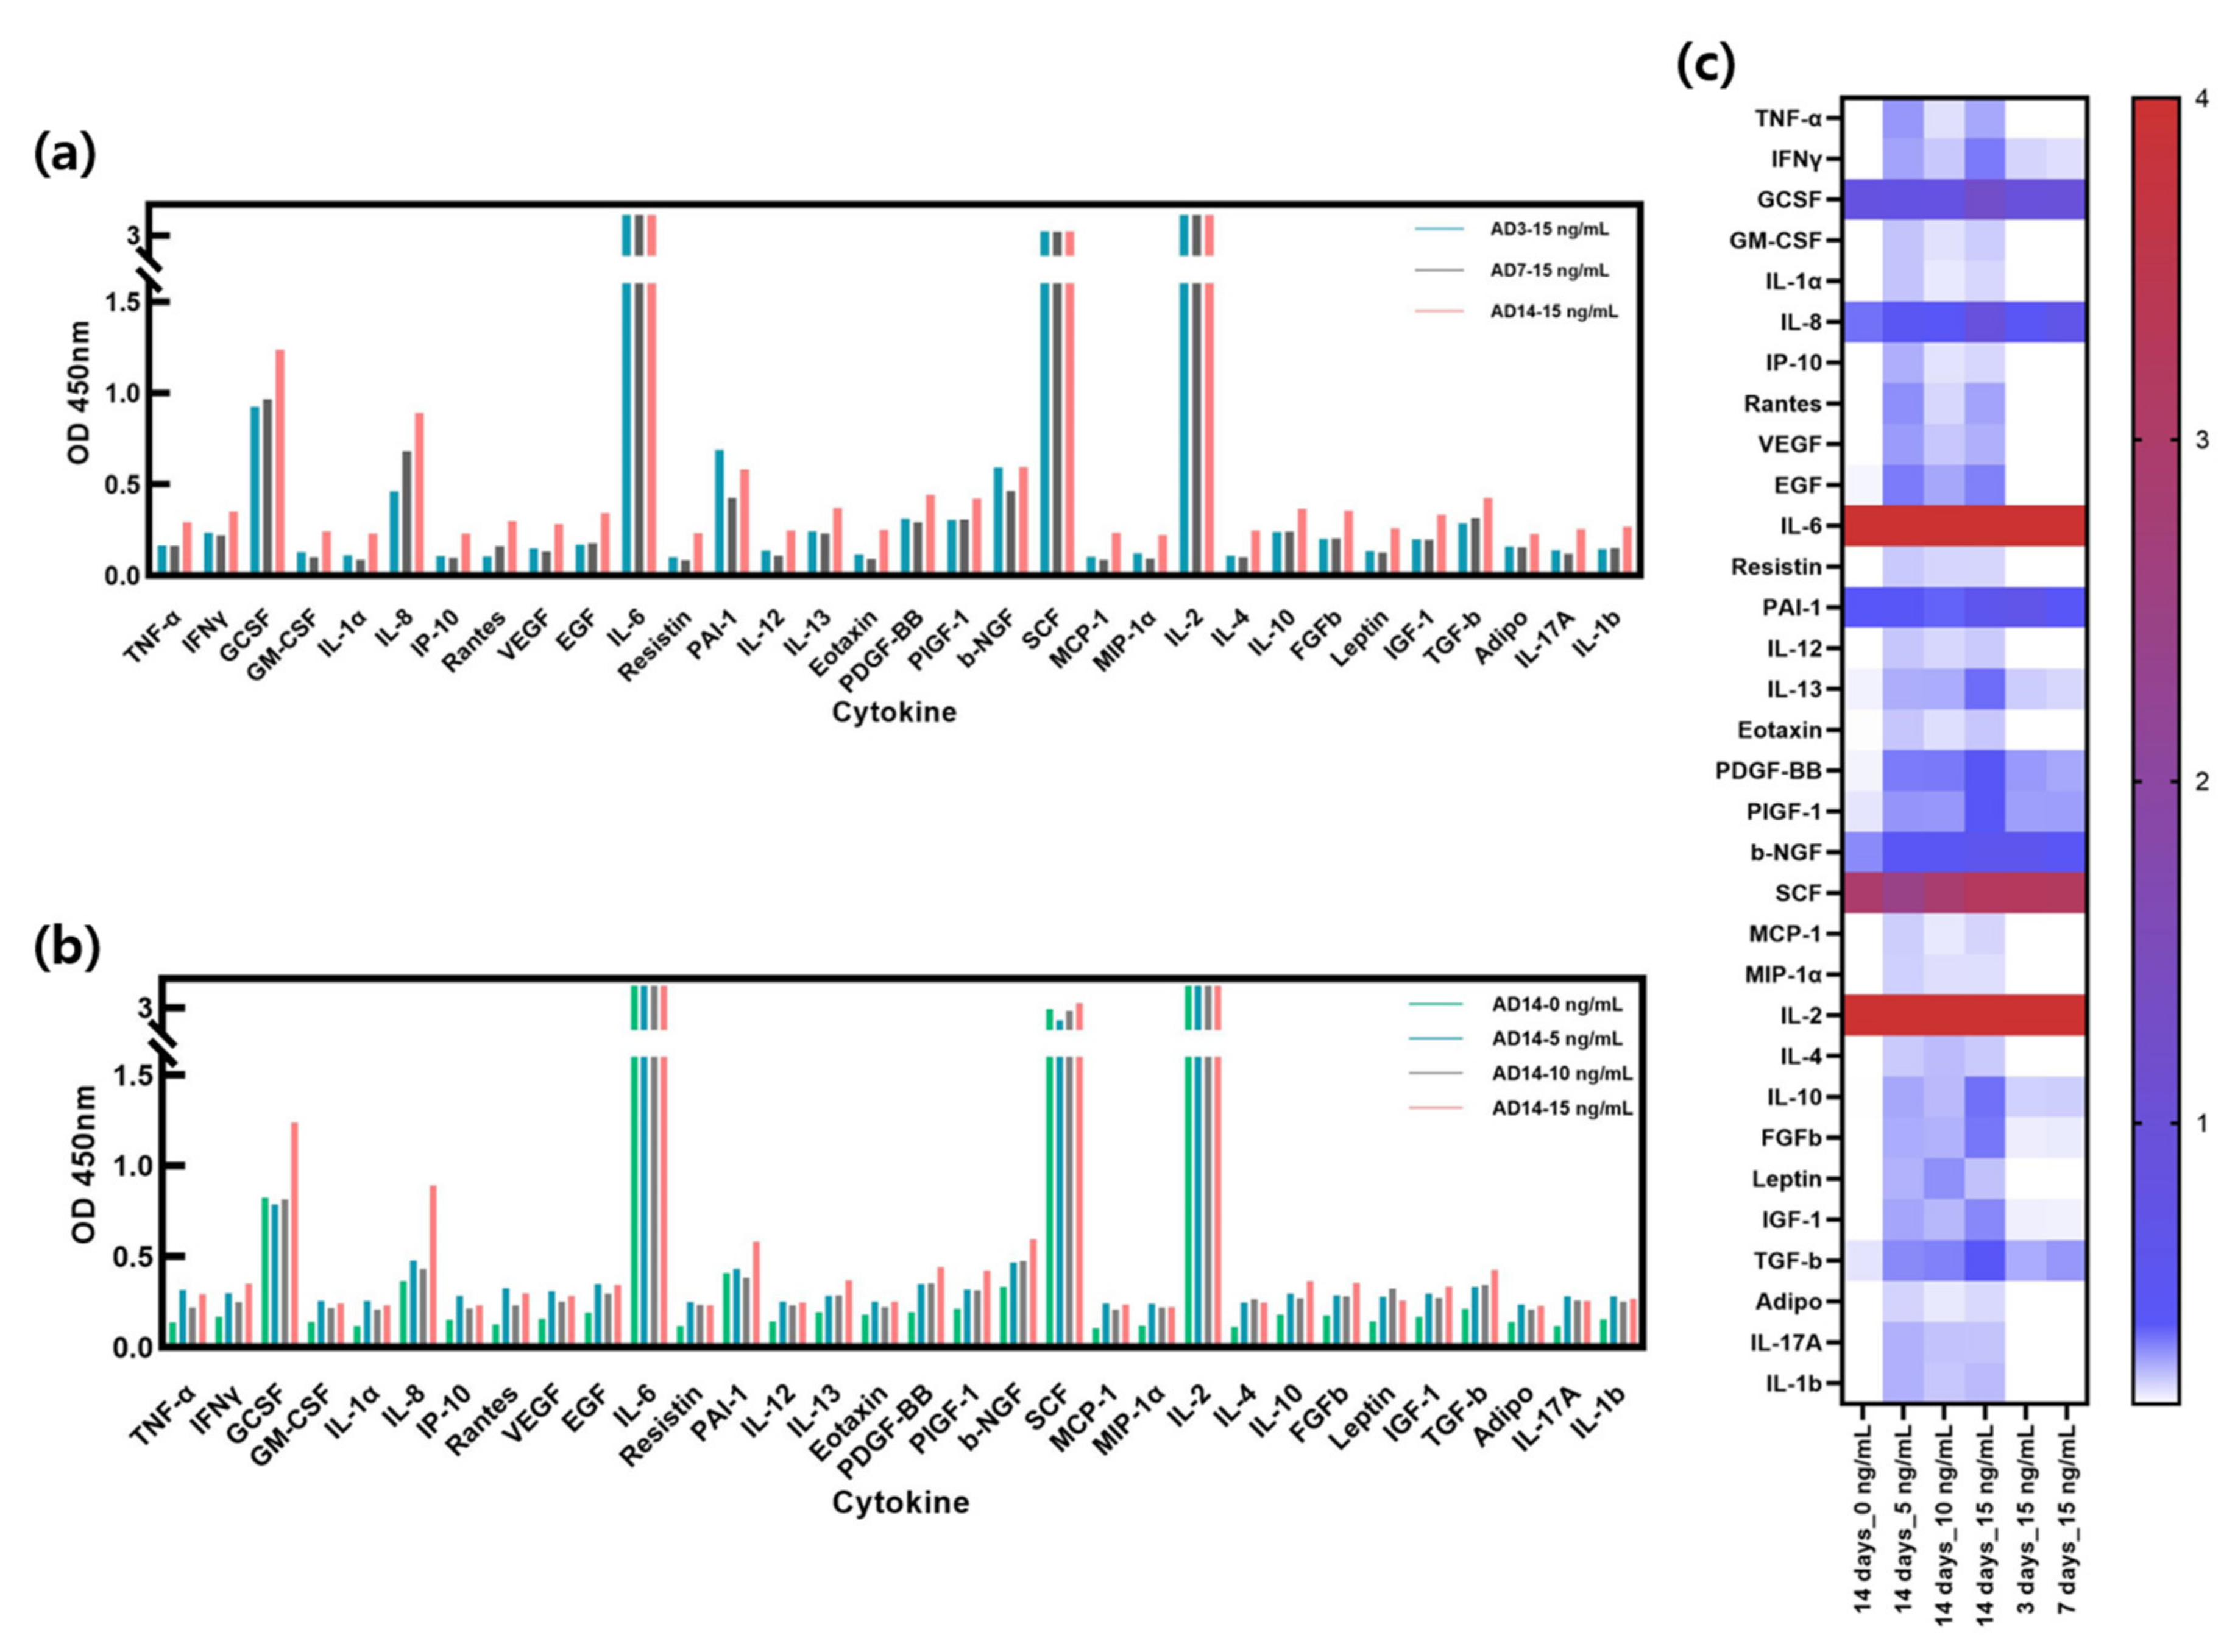
Figure 6. Cytokine expression in AD-HSE. (a) ELISA results with human cytokine plate array of AD-HSE stimulated with 15 ng/mL IL-4/IL-13 for 3, 7 and 14 days each. Most cytokines were highly expressed when AD-HSE was stimulated for 14 days. (b) ELISA results of AD-HSE stimulated with 0, 5, 10 and 15 ng/mL IL-4/IL-13 for 14 days, showing differential expression of cytokines depending on IL-4/IL-3 concentration. (c) The results of ELISAs shown by a heat map.
References
- De Vuyst, E.; Salmon, M.; Evrard, C.; Lambert de Rouvroit, C.; Poumay, Y. Atopic dermatitis studies through in vitro models. Front. Med. 2017, 4, 119.
- Guttman-Yassky, E.; Suárez-Fariñas, M.; Chiricozzi, A.; Nograles, K.E.; Shemer, A.; Fuentes-Duculan, J.; Cardinale, I.; Lin, P.; Bergman, R.; Bowcock, A.M. Broad defects in epidermal cornification in atopic dermatitis identified through genomic analysis. J. Allergy Clin. Immunol. 2009, 124, 1235–1244.e58.
- Totsuka, A.; Omori-Miyake, M.; Kawashima, M.; Yagi, J.; Tsunemi, Y. Expression of keratin 1, keratin 10, desmoglein 1 and desmocollin 1 in the epidermis: Possible downregulation by interleukin-4 and interleukin-13 in atopic dermatitis. Eur. J. Dermatol. 2017, 27, 247–253.
- Jensen, J.-M.; Fölster-Holst, R.; Baranowsky, A.; Schunck, M.; Winoto-Morbach, S.; Neumann, C.; Schütze, S.; Proksch, E. Impaired sphingomyelinase activity and epidermal differentiation in atopic dermatitis. J. Investig. Dermatol. 2004, 122, 1423–1431.
- Cork, M.J.; Danby, S.G.; Vasilopoulos, Y.; Hadgraft, J.; Lane, M.E.; Moustafa, M.; Guy, R.H.; MacGowan, A.L.; Tazi-Ahnini, R.; Ward, S.J. Epidermal barrier dysfunction in atopic dermatitis. J. Investig. Dermatol. 2009, 129, 1892–1908.
- Boguniewicz, M.; Leung, D.Y. Atopic dermatitis: A disease of altered skin barrier and immune dysregulation. Immunol. Rev. 2011, 242, 233–246.
- Hänel, K.H.; Cornelissen, C.; Lüscher, B.; Baron, J.M. Cytokines and the skin barrier. Int. J. Mol. Sci. 2013, 14, 6720–6745.
- Kypriotou, M.; Huber, M.; Hohl, D. The human epidermal differentiation complex: Cornified envelope precursors, S100 proteins and the ‘fused genes’ family. Exp. Dermatol. 2012, 21, 643–649.
- Harada, N.; Higuchi, K.; Wakao, H.; Hamasaki, N.; Izuhara, K. Identification of the Critical Portions of the Human IL-4 Receptor α Chain for Activation of STAT6. Biochem. Biophys. Res. Commun. 1998, 246, 675–680.
- Ranasinghe, C.; Trivedi, S.; Wijesundara, D.K.; Jackson, R.J. IL-4 and IL-13 receptors: Roles in immunity and powerful vaccine adjuvants. Cytokine Growth Factor Rev. 2014, 25, 437–442.
- Furue, M. Regulation of filaggrin, loricrin, and involucrin by IL-4, IL-13, IL-17A, IL-22, AHR, and NRF2: Pathogenic implications in atopic dermatitis. Int. J. Mol. Sci. 2020, 21, 5382.
- Sneddon, L.U.; Halsey, L.G.; Bury, N.R. Considering aspects of the 3Rs principles within experimental animal biology. J. Exp. Biol. 2017, 220, 3007–3016.
- Rusche, B. The 3Rs and animal welfare-conflict or the way forward? ALTEX-Altern. Anim. Exp. 2003, 20 (Supp. 1), 63–76.
- Serpell, J. In the Company of Animals: A Study of Human-Animal Relationships; Cambridge University Press: Philadelphia, PA, USA, 1996.
- Maeno, S.; Niki, Y.; Matsumoto, H.; Morioka, H.; Yatabe, T.; Funayama, A.; Toyama, Y.; Taguchi, T.; Tanaka, J. The effect of calcium ion concentration on osteoblast viability, proliferation and differentiation in monolayer and 3D culture. Biomaterials 2005, 26, 4847–4855.
- Lovitt, C.J.; Shelper, T.B.; Avery, V.M. Advanced cell culture techniques for cancer drug discovery. Biology 2014, 3, 345–367.
- Huet, F.; Severino-Freire, M.; Chéret, J.; Gouin, O.; Praneuf, J.; Pierre, O.; Misery, L.; Le Gall-Ianotto, C. Reconstructed human epidermis for in vitro studies on atopic dermatitis: A review. J. Dermatol. Sci. 2018, 89, 213–218.
- Ataç, B.; Wagner, I.; Horland, R.; Lauster, R.; Marx, U.; Tonevitsky, A.G.; Azar, R.P.; Lindner, G. Skin and hair on-a-chip: In vitro skin models versus ex vivo tissue maintenance with dynamic perfusion. Lab Chip 2013, 13, 3555–3561.
- Mori, N.; Morimoto, Y.; Takeuchi, S. Skin integrated with perfusable vascular channels on a chip. Biomaterials 2017, 116, 48–56.
- Song, H.J.; Lim, H.Y.; Chun, W.; Choi, K.C.; Sung, J.H.; Sung, G.Y. Fabrication of a pumpless, microfluidic skin chip from different collagen sources. J. Ind. Eng. Chem. 2017, 56, 375–381.
- Song, H.J.; Lim, H.Y.; Chun, W.; Choi, K.C.; Lee, T.-y.; Sung, J.H.; Sung, G.Y. Development of 3D skin-equivalent in a pump-less microfluidic chip. J. Ind. Eng. Chem. 2018, 60, 355–359.
- Kim, B.E.; Leung, D.Y.; Boguniewicz, M.; Howell, M.D. Loricrin and involucrin expression is down-regulated by Th2 cytokines through STAT-6. Clin. Immunol. 2008, 126, 332–337.
- Van den Bogaard, E.H.; Bergboer, J.G.; Vonk-Bergers, M.; van Vlijmen-Willems, I.M.; Hato, S.V.; van der Valk, P.G.; Schröder, J.M.; Joosten, I.; Zeeuwen, P.L.; Schalkwijk, J. Coal tar induces AHR-dependent skin barrier repair in atopic dermatitis. J. Clin. Investig. 2013, 123.
- Pellerin, L.; Henry, J.; Hsu, C.-Y.; Balica, S.; Jean-Decoster, C.; Méchin, M.-C.; Hansmann, B.; Rodriguez, E.; Weindinger, S.; Schmitt, A.-M. Defects of filaggrin-like proteins in both lesional and nonlesional atopic skin. J. Allergy Clin. Immunol. 2013, 131, 1094–1102.
- Ishida-Yamamoto, A.; Iizuka, H. Differences in involucrin immunolabeling within cornified cell envelopes in normal and psoriatic epidermis. J. Investig. Dermatol. 1995, 104, 391–395.
More
Information
Contributor
MDPI registered users' name will be linked to their SciProfiles pages. To register with us, please refer to https://encyclopedia.pub/register
:
View Times:
2.7K
Entry Collection:
Tight Junction and Its Proteins
Revisions:
2 times
(View History)
Update Date:
07 Mar 2022
Table of Contents


Notice
You are not a member of the advisory board for this topic. If you want to update advisory board member profile, please contact office@encyclopedia.pub.
OK
Confirm
Only members of the Encyclopedia advisory board for this topic are allowed to note entries. Would you like to become an advisory board member of the Encyclopedia?
Yes
No
${ textCharacter }/${ maxCharacter }
Submit
Cancel
Back
Comments
${ item }
|
${ item.createdUser.fullName }
${ item.createdAt }
${ item.vote }
${ item.reply }
Delete
${ reply.createdUser.fullName }
${ reply.createdAt }
${ reply.vote }
Delete
There is no reply to this comment~
${ item.replyTextCharacter }/${ item.replyMaxCharacter }
Submit
Cancel
More
No more~
There is no comment~
${ textCharacter }/${ maxCharacter }
Submit
Cancel
${ selectedItem.replyTextCharacter }/${ selectedItem.replyMaxCharacter }
Submit
Cancel
Confirm
Are you sure to Delete?
Yes
No