Your browser does not fully support modern features. Please upgrade for a smoother experience.
Submitted Successfully!
 +1 credit
Thank you for your contribution! You can also upload a video entry or images related to this topic.
For video creation, please contact our Academic Video Service.
| Version | Summary | Created by | Modification | Content Size | Created at | Operation |
|---|---|---|---|---|---|---|
| 1 | Lital Gildin | + 3131 word(s) | 3131 | 2022-02-18 03:53:48 | | | |
| 2 | Rita Xu | Meta information modification | 3131 | 2022-03-01 10:14:45 | | |
Video Upload Options
We provide professional Academic Video Service to translate complex research into visually appealing presentations. Would you like to try it?
Cite
If you have any further questions, please contact Encyclopedia Editorial Office.
Gildin, L. Fragile X Syndrome (FXS). Encyclopedia. Available online: https://encyclopedia.pub/entry/20041 (accessed on 24 June 2026).
Gildin L. Fragile X Syndrome (FXS). Encyclopedia. Available at: https://encyclopedia.pub/entry/20041. Accessed June 24, 2026.
Gildin, Lital. "Fragile X Syndrome (FXS)" Encyclopedia, https://encyclopedia.pub/entry/20041 (accessed June 24, 2026).
Gildin, L. (2022, March 01). Fragile X Syndrome (FXS). In Encyclopedia. https://encyclopedia.pub/entry/20041
Gildin, Lital. "Fragile X Syndrome (FXS)." Encyclopedia. Web. 01 March, 2022.
Copy Citation
Fragile X syndrome (FXS), the most common form of inherited intellectual disability, is caused by a developmentally regulated silencing of the FMR1 gene, but its effect on human neuronal network development and function is not fully understood.
Fragile X syndrome
disease modeling
human embryonic stem cells
1. Introduction
Fragile X syndrome (FXS) is the most prevalent form of inherited intellectual disability. FXS patients present a spectrum of developmental and behavioral problems including learning disabilities and cognitive impairment. The disease results from a developmentally regulated silencing of the Fragile X (FX) Mental Retardation Protein (FMRP) [1], an RNA-binding protein essential for proper synaptic architecture and plasticity [2]. Research models of FX include human neural progenitor cells taken from aborted fetuses [3][4] and FMR1 knockout (KO) animals that share some phenotypes with humans [5][6][7]. The FX phenotype is associated with several cellular defects including abnormal dendritic spine morphology, nonsense-mediated mRNA decay and altered intrinsic neuronal properties [8][9][10][11]. However, there are substantial differences between the human brain and that of the mouse model [12]; moreover, recent clinical trials in FXS patients, based on animal models, failed to ameliorate disease-related symptoms [13][14][15], highlighting the difficulty in translating findings directly from animal models to human patients.
Human pluripotent stem cells (hPSC) have emerged as a powerful tool to investigate the pathogenesis of neurological diseases, due to their ability to differentiate into neural cells in vitro. Researchers have previously differentiated several FX-human embryonic stem cell (hESC) lines into functional neurons with inactivated FMR1, demonstrating that they can serve as a good research model for exploring the molecular and functional mechanisms underlying FXS [16]. However, differentiation of FX-PSCs led to poor neuronal maturation and decreased spike frequencies relative to control neurons [16][17]. Nevertheless, other studies demonstrated inconsistent results regarding the functional differences between FX-PSCs and control neurons [18][19][20]. In the current study, hESC isogenic subclones were generated, one with a full FX mutation and one that is free of the mutation (WT) but shares the same genetic background, enabling us to overcome variability between lines. These isogenic subclones were directly converted into induced neurons (iNs) with mature intrinsic and synaptic properties, by ectopic expression of the neuronal transcription factors neurogenin-1 (NEUROG-1). This technology allows for more efficient, rapid and reproducible production of neurons that form synapses [21][22] enabling us to model the neuronal network functions of diseased cells in an in vitro system. The high-throughput Multi-Electrode Array (MEA) allows us to show that, apart from the FX neuronal networks being hyperexcitable, they also have higher spontaneous burst-firing activity.
2. Generation of Isogenic FXS Full-Mutation hESC Subclones
In previous studies, several FXS-hESC lines representing variability in FX populations were compared to several control lines to explore the role of FMR1 in FX [23][24]. Other studies use CRISPR/Cas9 for removal of the CGG repeats or the hypermethylation of the CGG expansion mutation [19][25], but such genetic intervention is commonly associated with off-target effects. To overcome this limitation, in the current study, isogenic subclones were isolated, freed from any genetic intervention, from the Lis_FX6 hESC line that was previously derived in our lab, following PGD and present CGG repeats from the normal-through the full-mutation range. Sixty-one single-cell colonies were manually isolated and screened for their CGG repeat number in the 5’-untranslated region of FMR1 (Figure 1A) and by the AmplideX PCR/CE FMR1 Reagents (Asuragen, TX, USA) commonly used for clinical diagnosis of FXS (Figure 1B). Our results show that researchers successfully isolated an FXS subclone that is in the full mutation range (>200 CGG repeats; clone 8A), a subclone that is in the pre-mutation range (50–200 CGG repeats; clone 7L) and another subclone that is free of the mutation (<50 CGG repeats; clone 7B) that will serve in all further experiments as an isogenic control (WT; Figure 1C). These subclones were analyzed for CGG repeat length three times during the study period and the results demonstrate their stability over extended cell divisions. Importantly, all lines and subclones were shown to be pluripotent with a normal karyotype (see Scheme 1) and maintained their repeats number along the differentiation process. Induced differentiation into neurons by overexpression of NEUROG-1 already generated neurons with typical morphology within 7 days (Figure 1E). These iNs already completely inactivated the FMR1 gene, only in the FX full-mutation subclone, at 7 days following neuronal induction, at both the RNA and protein level (Figure 1E,F), mimicking FMR1 silencing in FXS developing fetuses. Researchers then characterized the expression profile of the FX-iNs and their isogenic counterparts. Our results show that by day 39, both FX- and control-iNs completely inactivated the pluripotent gene OCT4, and positively expressed the neural genes PAX6, Tuj1 and MAP2. They also expressed BRN2 and FOXG1, which characterize excitatory cortical neurons. The pre- and post-synaptic genes SYN1 and PSD-95 were also expressed in both FX and WT iNs at day 39, demonstrating their maturity. Expression analysis of the glutamate receptors showed that two of four subunits of the AMPA receptor (GRIA1, GRIA3) were found to be expressed in both FX and WT iNs at the same level. Interestingly, GRIA4 expression was significantly higher in FXS neurons compared to WT (p < 0.05). Both FX and WT iNs also express the ionotropic glutamate receptors kainate 1 (GRIK1), the NMDA receptor subunit 1 (GRIN1), the metabotropic glutamate receptor 5 (mGluR5), and the vesicular glutamate transporter-2 (vGlut2). The GABA receptor subunit α-2 (GABRA2) was also expressed in these neurons, although with lower expression levels compared with glutamatergic genes (Figure 1D). Collectively, the expression of this series of neuronal markers shows that FX and WT iNs are excitatory glutamatergic neurons.

Figure 1. Generation of Fragile X (FX) human embryonic stem cell (hESC) isogenic clones: (A) Analysis of the FX-hESC isogenic clones’ CGG repeat size by PCR-based repeat-number assay of hESC. H9 (WiCell, University of Wisconsin) served as control; (B) AmplideX PCR/CE FMR1 Reagents (Asuragen) commonly used for clinical diagnosis of FXS; (C) FX mutation status of isogenic iN clones; (D) neuronal characterization of iNs. Expression of neuronal genes in FX- and control-iNs. Quantitative RT-PCR analysis was performed on RNA extracted at 39 days in vitro (DIV). The housekeeping gene GUSB served as an internal control. Three independent experiments were performed, and data are represented as mean ± SEM. T-test: * p < 0.05 (E) FMRP expression in FX and isogenic control hESC 7 & 32 DIV. β-III tubulin (Tuj1; green) and FMRP (red). Scale bar: 200 µm; (F) RNA expression of FMR1 analyzed by qRT-PCR at 39 DIV (left). Data are represented as mean ± SEM. Three independent experiments were performed. T-test: *** p < 0.001. FMRP expression using western blot analysis (right). Protein was extracted at either day 7 or at 32 DIV. Human FMRP antibody is shown, and actin served as a positive control.


Scheme 1. Characterization of hESC subclones generated from Lis_FX6: (A) Polymorphic marker analyses of CA repeats (marker), known to identify each unique hESC line, are listed. Lis_FX6 original hESC line; #—subclone derived from the original hESC line; (B) expression of the OCT4/ SSEA4/ TRA-160 pluripotent genes (green) in the two isogenic clones. Nuclear staining: DAPI (blue). Scale bar: 100 µm; (C) karyotype by SKY analysis of clone 7B at passage 48 and clone 8A at passage 46.
3. The Effect of FMRP Expression on Neuronal Function and Network Development
The formation and maintenance of synaptic networks are necessary for neuronal functions through continuous changes in the neurons’ fine structure. They therefore analyzed the morphology of the FXS-iNs at four time points following neuronal induction (7, 12, 23 and 32 DIV). The results show that while iNs mature in vitro, the neurites elongate gradually from day 7 to 32 (Figure 2). Temporarily increased neurite growth was detected in FX-iNs at day 12 DIV (p < 0.0005), compared with WT, but their length was not different from WT later during development, indicating that their delayed elongation catches up later (Figure 2B). In addition, neurite branching also increased as the iNs matured, in both FX and WT neurons. However, at day 32 of differentiation, the FX-iNs had significantly fewer branch points than the WT (15.5 and 17.5 branch points/cell body cluster, respectively; p < 0.005), probably reflecting their retarded maturity (Figure 2C). In addition, the soma perimeter of both FX and WT iNs increased during development, with FX-iNs presenting a significantly smaller soma at all four time points (Figure 2D). Collectively these results indicate that the lack of FMRP alters the maturation of neurons, resulting in a smaller neuronal soma and less-branched neurites.

Figure 2. High-throughput image analysis of Fragile X (FX) induced neurons (iNs): (A) Representative images of WT and FX-iNs following Incucyte live-cell analysis, at four time points following neuronal induction (7, 12, 23, 32 DIV). Soma and neurites are presented in different colors. Scale bar: 200 µm; (B) total neurite length in mm/cell body cluster; (C) neurite branch points/cell body cluster. Two–three independent experiments were performed including 2500–4000 neurons at each time point. Data are represented as mean ± SEM. One-way ANOVA: ** p < 0.005, *** p < 0.0005; (D) representative images of iNs’ soma perimeter labeled with Tuj1 (green), at 32 DIV. Scale bar: 50 µm (left). Quantification of soma perimeter (µm) was analyzed by the cellSens Dimension software (right). Two (23 & 32 DIV) or three (7 & 12 DIV) independent experiments were performed on each day for both neurite length and neurite branch points including 2000–4000 neurons at each time point. Data are represented as mean ± SEM. One-way ANOVA: * p < 0.01, **** p < 0.0001.
Next, researchers explored the functional correlates of these morphological features at the single-cell level. Basic functional properties of iNs were analyzed using the patch-clamp technique at >40 DIV. As indicated in Figure 3, the basic properties of FX-iNs were not different from WT; both can discharge repetitive action potentials (APs) each followed by a large afterhyperpolarization (AHP; Figure 3A). In addition, the resting membrane potential and the APs’ amplitude were not different between FX and WT neurons. AHPs are slightly, but not significantly, larger in the FX-iNs compared to WT neurons. Interestingly, the firing threshold of WT neurons was significantly lower than that of the FX-iNs (−27 mV compared to −24 mV, p < 0.01; Figure 3A). FX-iNs, similar to WT, responded to both glutamate and GABA applied by pressure from an adjacent micropipette (Figure 3B). More importantly, FX neuronal networks were able to generate slightly more spontaneous excitatory postsynaptic currents (EPSC) than WT neurons (see Figure 3C). The mean amplitude of the spontaneous synaptic currents was significantly larger in the FX-iNs (−36.4 ± 6.16 pA in controls compared to −61.2 ± 10.63 pA, p < 0.02), which can indicate a higher number of synapses in the FX neurons. The frequency of EPSC was slightly, but not significantly, higher in the FX neurons compared to the controls. The averaged decay time of individual EPSC was similar in both WT and FX (Figure 3C). These results indicate that even though the somatic perimeter is larger in the control than in the FX (Figure 2D), the synaptic currents, likely to reside on dendrites, are not different between the two groups. Tentatively, there was no apparent difference in capacitance between neurons in the two groups (not shown). Consequently, the APs’ initiation difference (Figure 3A) probably compensates for the higher excitability associated with an increase in synaptic activity in the FX neurons.

Figure 3. Patch-clamp recordings of Fragile X (FX)-compared to control-induced neurons (iNs): (A) Top: Intrinsic properties of action potentials (APs) of FX-iNs compared to WT. Sample illustration of an IV curve, depicting changes in membrane voltage in response to hyperpolarizing and depolarizing current pulses. The right is an expanded AP taken from the battery on the left. Bottom: summary of recorded neuron properties: resting membrane potential (MP); firing threshold (** p < 0.01); AP amplitude; after-hyperpolarization (AHP). WT: n = 30, and FX-iNs: n = 20; (B) iNs Glutamate and GABA responses. Responses to pressure application of glutamate onto FX-iNs at resting membrane potential (−60 mV) in voltage-clamp (left). Bottom: comparison of FX vs. WT-iNs’ response to glutamate at >40 DIV (WT, n = 15; FX-iNs, n = 10). Right: responses to GABA at resting potential (−60 mV) and at a depolarizing potential (−30 mV). Bottom: Comparison of FX vs. WT-iNs’ response to GABA at >40 DIV (WT, n = 7; FX-iNs, n = 8); (C) top: Spontaneous excitatory synaptic currents in FX-iNs compared to WT. Sample illustration of a trace recorded from FX neurons shown at low (left) and high (right) resolutions. Bottom: Comparison of the mean amplitude (size in pA) of synaptic current produced by FX- and control-iNs; p < 0.02. Frequency of spontaneous EPSC in FX- and control-neurons. The decay time of individual EPSCs. Comparisons were made between voltage-clamped (n = 33) WT neurons and FX-iNs (n = 21), held at −60 mV.
MEA is a complementary approach to patch-clamp and is a gold standard for characterizing the extracellular potential of neurons and assessing the neuronal network activity in vitro. Researchers used high-throughput MEAs which were recorded in 24-well-plates (12 electrodes/well) to compare the neural network activity of FX and WT neurons plated at the same density (105 neurons/well) and conditions (Figure 4A; for details, see in Methods: MEA recordings and data analysis). Blockage of APs by Tetrodotoxin (TTX; 0.5 µM) indicates that APs in both FXS and WT neurons results from the activation of Na+ currents (Figure 4B). Neurons were recorded at eight different time points during differentiation (16–44 DIV), and spontaneous APs were detected using a voltage-threshold-based algorithm (Figure 4C). Approximately 60% of electrodes were active in both lines, indicating sustained network activity in both FX and WT neurons. The increase in the number of active electrodes with age in culture may represent neuronal maturation within the duration of the experiment, reaching an optimal activity of >65% of all electrodes on >30 DIV. Electrode recording from FX neurons showed a nearly two-fold higher activity (73%) compared to WT (42%) (>23 DIV; p < 0.0001), and the results were confirmed with the high number of recorded neurons (Figure 4C).
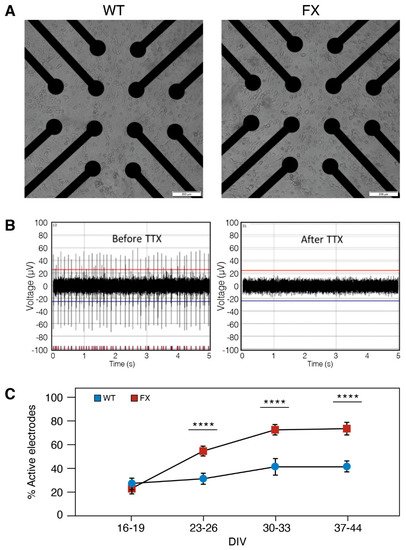
Figure 4. Spontaneous activity of induced neurons (iNs) recorded with MEA: (A) High-throughput MEA for recording spontaneous activity (24-well plate; 12 electrodes/well) with representative images of WT and FX iNs. Note the similar distribution of iNs at 10 days post induction captured from the center of a single MEA well. Scale bar: 100 µm. (B) representative traces of WT-iNs at 51 DIV (left) with spikes totally suppressed by the application of the Na+ channel blocker Tetrodotoxin (TTX; 0.5 µM; right). The red (top) and blue (bottom) lines are the thresholds (4.5 times the standard deviation of the noise); (C) percentage of active electrodes at four time points post-neuronal-induction (16–19, 23–26, 30–33, 37–44 DIV). The same batch of neurons was recorded for all time points. n = 22–36 wells were sampled for each line at each time point. Data are represented as mean ± SEM. One-way ANOVA: **** p < 0.0001.
For further analysis, they included only electrodes that discharged ≥15 spikes/minute. Collectively, the FX-iNs were hyperexcitable compared to the control as seen by the significantly higher number of spikes per active electrode in FX neurons (at 30–44 DIV; Figure 5A,B). Inter-spike interval (ISI) analysis demonstrated no differences in ISI between the two lines (Figure 5C,D), probably due to the variable spike frequencies in different neurons constructing both FX and WT neuronal networks.

Figure 5. Neuronal hyperexcitability in FX-iNs: (A) Number of spikes per active electrode. Active electrodes were defined by presenting ≥15 spikes/minute; (B) representative raster plot of spikes from more than 20 electrodes at 37 DIV FX and WT-iNs, showing the pattern and density of spikes during 60 s recording. In all graphs, the voltage-threshold-based algorithm runs over 20000 Hz high-pass-filtered traces, and is adjusted to 4.5 times the standard deviation of the noise; (C) inter-spike interval (ISI). Average ISI below 0.5 s and (D) above 0.5 s. Three independent experiments were performed. The same batch of neurons was recorded for all time points. n = 20–48 wells were sampled for each line at each time point. Data are represented as mean ± SEM. One-way ANOVA: * p < 0.05, ** p < 0.01.
Since neurons in the network tended to fire in bursts, researchers analyzed and compared the burst-firing activity between the FXS and WT neurons (Figure 6). The average rate of burst discharges was significantly higher in FXS-iNs compared to WT (64 vs. 36 bursts/ 3 min, respectively, at 37–44 DIV, p < 0.0001; Figure 6A,B). These results are correlated with the inter-burst interval (IBI) being decreased in mature FXS neurons (>37 DIV). Interestingly, at an earlier stage of differentiation (16–19 DIV), the results were the opposite, with an increased IBI observed in FX neurons compared to WT, probably reflecting their delayed development and maturation (Figure 6C). In accordance with the above, the averaged number of spikes in a burst was also significantly higher in the FXS-iNs compared to WT (>30 DIV; p < 0.0001; Figure 6D). The duration of bursts, however, was not different between FX and controls (Figure 6E). These results indicate that FX neuronal networks display a less mature electrical activity pattern compared to WT.

Figure 6. Higher spontaneous burst activity in FX neurons: (A) representatives burst traces of WT (blue) and FX (red) at 37 DIV during 10 s recording (top) and higher resolution of the first 2 s from each trace (bottom); (B) number of bursts; (C) intra-burst interval (IBI); (D) number of spikes in a burst; (E) burst duration. Bursts were defined as >3 spikes with <300 ms inter-spike interval. Three independent experiments were performed at each time point (16–19, 23–26, 30–33 and 37–44 DIV). n = 50–235 electrodes were sampled for each line in each time point. Data are represented as mean ± SEM. One-way ANOVA: * p < 0.05, ** p < 0.01, **** p < 0.0001.
To further compare the functional connectivity between FXS and WT networks, a cross-correlation (CC) analysis was performed (Figure 7). CC measures the distance in time between two spikes generated by different neurons in the same well. If the spikes of one neuron tend to occur at the same time as the spikes of another neuron, the CC score will be close to 1 (red square in the heat map), indicating synchronous network activity. However, if the spikes generated by different neurons constructing the network occur at different time points from the network, activity is considered non-synchronized, and the CC score will be closer to zero (blue square in the heat map of Figure 7B). They analyzed the CC of both FXS and control iNs at four time points during development (23, 30, 37 and 44 DIV). The results show that although both FX and WT neurons mature in culture and their network activity becomes more synchronous (higher CC), in FX, the neuronal network is significantly less synchronous than that of control (0.17 vs. 0.25, respectively, at 44 DIV; p < 0.004; Figure 7C).

Figure 7. Synchrony of neuronal network activity: (A) Representative synchronous (WT, left) and asynchronous (FX, right) electrical activity between two electrodes, (AU—arbitrary unit). The signals shown are spike locations that have been convoluted with Gaussian (sigma = 0.5); (B) heat maps summarizing cross-correlation (CC) among all active electrodes (≥15 spikes/min). The panel ranges from high synchrony/high CC among neurons (red), to low synchrony/ low CC (blue). Diagonal red patterns represent autocorrelation within the recorded neurons; (C) averaged values of CC electrodes. The threshold was determined to be >0.1. The same batch of neurons was recorded for all time points. Two independent experiments were performed at each time point (23, 30,37 and 44 DIV). A total of 35–207 pairs of electrodes were analyzed for each line in each time point. Data are represented as mean ± SD. T-test: * p < 0.05; ** p < 0.005.
References
- Contractor, A.; Klyachko, V.A.; Portera-Cailliau, C. Altered Neuronal and Circuit Excitability in Fragile X Syndrome. Neuron 2015, 87, 699–715.
- Richter, J.D.; Zhao, X. The molecular biology of FMRP: New insights into fragile X syndrome. Nat. Rev. Neurosci. 2021, 22, 209–222.
- Bhattacharyya, A.; McMillan, E.; Wallace, K.; Tubon, J.T.C.; Capowski, E.E.; Svendsen, C.N. Normal Neurogenesis but Abnormal Gene Expression in Human Fragile X Cortical Progenitor Cells. Stem Cells Dev. 2008, 17, 107–118.
- Winograd, C.; Ceman, S. Fragile X family members have important and non-overlapping functions. Biomol. Concepts 2011, 2, 343–352.
- Kazdoba, T.M.; Leach, P.T.; Silverman, J.L.; Crawley, J.N. Modeling fragile X syndrome in the Fmr1 knockout mouse. Intractable Rare Dis. Res. 2014, 3, 118–133.
- Drozd, M.; Bardoni, B.; Capovilla, M. Modeling Fragile X Syndrome in Drosophila. Front. Mol. Neurosci. 2018, 11, 124.
- Shamay-Ramot, A.; Khermesh, K.; Porath, H.; Barak, M.; Pinto, Y.; Wachtel, C.; Zilberberg, A.; Lerer-Goldshtein, T.; Efroni, S.; Levanon, E.; et al. Fmrp Interacts with Adar and Regulates RNA Editing, Synaptic Density and Locomotor Activity in Zebrafish. PLoS Genet. 2015, 11, e1005702.
- Gibson, J.R.; Bartley, A.; Hays, S.A.; Huber, K.M. Imbalance of Neocortical Excitation and Inhibition and Altered UP States Reflect Network Hyperexcitability in the Mouse Model of Fragile X Syndrome. J. Neurophysiol. 2008, 100, 2615–2626.
- Zhang, L.; Liang, Z.; Zhu, P.; Li, M.; Yi, Y.-H.; Liao, W.-P.; Su, T. Altered intrinsic properties and bursting activities of neurons in layer IV of somatosensory cortex from Fmr-1 knockout mice. Exp. Neurol. 2016, 280, 60–69.
- Booker, S.A.; Domanski, A.P.F.; Dando, O.R.; Jackson, A.D.; Isaac, J.T.R.; Hardingham, G.E.; Wyllie, D.J.A.; Kind, P.C. Altered dendritic spine function and integration in a mouse model of fragile X syndrome. Nat. Commun. 2019, 10, 1–14.
- Kurosaki, T.; Imamachi, N.; Pröschel, C.; Mitsutomi, S.; Nagao, R.; Akimitsu, N.; Maquat, L.E. Loss of the fragile X syndrome protein FMRP results in misregulation of nonsense-mediated mRNA decay. Nat. Cell Biol. 2021, 23, 40–48.
- Zhao, X.; Bhattacharyya, A. Human Models Are Needed for Studying Human Neurodevelopmental Disorders. Am. J. Hum. Genet. 2018, 103, 829–857.
- van Karnebeek, C.D.; Bowden, K.; Berry-Kravis, E. Treatment of Neurogenetic Developmental Conditions: From 2016 into the Future. Pediatr. Neurol. 2016, 65, 1–13.
- Lee, A.W.; Ventola, P.; Budimirovic, D.; Berry-Kravis, E.; Visootsak, J. Clinical Development of Targeted Fragile X Syndrome Treatments: An Industry Perspective. Brain Sci. 2018, 8, 214.
- Hagerman, R.J.; Berry-Kravis, E.; Hazlett, H.C.; Bailey, D.B., Jr.; Moine, H.; Kooy, R.F.; Tassone, F.; Gantois, I.; Sonenberg, N.; Mandel, J.L.; et al. Fragile X syndrome. Nat. Rev. Dis. Primers 2017, 3, 17065.
- Telias, M.; Kuznitsov-Yanovsky, L.; Segal, M.; Ben-Yosef, D. Functional Deficiencies in Fragile X Neurons Derived from Human Embryonic Stem Cells. J. Neurosci. 2015, 35, 15295–15306.
- Utami, K.H.; Skotte, N.H.; Colaço, A.R.; Yusof, N.A.B.M.; Sim, B.; Yeo, X.Y.; Bae, H.-G.; Garcia-Miralles, M.; Radulescu, C.I.; Chen, Q.; et al. Integrative Analysis Identifies Key Molecular Signatures Underlying Neurodevelopmental Deficits in Fragile X Syndrome. Biol. Psychiatry 2020, 88, 500–511.
- Das Sharma, S.; Pal, R.; Reddy, B.K.; Selvaraj, B.T.; Raj, N.; Samaga, K.K.; Srinivasan, D.J.; Ornelas, L.; Sareen, D.; Livesey, M.; et al. Cortical neurons derived from human pluripotent stem cells lacking FMRP display altered spontaneous firing patterns. Mol. Autism 2020, 11, 1–16.
- Liu, X.S.; Wu, H.; Krzisch, M.; Wu, X.; Graef, J.; Muffat, J.; Hnisz, D.; Li, C.; Yuan, B.; Xu, C.; et al. Rescue of Fragile X Syndrome Neurons by DNA Methylation Editing of the FMR1 Gene. Cell 2018, 172, 979–992.
- Graef, J.D.; Wu, H.; Ng, C.; Sun, C.; Villegas, V.; Qadir, D.; Jesseman, K.; Warren, S.T.; Jaenisch, R.; Cacace, A.; et al. Partial FMRP expression is sufficient to normalize neuronal hyperactivity in Fragile X neurons. Eur. J. Neurosci. 2019, 51, 2143–2157.
- Shi, Y.; Kirwan, P.; Smith, J.; Robinson, H.P.C.; Livesey, F.J. Human cerebral cortex development from pluripotent stem cells to functional excitatory synapses. Nat. Neurosci. 2012, 15, 477–486.
- Zhang, Y.; Pak, C.; Han, Y.; Ahlenius, H.; Zhang, Z.; Chanda, S.; Marro, S.; Patzke, C.; Acuna, C.; Covy, J.; et al. Rapid Single-Step Induction of Functional Neurons from Human Pluripotent Stem Cells. Neuron 2013, 78, 785–798.
- Avitzour, M.; Mor-Shaked, H.; Yanovsky-Dagan, S.; Aharoni, S.; Altarescu, G.; Renbaum, P.; Eldar-Geva, T.; Schonberger, O.; Levy-Lahad, E.; Epsztejn-Litman, S.; et al. FMR1 Epigenetic Silencing Commonly Occurs in Undifferentiated Fragile X-Affected Embryonic Stem Cells. Stem Cell Rep. 2014, 3, 699–706.
- Telias, M.; Mayshar, Y.; Amit, A.; Ben-Yosef, D. Molecular Mechanisms Regulating Impaired Neurogenesis of Fragile X Syndrome Human Embryonic Stem Cells. Stem Cells Dev. 2015, 24, 2353–2365.
- Park, C.-Y.; Halevy, T.; Lee, D.R.; Sung, J.J.; Lee, J.S.; Yanuka, O.; Benvenisty, N.; Kim, D.-W. Reversion of FMR1 Methylation and Silencing by Editing the Triplet Repeats in Fragile X iPSC-Derived Neurons. Cell Rep. 2015, 13, 234–241.
More
Information
Subjects:
Developmental Biology
Contributor
MDPI registered users' name will be linked to their SciProfiles pages. To register with us, please refer to https://encyclopedia.pub/register
:
View Times:
840
Revisions:
2 times
(View History)
Update Date:
01 Mar 2022
Table of Contents


Notice
You are not a member of the advisory board for this topic. If you want to update advisory board member profile, please contact office@encyclopedia.pub.
OK
Confirm
Only members of the Encyclopedia advisory board for this topic are allowed to note entries. Would you like to become an advisory board member of the Encyclopedia?
Yes
No
${ textCharacter }/${ maxCharacter }
Submit
Cancel
Back
Comments
${ item }
|
${ item.createdUser.fullName }
${ item.createdAt }
${ item.vote }
${ item.reply }
Delete
${ reply.createdUser.fullName }
${ reply.createdAt }
${ reply.vote }
Delete
There is no reply to this comment~
${ item.replyTextCharacter }/${ item.replyMaxCharacter }
Submit
Cancel
More
No more~
There is no comment~
${ textCharacter }/${ maxCharacter }
Submit
Cancel
${ selectedItem.replyTextCharacter }/${ selectedItem.replyMaxCharacter }
Submit
Cancel
Confirm
Are you sure to Delete?
Yes
No